. 2021 Jan 1;11(6):2522-2533.
doi: 10.7150/thno.49121. eCollection 2021.

Neutrophils infiltrate into the spiral ligament but not the stria vascularis in the cochlea during lipopolysaccharide-induced inflammation

Affiliations

Neutrophils infiltrate into the spiral ligament but not the stria vascularis in the cochlea during lipopolysaccharide-induced inflammation

Seong Hoon Bae et al. Theranostics. .

Abstract

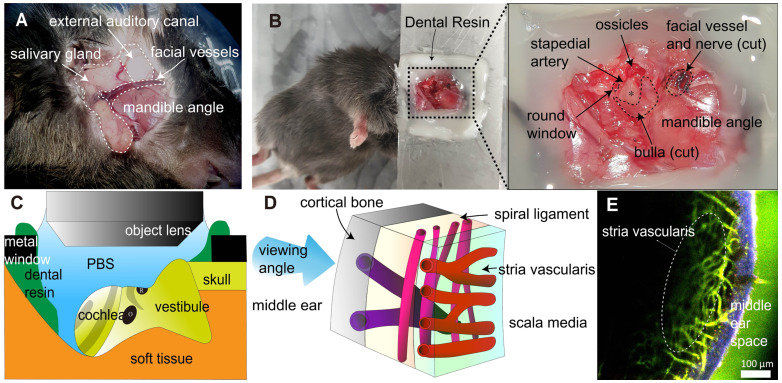
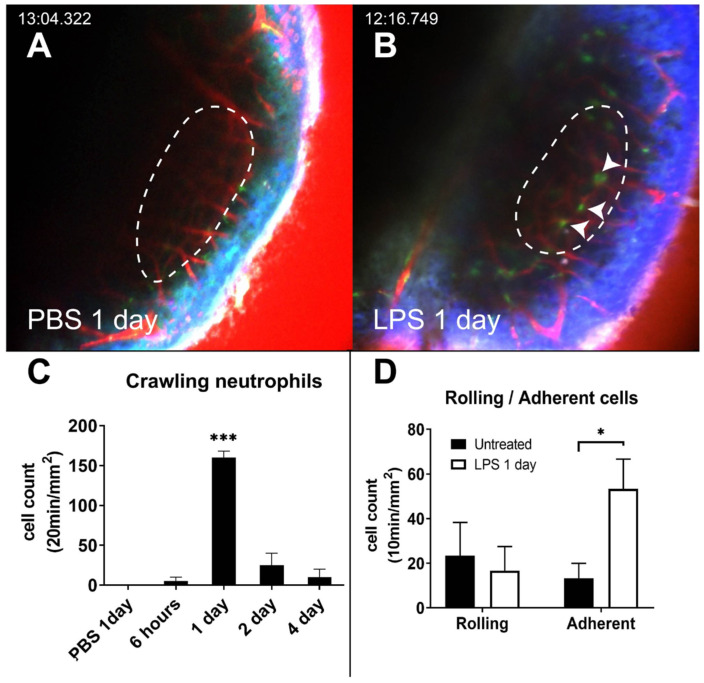
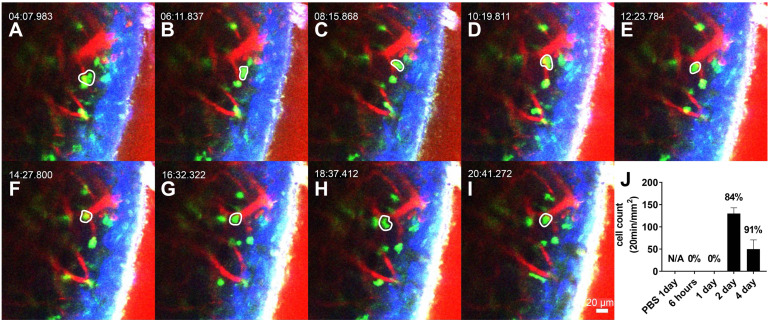
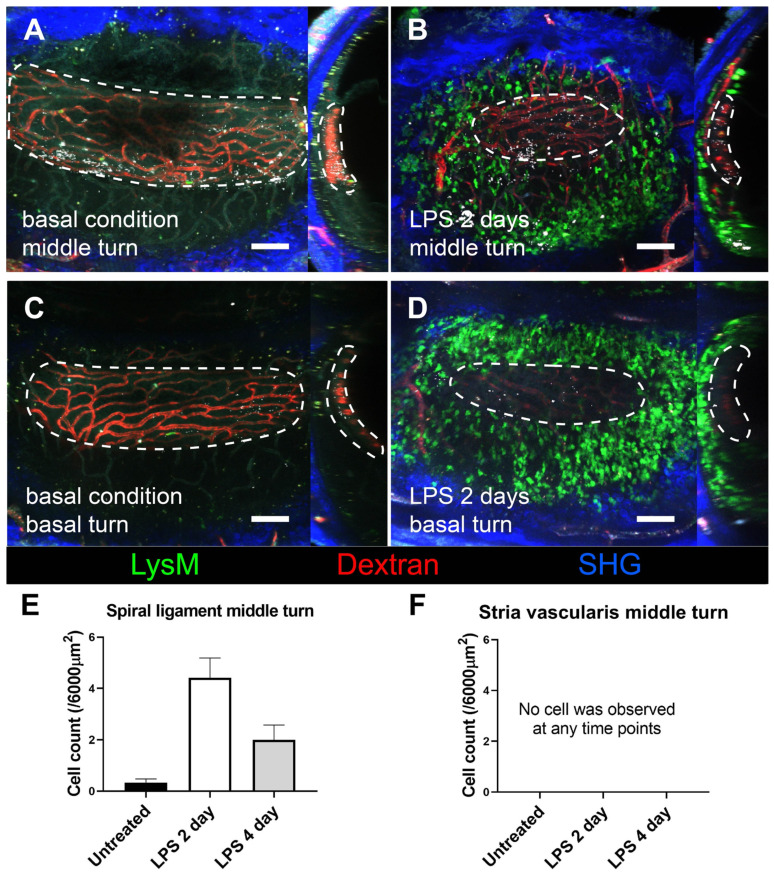
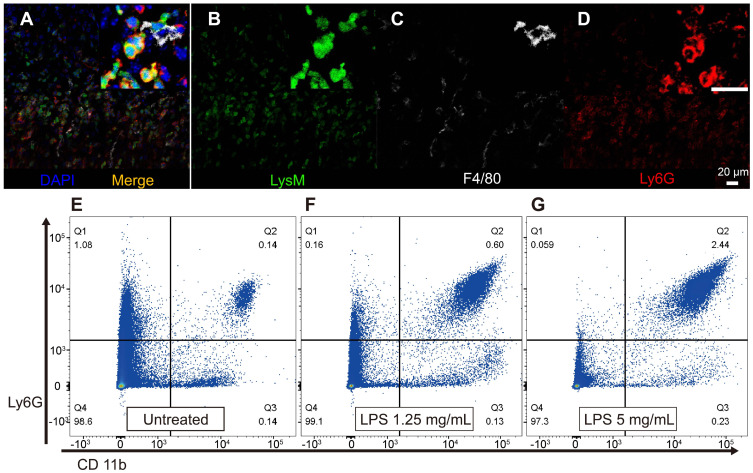
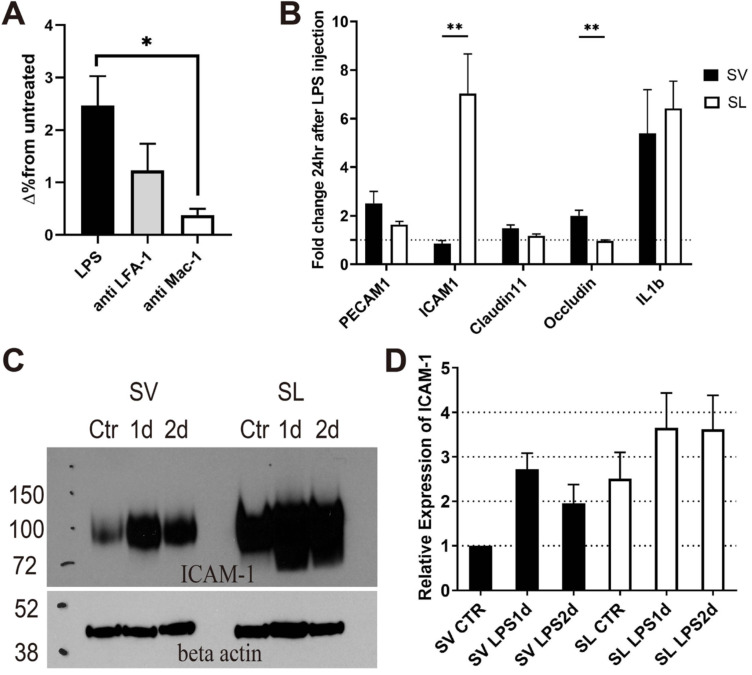
It has been challenging to apply intravital imaging for monitoring the inner ear, as the anatomical location and intricate structure hamper the access of imaging instruments to the inner ear of live mice. By employing intravital imaging of the cochlea in live mice with two-photon microscopy, we investigated neutrophil infiltration into the cochlea tissue and its characteristics under a lipopolysaccharide (LPS)-induced inflammatory state. Methods: Cochlea inflammation was induced by LPS injection to the middle ear. Using two-photon intravital microscopy with specifically designed surgical exteriorization of the cochlea in live mice, we investigated the dynamic features of neutrophils in the lateral wall of the cochlea. The molecular expression pattern of the cochlea lateral wall was also investigated during the LPS-induce inflammation. Results: Despite the contention of whether neutrophils are recruited to the spiral ligament (SL) during inflammation, we observed that LPS-induced inflammation of the middle ear, which mimics acute otitis media, triggered neutrophil migration to the SL in the lateral wall. Notably, massive neutrophil infiltration to the SL occurred 2 days after LPS inoculation, but there was no neutrophil infiltration into the stria vascularis (SV) region. At 1 day after LPS-induced cochlear inflammation, increased mRNA expression of interleukin-1β, interleukin-6 were identified in both the SL and SV, while the ICAM-1 mRNA expression increased only in the SL. The differential reactivity of ICAM-1 is likely responsible for the different neutrophil recruitment pattern in the cochlea. Conclusion: Intravital imaging of the cochlea revealed that neutrophil recruitment and infiltration during inflammation are spatially controlled and exclusively observed in the SL but not in the SV and organ of Corti.

Keywords: cochlea; neutrophil; spiral ligament; stria vascularis; two-photon intravital imaging.


Conflict of interest statement

Competing Interests: The authors have declared that no competing interest exists.

Figures

Figure 1
Figure 1
Surgical exteriorization for the intravital imaging of mouse cochlear lateral wall. (A) The anatomical remarks in the subcutaneous tissue to access cochlea were identified after posteroinferior auricular skin flap elevation. (B) The anatomical remarks related to the cochlea (asterisk). The dental resin was applied between tissue and metal window to seal liquid media. (C) Schematic diagram of the intravital imaging set up. The objective lens of two-photon microscopy approaching the mouse cochlea. The round window of the cochlea is at the top. Dental resin sealed the PBS medium. The gray strip indicates the stria vascularis. O, oval window. R, round window. (D) Schematic diagram of the cochlear lateral wall anatomy shows three different vessels layer by layer, which demonstrate different running directions. (E) Intravital image of the cochlear lateral wall, showing stria vascularis capillary (marked) and spiral ligament vessel, which run perpendicular to each other. The image was obtained after i.v. injection of FITC-dextran. The area in blue shows the second harmonic generation of cortical bone, whereas the area in green shows blood vessel image enhanced by FITC-dextran.
Figure 2
Figure 2
Intravascular crawling neutrophils in the cochlea vessels 1 day after LPS stimulation. (A and B) Intravital image of cochlear lateral wall in the LysM-GFP+/- mouse 1 day after the inoculation of the middle ear with PBS (A) and 1 day after the inoculation of the middle ear with LPS (B). The images were obtained after i.v. injection of Texas Red-dextran. The stria vascularis region is marked by the dotted line. Arrowhead indicates crawling cells in the vessel. The green region shows LysM-GFP positive cells. The red region shows blood vessels stained with Texas Red-dextran. The blue region shows the second harmonic generation of cortical bone by lasers. Scale bar = 100 µm. (C) Intravascular crawling neutrophil counts from the stria vascularis corresponding to the interval after LPS inoculation. (D) Rolling and adherent neutrophil counts from the stria vascularis were compared between untreated and LPS inoculation. (*Denotes P-value < 0.05, *** denotes P-value < 0.001 in post hoc analysis after ANOVA.)
Figure 3
Figure 3
Interstitial migrating neutrophils in the spiral ligament 2 days after middle ear inoculation with LPS. (A-I) Intravital image of the cochlear lateral wall in the LysM-GFP+/- mouse shows serial time lapse of a migrating cell (white-lined polygon). The images were obtained after i.v. injection of Texas Red-dextran. The green region shows LysM-GFP positive cells. The red region shows blood vessels stained with Texas Red-dextran. Blue region shows the second harmonic generation of cortical bone by lasers. Scale bar = 20 µm. Time interval = 2 min. (J) Quantification of the interstitial migrating cells. The percentage above the graph indicates interstitial migrating neutrophil fraction calculated as the number of interstitial migrating neutrophils divided by the total number of intravascular crawling neutrophils and interstitial migrating cells.
Figure 4
Figure 4
Stria vascularis as a neutrophil-free region during cochlea inflammation. A three-dimensional image of cochlear lateral wall using two-photon intravital microscopy shows middle turn of the untreated cochlea (A), middle turn of the inflamed cochlea with middle ear inoculation with LPS 2 days before euthanization (B), basal turn of the untreated cochlea (C), and basal turn of the inflamed cochlea with LPS middle ear inoculation 2 days before euthanization (D). In each cochlea image, the X-Y plane is presented on the left side, and the Y-Z plane of the sagittal reconstructed image is presented on the right side. The region of the stria vascularis is marked with a dotted line. After sagittal reconstruction, neutrophils were quantified in the spiral ligament adjacent to the stria vascularis (~6000 µm2) (E) and in the stria vascularis (~6000 µm2) (F). Notably, neutrophils were absent in the stria vascularis at any time point. The contralateral cochlea was obtained from the mouse after intravital imaging performed after i.v. injection of Texas Red-dextran. The green region shows LysM-GFP positive cells. The red region shows blood vessels stained with Texas Red-dextran. The blue region shows the second harmonic generation of cortical bone by lasers. All images were stacked at 30 µm. Scale bar = 100 µm.
Figure 5
Figure 5
Infiltrated LysM-GFP positive cells in the cochlear lateral wall 2 days after LPS inoculation are mainly neutrophils and the number of neutrophils increases in proportion to LPS concentration. Immunohistochemistry was performed with cell-specific markers, and a magnified image is located in the upper right corner of each image. (A-D) The merged image (A) shows LysM-GFP positive cells in green (B), F4/80-positive cells in white (C), and Ly6G-positive cells in red (D). Blue, DAPI. (E-G) Flow cytometry was performed with a different LPS dose, such as untreated control (E), LPS concentration of 1.25 mg/mL (F), and LPS concentration of 5 mg/mL (G). The y-axis represents the fluorescence intensity of Ly6G, and the x-axis represents the fluorescence intensity of CD11b. Cells in the Q2 area (Ly6G+, CD11b+) were defined as neutrophils. Scale bar = 20 µm.
Figure 6
Figure 6
Neutrophil infiltration depends on ICAM-1 in the cochlea, and ICAM-1 expression is lower in the stria vascularis than in the spiral ligament. The in vivo blockade of the ICAM-1 ligands (LFA-1 and Mac-1) decreases neutrophil infiltration in the cochlea after LPS inoculation. (A) Flow cytometry analysis showed a statistically significant difference in the number of neutrophils (Ly6G+, CD11b+) in the cochlea with LPS without blocking and LPS with anti-Mac-1 antibody treatment in vivo. (B) The fold change in mRNA expression at 1 day after LPS injection compared to basal conditions analyzed by qPCR. Notably, ICAM-1 mRNA expression was not increased in the stria vascularis, although IL-1β mRNA expression was increased. (C) Western blot analysis using anti-ICAM-1 antibody. Beta-actin was blotted on the same membrane after stripping. An representative image of Western blot was shown from three independent experiments. Six cochleae from three mice were pooled for each group per experiment. (D) Western blot was quantified by the intensity of ICAM-1 band normalized by the beta-actin band. Relative expression was compared to 'SV Ctr' (untreated group) lane. SL, spiral ligament. SV, stria vascularis (** denotes P-value < 0.005, in post-hoc analysis after ANOVA).

Similar articles

Cited by

References

    1. Diaspro A, Robello M. Two-photon excitation of fluorescence for three-dimensional optical imaging of biological structures. J Photochem Photobiol B. 2000;55:1–8. - PubMed
    1. Helmchen F, Denk W. Deep tissue two-photon microscopy. Nat Methods. 2005;2:932–40. - PubMed
    1. Park SA, Choe YH, Lee SH, Hyun YM. Two-photon Intravital Imaging of Leukocytes During the Immune Response in Lipopolysaccharide-treated Mouse Liver. J Vis Exp. 2018;(132):57191. - PMC - PubMed
    1. Chen L, Cho MK, Wu D, Kim HM, Yoon J. Two-Photon Fluorescence Probe for Selective Monitoring of Superoxide in Live Cells and Tissues. Anal Chem. 2019;91:14691–6. - PubMed
    1. Chen L, Park SJ, Wu D, Kim HM, Yoon J. A two-photon fluorescent probe for colorimetric and ratiometric monitoring of mercury in live cells and tissues. Chem Commun (Camb) 2019;55:1766–9. - PubMed

Publication types

Substances