. 2021 Jan 1;11(6):2892-2916.
doi: 10.7150/thno.50928. eCollection 2021.

Tumor microenvironment remodeling and tumor therapy based on M2-like tumor associated macrophage-targeting nano-complexes

Affiliations

Tumor microenvironment remodeling and tumor therapy based on M2-like tumor associated macrophage-targeting nano-complexes

Shulan Han et al. Theranostics. .

Abstract

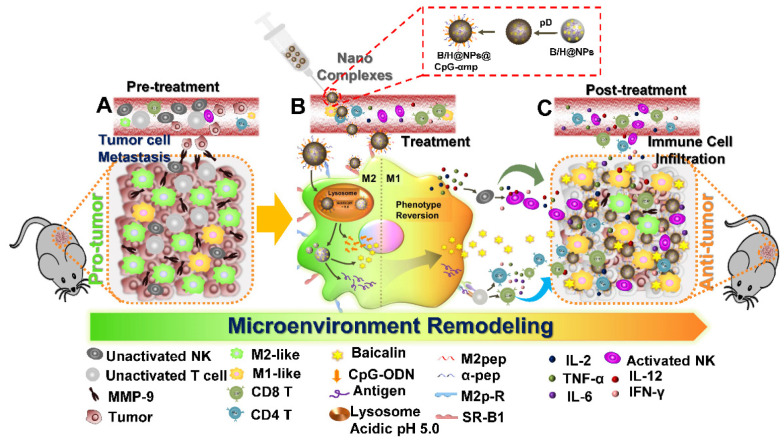
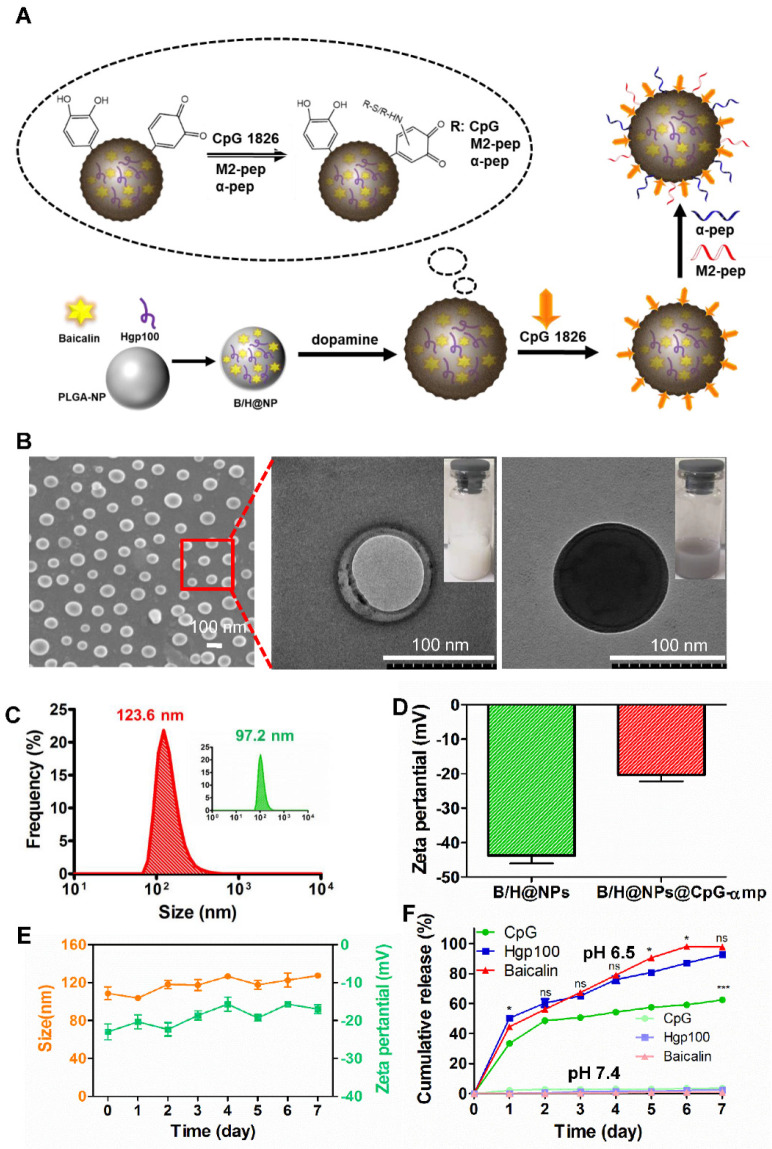
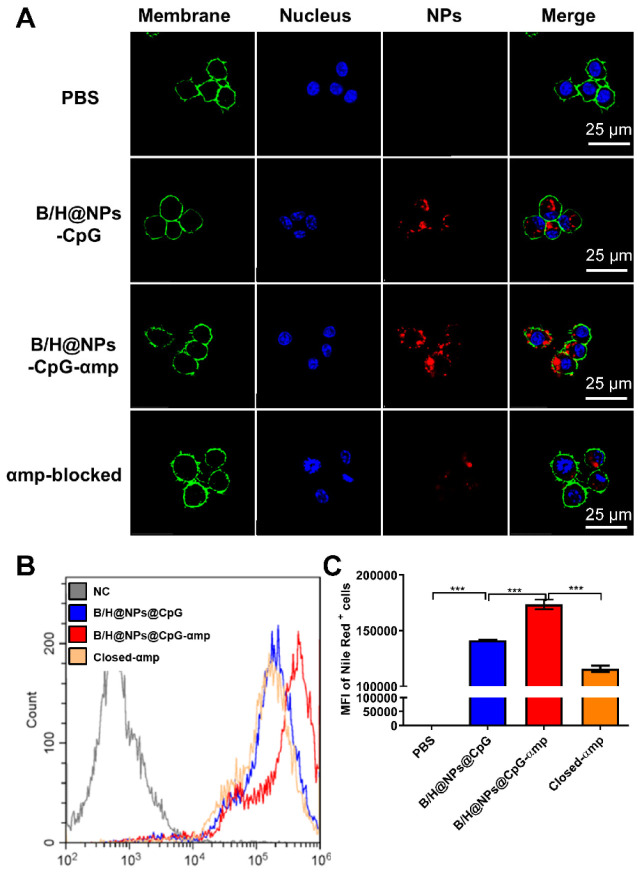
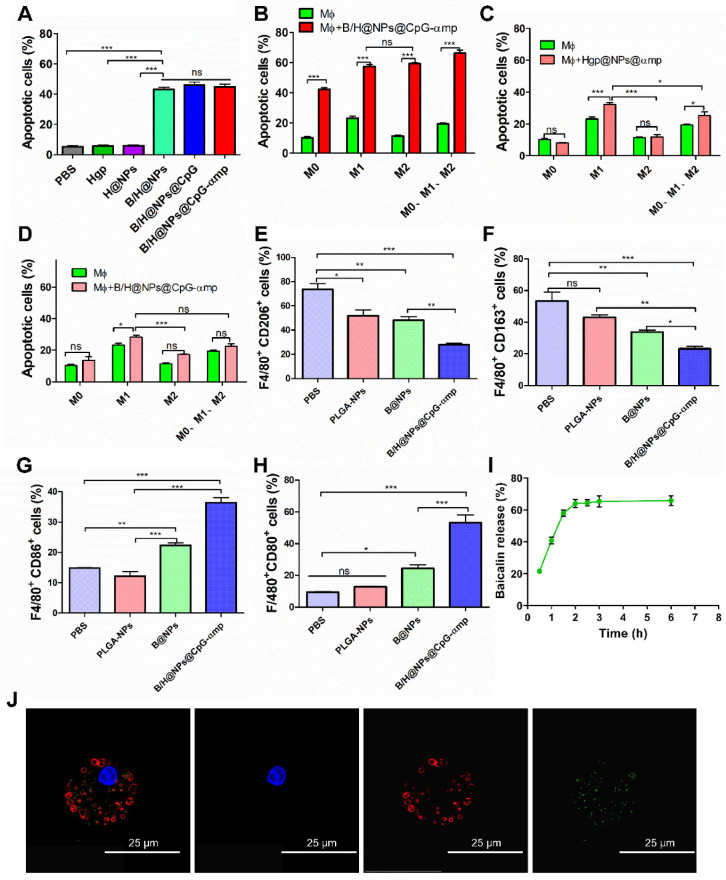
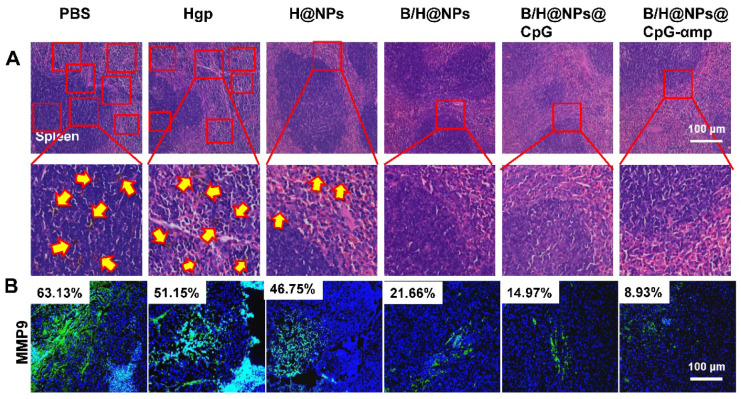
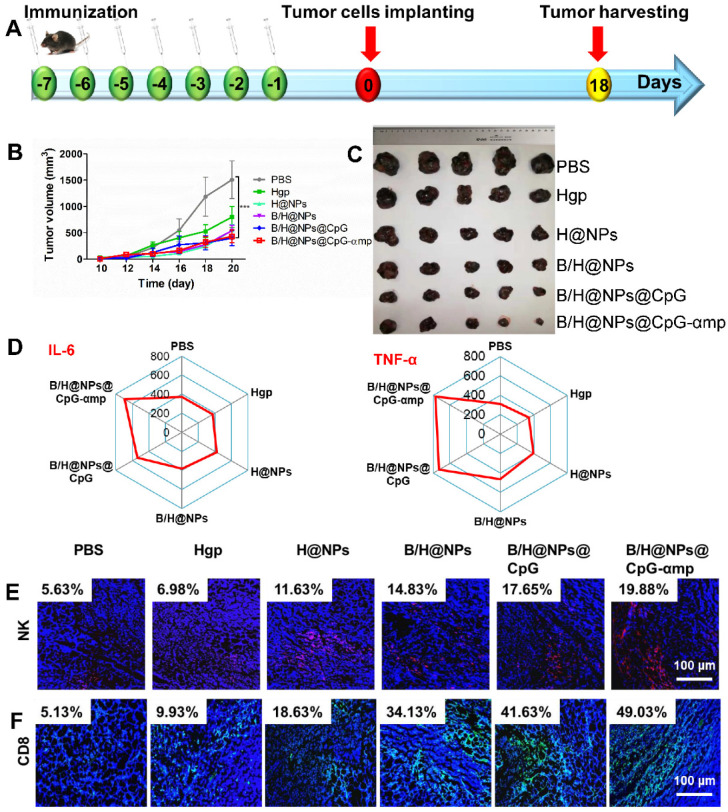
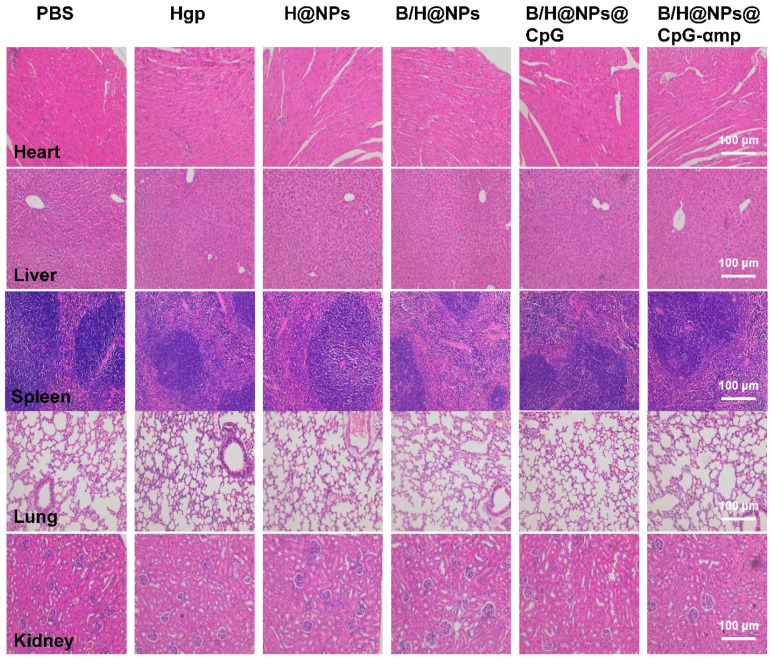
Background: Among the many immunosuppressive cells in the tumor microenvironment, tumor-associated-macrophages (TAMs) are well known to contribute to tumor development. TAMs can be conditioned (polarized) to transition between classical M1-like macrophages, or alternatively to M2-like macrophages. Both are regulated by signaling molecules in the microenvironment. M1-like TAMs can secrete classic inflammatory cytokines that kill tumors by promoting tumor cell necrosis and immune cell infiltration into the tumor microenvironment. In contrast, M2-like TAMs exhibit powerful tumor-promoting functions, including degradation of tumor extracellular matrix, destruction of basement membrane, promotion of angiogenesis, and recruitment of immunosuppressor cells, all of which further promote tumor progression and distal metastasis. Therefore, remodeling the tumor microenvironment by reversing the TAM phenotype will be favorable for tumor therapy, especially immunotherapy. Methods: PLGA nanoparticles encapsulating baicalin and melanoma antigen Hgp peptide fragment 25-33 were fabricated using the ultrasonic double-emulsion technique. The nanoparticles were further loaded with CpG fragments and used conjugated M2pep and α-pep peptides on their surfaces to produce novel nano-complexes. The capability to target M2-like TAMs and anti-tumor immunotherapy effects of nano-complexes were evaluated by flow cytometry and confocal microscopy in vitro. We also investigated the survival and histopathology of murine melanoma models administrated with different nanocomplexes. Improvements in the tumor microenvironment for immune attack of melanoma-bearing mice were also assessed. Results: The nano-complexes were effectively ingested by M2-like TAMs in vitro and in vivo, and the acidic lysosomal environment triggered the disintegration of polydopamine from the nanoparticle surface, which resulted in the release of the payloads. The released CpG played an important role in transforming the M2-like TAMs into the M1-like phenotype that further secreted inflammatory cytokines. The reversal of TAM released cytokines and gradually suppressed tumor angiogenesis, permitting the remodeling of the tumor microenvironment. Moreover, the activated TAMs also presented antigen to T cells, which further stimulated the antitumor immune response that inhibited tumor metastasis. Activated T cells released cytokines, which stimulated NK cell infiltration and directly resulted in killing tumor cells. The baicalin released by M1-like TAMs also killed tumor cells. Conclusion: The nano-complexes facilitated baicalin, antigen, and immunostimulant delivery to M2-like TAMs, which polarized and reversed the M2-like TAM phenotype and remodeled the tumor microenvironment to allow killing of tumor cells.

Keywords: anti-tumor therapy; nano-complex; tumor associated macrophage; tumor microenvironment.


Conflict of interest statement

Competing Interests: The authors have declared that no competing interest exists.

Figures

Scheme 1
Scheme 1
Schematic illustration of the action of nano-complexes in targeting M2-like macrophages for remodeling the tumor microenvironment. The scheme highlights the TAM phenotype reversal and tumor microenvironment transformation after treatment.
Figure 1
Figure 1
Preparation and characterization of the PLGA nano-complexes. (A) Schematic illustration of the PLGA nano-complexes preparation steps. (B) SEM and TEM images of the nano-complexes: NPs and pD@NPs, scale bar = 100 nm. (C) Size distributions of the nano-complexes: NPs and pD@NPs in pH 7.4 PBS. (D) Zeta potential of nano-complexes: NPs and pD@NPs in pH 7.4 PBS. (E) Variations of average size and zeta potential of nano-complexes: B/H@NPs@CpG-αmp in pH 7.4 PBS over 7 days. (F) Payload release profiles of nano-complexes: B/H@NPs@CpG-αmp in pH 6.5 and pH 7.4 PBS at 37°C over 7 days. The “*” is for Baicalin vs Hpg100; the “ns” is for Baicalin vs Hpg100, and the “***” is for Baicalin vs CpG, or Hpg100 vs CpG. Data are expressed as the mean ± standard error of the mean (SEM), n = 3. Differences between two groups were tested using an unpaired, two-tailed Student's t-test. Differences among multiple groups were tested with one-way ANOVA followed by Tukey's multiple comparison. Significant differences between groups are expressed as follows: *P < 0.05, **P < 0.01, or ***P < 0.001.
Figure 2
Figure 2
Nano-complexes targeting capacity to M2-like macrophages in vitro determined by confocal imaging and flow cytometry. (A) The M2-like macrophage targeting capability of the nano-complexes: B/H@NPs@CpG, B/H@NPs@CpG-αmp, and αmp-blocked was analyzed by confocal microscopy, scale bar = 25 μm. (B, C) The M2-like macrophage targeting capability of the nano-complexes B/H@NPs@CpG, B/H@NPs@CpG-αmp, and αmp-blocked was analyzed by flow cytometry. The group of αmp-blocked samples received pretreatment by administrating saturating concentrations of M2pep and α-peptide in advance of the administration of nano-complexes. Data are expressed as the mean ± standard error of the mean (SEM), n = 3. Differences between two groups were tested using an unpaired, two-tailed Student's t-test. Differences among multiple groups were tested with one-way ANOVA followed by Tukey's multiple comparison. Significant differences between groups are expressed as follows: *P < 0.05, **P < 0.01, or ***P < 0.001.
Figure 3
Figure 3
Capability of different nano-complexes to reverse TAMs phenotypes and anti-tumor mechanism in vitro. (A) Apoptosis analysis of B16 cells by flow cytometry using Annexin V-FITC/PI labeling at 24 h after treatment with different nano-complexes. (B) The Annexin V-FITC/PI apoptosis detection analysis of B16 cells co-cultured across Trans well plates with different types of macrophages and incubation with M2-like macrophages-targeting nano-complex: B/H@NPs@CpG-αmp. There are 2 × 10⁴/well T cells in this microenvironment. Data obtained at 24 h after treatment by flow cytometry. (C) The Annexin V-FITC/PI apoptosis detection analysis of B16 cells co-cultured with different types' macrophages and incubation with Hgp@NPs@αmp without baicalin and CpG. There are 2 × 10⁴/well T cells in this microenvironment. (D) The Annexin V-FITC/PI apoptosis detection analysis of B16 cells co-cultured across Trans well plates with different macrophages after incubating with B/H@NPs@CpG-αmp. There are no T cells in this microenvironment. (E, F) CD206 and CD163 expression in M2-like macrophages after treatment with different formulations. (G, H) The expression of CD86 and CD80 in M1-like macrophages after treatment with different formulations. Data obtained at 24 h after treatment by flow cytometry. (I) Images of the lysosomal escape of nano-complexes within macrophages; Blue: nucleus, Red: lysosomal fraction, Green: nano-complex. (J) The release percentages of baicalin from nano-complexes taken up by macrophages. Three independent experiments were analyzed in every group, n = 3. Data are expressed as the mean ± standard error of the mean (SEM). Differences between two groups were tested using an unpaired, two-tailed, Student's t-test. Differences among multiple groups were tested with one-way ANOVA followed by Tukey's multiple comparison. Significant differences between groups were expressed as follows: *P < 0.05, **P < 0.01, or ***P < 0.001.
Figure 4
Figure 4
Evaluation of nano-complexes of B/H@NPs@CpG-αmp for in vivo targeting of M2-like TAMs. (A) Representative immunofluorescence images for detection of F4/80+ and CD206+ TAM targets using B/H@NPs@CpG and B/H@NPs@CpG-αmp nano-complexes at 6 h, 12 h, 24 h after treatment. Yellow color represents co-localization of nano-complexes and TAMs. Blue: cell nucleus, red: nano-complex, green: CD206+ TAMs. Scale bar: 50 µm. (B, C) Quantitative analysis of B/H@NPs@CpG and B/H@NPs@CpG-αmp targeting to F4/80+, CD206+ TAMs by flow cytometry. Three independent experiments were analyzed in every group, n = 3. Data are expressed as the mean ± standard error of the mean (SEM). Differences between two groups were tested using an unpaired, two-tailed Student's t-test. Differences among multiple groups were tested with one-way ANOVA followed by Tukey's multiple comparison. Significant differences between groups are expressed as follows: *P < 0.05, **P < 0.01, or ***P < 0.001.
Figure 5
Figure 5
The TAMs phenotype reversion at tumor sites after treatment by different nano-complexes. The M2-like TAMs surface markers CD163 (A) and CD206 markers (B) together with M1-like surface markers CD86 (C) and MHC II markers (D) of TAMs were analyzed by flow cytometry. (E, F) The TAMs of M2-like (CD206) and M1-like (CD86) phenotypes were detected by immunofluorescence. Blue: cell nucleus, red: CD86+ cells, green: CD206+ cells. (G) The TAM phenotypes of M1-like (single color fill) and M2-like (hatched grid fill) area fractions within tumor tissue as represented respectively by CD86 and CD206 biomarkers after treatment with different nano-complexes. The data were analyzed by automatic multispectral imaging system (PerkinElmer Vectra II). For Figures E-G, the quantifications are shown in Figure S7A-C. Scale bar: 100 μm. Three mice were analyzed in every group (n = 3), and one representative image is displayed per group. Data are expressed as the mean ± standard error of the mean (SEM). Differences between two groups were tested using an unpaired, two-tailed Student's t-test. Differences among multiple groups were tested with one-way ANOVA followed by Tukey's multiple comparison. Significant differences between groups are expressed as follows: *P < 0.05, **P < 0.01, or ***P < 0.001.
Figure 6
Figure 6
Different nano-complexes remodel the tumor microenvironment in B16 tumor-bearing mice. (A) The expression of IL-12, IL-2, IFN-γ and IL-10 cytokines at the tumor site were analyzed using an ELISA kit. (B, C, D) The activation of Th1 cells (CD4+ T), cytotoxic T cells (CD8+ T), and natural killer cells (NK) in tumors were examined via flow cytometry. (E, F, G) The infiltration of Th1 (CD4+/IFN-γ), CD8+, and NK cells at tumor sites examined by immunofluorescent staining. Blue: nucleus, Red: CD4+ cells, Green: IFN-γ, CD8+ cells, and NK cells, Yellow: the co-localization of CD4+ cells and IFN-γ. The data were analyzed by automatic multispectral imaging system (PerkinElmer Vectra II). Scale bar:100 μm. For E-G, the quantifications are shown in Figure S9A-C. Three mice were analyzed in every group (n = 3), and one representative image per group are displayed. Data are the mean ± SEM and representative of three independent experiments. Differences between two groups were tested using an unpaired, two-tailed Student's t-test. Differences among multiple groups were tested with one-way ANOVA followed by Tukey's multiple comparison. Significant differences between groups are expressed as follows: *P < 0.05, **P < 0.01, or ***P < 0.001.
Figure 7
Figure 7
Effective anti-tumor and tumor microenvironment remodeling after treatment with different nano-complexes in the B16 tumor model. (A) Schematic illustration of the time sequence of administration of nano-complex to tumor-bearing mice. (B) Tumor volume from mice that received iv infusion containing different nano-complexes. (C) Tumor inhibition fractions after receiving iv infusion of various nano-complexes formulations. (D) Evidence of necrosis in tumors after treatment with different nano-complexes by hematoxylin and eosin (H&E) staining. (E) Caspase-3 analysis of tumor tissue indicating apoptotic cells by immunofluorescence in frozen tumor sections. (F) The number of vessels per image field is identified by CD31 label after treatment with different nano-complexes. (G) VEGF labeled by immunofluorescence indicates the quality of pro-angiogenesis secretion per image field after treatment with different nano-complexes. The data were analyzed by automatic multispectral imaging system (PerkinElmer Vectra II). Scale bar: 100 μm. For E-G, the quantifications are shown in Figure S11A-C. Three mice were analyzed in every group (n = 3), and one representative image per group is displayed. Data are the mean ± SEM and representative of three independent experiments. Differences between two groups were tested using an unpaired, two-tailed Student's t-test. Differences among multiple groups were tested with one-way ANOVA followed by Tukey's multiple comparison. Significant differences between groups are expressed as follows: *P < 0.05, **P < 0.01, or ***P < 0.001.
Figure 8
Figure 8
The different nano-complex formulations decreased metastasis of tumor cells from tumor sites. (A) Spleen metastasis indicated by the yellow arrow showing hematoxylin and eosin (H&E) staining. (B) Matrix metalloproteinases (MMPs) associated with metastasis were analyzed by immunofluorescence staining of MMP9. Blue: nucleus, Green: the expression of MMP9. The data were analyzed by automatic multispectral imaging system (PerkinElmer Vectra II). Scale bar, 100 μm. For B, the quantification is shown in Figure S16. Three mice were analyzed in every group (n = 3), and one representative image per group is displayed. Data are the mean ± SEM and representative of three independent experiments.
Figure 9
Figure 9
Tumor inhibition determined after receiving i.v. injections of nano-complexes as preventive vaccination utilizing leukocyte priming. (A) Schematic illustration of timing schedule for administration. (B) Tumor volume in animals that received i.v. injections of nano-complexes. (C) Images of tumors harvested from mice in each treatment group. (D) The expression of IL-6 and TNF-α in serum of tumor-bearing mice analyzed using an ELISA kit. For B-D, data are the mean ± SEM and representative of five independent experiments (n = 5). Significant differences between groups were expressed as follows: *P < 0.05, **P < 0.01, or ***P < 0.001. (E, F) The infiltration of CD8+ T cells and NK cells at tumor sites was examined by immunofluorescent staining. Blue: nucleus, Red: NK cells, Green: CD8+ T cells. The data were analyzed by automatic multispectral imaging system (PerkinElmer Vectra II). For E and F, the quantification is shown in Figure S18. Scale bar, 100 μm. Three mice were analyzed in every group (n = 3), and one representative image per group is displayed. Data are the mean ± SEM and representative of three independent experiments.
Figure 10
Figure 10
In vivo toxicity of nano-complex formulations. H&E-stained slice images of major organs from the different groups.

Similar articles

Cited by

References

    1. Chen W, Zheng R, Baade PD, Zhang S, Zeng H, Bray F. et al. Cancer statistics in China, 2015. CA Cancer J Clin. 2016;66:115–132. - PubMed
    1. Siegel RL, Miller KD, Jemal A. Cancer statistics, 2016. CA Cancer J Clin. 2016;66:7–30. - PubMed
    1. Choi JN, Sun EG, Cho SH. IL-12 Enhances Immune Response by Modulation of Myeloid Derived Suppressor Cells in Tumor Microenvironment. Chonnam Med J. 2019;55:31–39. - PMC - PubMed
    1. Daneshmandi S, Shahrokhi S. Engineering Tumor Cells with Tumor Necrosis Factor α (TNF-α) or CD40 Ligand (CD40L) Genes Induce Anti-tumor Immune Responses. Int J Pept Res Ther. 2018;25:427–436.
    1. Cassetta L, Kitamura T. Macrophage targeting: opening new possibilities for cancer immunotherapy. Immunology. 2018;155(3):285–293. - PMC - PubMed

Publication types

MeSH terms