. 2021 Jan 5;12(1):22-36.
doi: 10.18632/oncotarget.27859.

Characterization of FGFR signaling in prostate cancer stem cells and inhibition via TKI treatment

Affiliations

Characterization of FGFR signaling in prostate cancer stem cells and inhibition via TKI treatment

Juyeon Ko et al. Oncotarget. .

Abstract

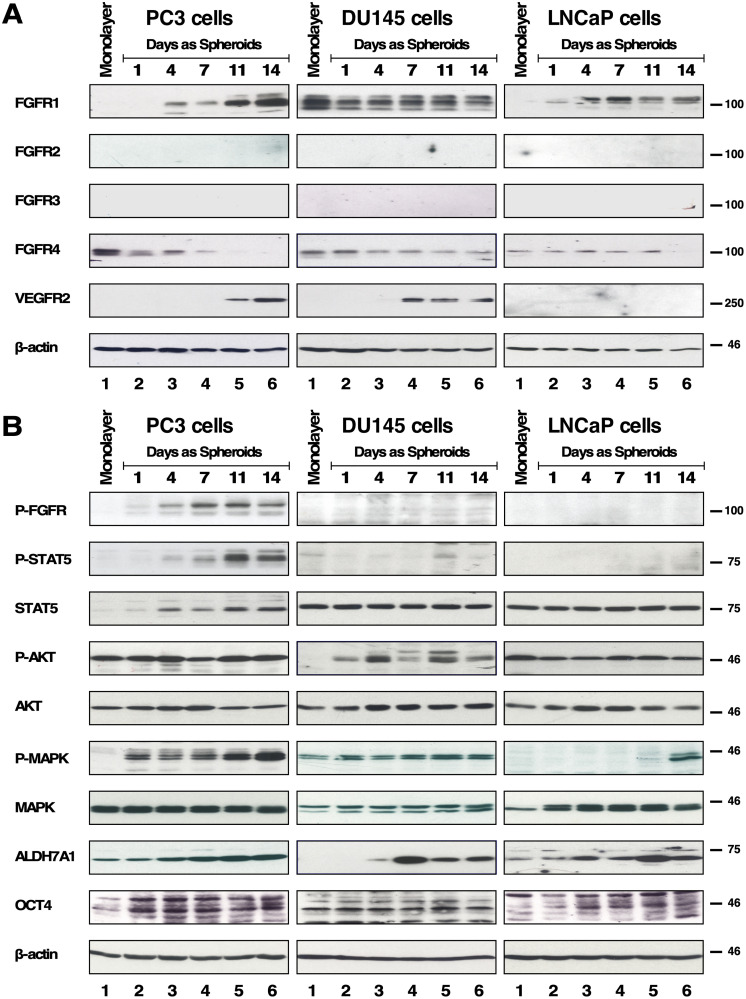
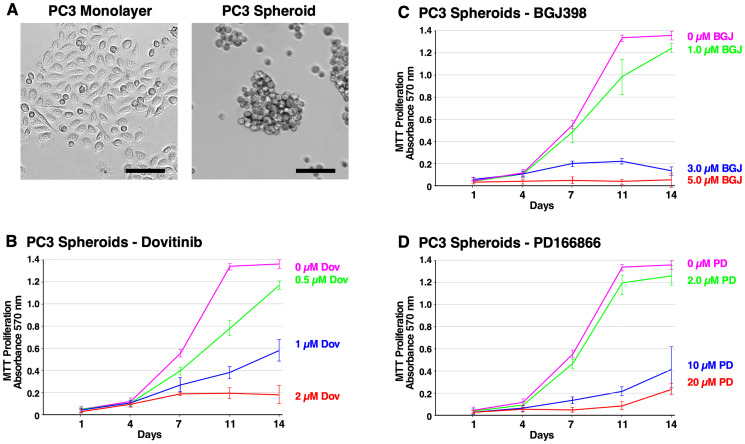
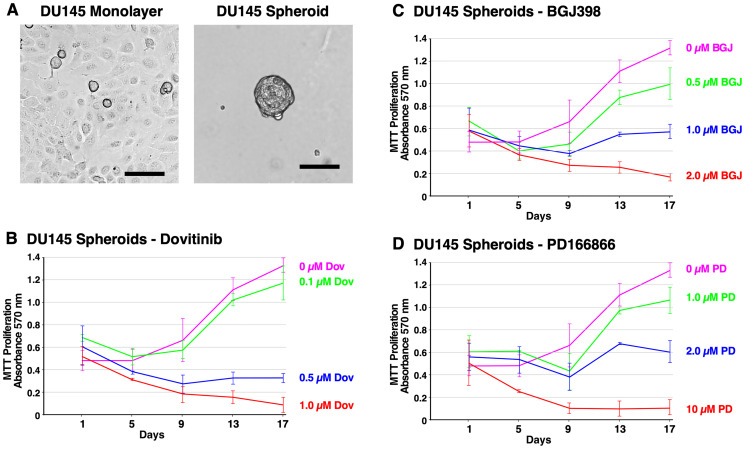
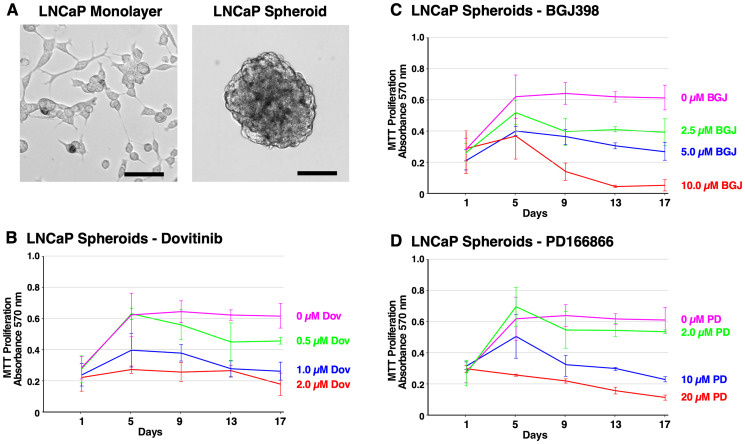
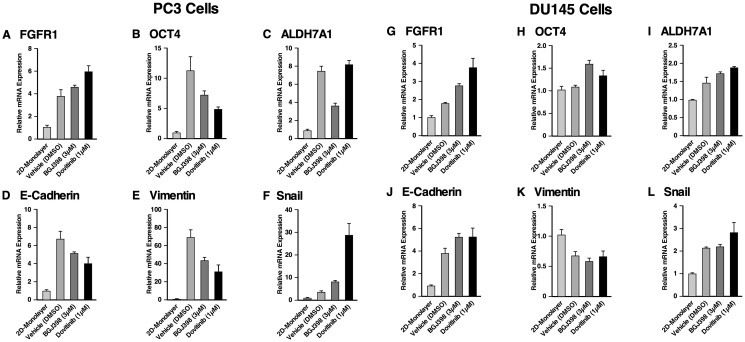
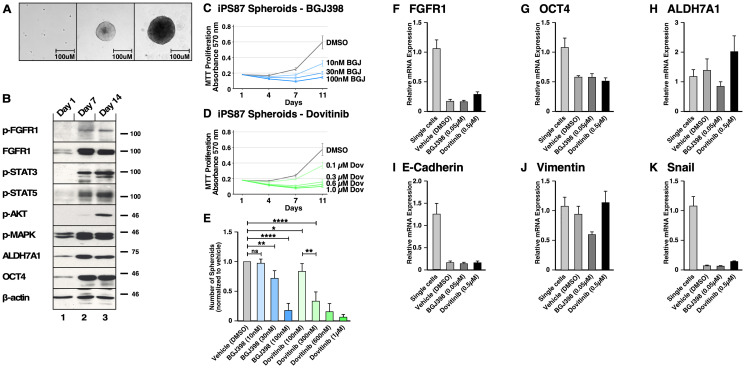
Metastatic castrate-resistant prostate cancer (CRPC) remains uncurable and novel therapies are needed to better treat patients. Aberrant Fibroblast Growth Factor Receptor (FGFR) signaling has been implicated in advanced prostate cancer (PCa), and FGFR1 is suggested to be a promising therapeutic target along with current androgen deprivation therapy. We established a novel in vitro 3D culture system to study endogenous FGFR signaling in a rare subpopulation of prostate cancer stem cells (CSCs) in the cell lines PC3, DU145, LNCaP, and the induced pluripotent iPS87 cell line. 3D-propagation of PCa cells generated spheroids with increased stemness markers ALDH7A1 and OCT4, while inhibition of FGFR signaling by BGJ398 or Dovitinib decreased cell survival and proliferation of 3D spheroids. The 3D spheroids exhibited altered expression of EMT markers associated with metastasis such as E-cadherin, vimentin and Snail, compared to 2D monolayer cells. TKI treatment did not result in significant changes of EMT markers, however, specific inhibition of FGFR signaling by BGJ398 showed more favorable molecular-level changes than treatment with the multi-RTK inhibitor Dovitinib. This study provides evidence for the first time that FGFR1 plays an essential role in the proliferation of PCa CSCs at a molecular and cellular level, and suggests that TKI targeting of FGFR signaling may be a promising strategy for AR-independent CRPC.

Keywords: metastatic castrate-resistant prostate cancer; spheroid culture; tyrosine kinase inhibitor.


Conflict of interest statement

CONFLICTS OF INTEREST Authors have no conflicts of interest to declare.

Figures

Figure 1
Figure 1. Expression and downstream cell signaling activation of FGFR of spheroids of PC3, DU145 and LNCaP.
(A) 2D monolayer cells and 3D spheroids of PC3, DU145 and LNCaP cells on days 1, 4, 7, 11, and 14 were subjected to Westernblot analysis for FGFR 1-4, and VEGFR2. Beta-actin was used as a loading control. M = 2D monolayer. (B) (1st row) FGFR activation was shown by immunoblotting for phospho-Y653/654 FGFR antiserum and only PC3 spheroids showed positive signal. (2nd row) STAT5 activation was detected by immunoblotting for phospho-Y694-STAT5, and the same membrane was stripped and probed for total STAT5 expression shown immediately below. (4th row) AKT activation was detected by immunoblotting for phospho-S473-AKT, and the same membrane was stripped and probed for total AKT expression shown immediately below. (6th row) MAPK activation was shown by immunoblotting for phospho-T202/Y204-MAPK, and the same membrane was stripped and probed for total MAPK shown immediately below. (8th row) ALDH7A1 expression. (9th row) OCT4 expression. (10th row) Beta-actin was used as a loading control.
Figure 2
Figure 2. Formation of PC3 spheroids and inhibition of survival and growth via TKI treatment.
(A) Brightfield microscope images of PC3 cells. Left; 2D monolayer. Right; 3D spheroids at 14 days. The scale bars indicate 100 μm. (BD) Biological triplicate cultures of PC3 3D spheroids were grown in RPMI 1640 with 10% SR on agarose-coated dishes. Samples of cultures were taken and assayed by MTT metabolic assay indicating the number of viable cells on days 1, 4, 7, 11, and 14 to show the proliferation over time. (B) 2–20 μM of PD166866 was treated. (C) 1–5 μM of BGJ398 was treated. (D) 0.5–2 μM of Dovitinib was treated. Error bars show the standard deviation. PD = PD166866, BGJ = BGJ398, Dov = Dovitinib.
Figure 3
Figure 3. Formation of DU145 spheroids and inhibition of survival and growth via TKI treatment.
(A) Brightfield microscope images of DU145 cells. Left; 2D monolayer. Right; 3D spheroids at 14 days. The scale bars indicate 100 μm. (BD) Biological triplicate cultures of PC3 3D spheroids were grown in RPMI 1640 with 10% SR on agarose-coated dishes. Samples of cultures were taken and assayed by MTT metabolic assay indicating the number of viable cells on days 1, 4, 7, 11, and 14 to show proliferation over time. (B) PC3 spheroids were treated with 2–20 μM PD166866. (C) PC3 spheroids were treated with 1–5 μM BGJ398. (D) PC3 spheroids were treated with 0.5–2 μM Dovitinib. Error bars show the standard deviation. PD = PD166866, BGJ = BGJ398, Dov = Dovitinib.
Figure 4
Figure 4. Formation of LNCaP spheroids and inhibition of survival and growth via TKI treatment.
(A) Brightfield microscope images of LNCaP cells. Left; 2D monolayer. Right; 3D spheroids at 14 days. The scale bars indicate 100 μm. (BD) Biological triplicate cultures of LNCaP 3D spheroids were grown in RPMI 1640 with 10% SR on agarose-coated dishes. As described in Material and Methods, samples of cultures were taken and assayed by MTT metabolic assay indicating the number of viable cells on days 1, 5, 9, 13, and 17 to show the proliferation over time. (B) LNCaP spheroids were treated with 2–20 μM PD166866. (C) LNCaP spheroids were treated with 2.5–10 μM BGJ398. (D) LNCaP spheroids were treated with 0.5–2 μM Dovitinib. Error bars show the standard deviation. PD = PD166866, BGJ = BGJ398, Dov = Dovitinib.
Figure 5
Figure 5. The effects of FGFR TKI treatment on 3D spheroid signaling pathways.
All inhibitors were added every 3-4 days during 2 weeks of culture in biological triplicate and lysates were subjected to western blot analysis. (A) PC3 spheroids were treated with PD166866 was at (L) 2 μM, (H) 10 μM; with BGJ398 at (L) 1 μM, (H) 3 μM; or with Dovitinib at (L) 0.5 μM, (H) 1 μM concentrations. (Panels 1, 2) Expression of FGFR1 and VEGFR2; (Panel 3) p-FGFR signal was detected using p-Y653/654 antibody; (Panel 4) p-STAT5 detected by p-Y694 antibody; (Panel 5) p-AKT was probed using p-S473 antibody; (Panel 6) p-MAPK signal shown by phospho-p44/42 MAPK (Erk1/2) (T202/Y204); (Panel 7) Expression of ALDH7A1; (Panel 8) Expression of OCT4 expression; (Panel 9) Beta-actin as a loading control. (B) DU145 spheroids were treated with PD166866 at (L) 1 μM, (H) 2 μM; with BGJ398 at (L) 0.5 μM, (H) 1 μM; or with Dovitinib at (L) 0.1 μM, (H) 0.3 μM concentrations. (Panels 1, 2, and 3) Expression of FGFR1 FGFR4 and VEGFR2; (Panel 4) p-AKT; (Panel 5) p-MAPK; (Panel 6) Expression of ALDH7A1; (Panel 7) OCT4 expression; (Panel 8) Beta-actin as a loading control. (C) LNCaP spheroids were treated with PD166866 at (L) 2 μM, (H) 8 μM; with BGJ398 at (L) 2.5 μM, (H) 5 μM; or with Dovitinib at (L) 0.5 μM, (H) 1 μM concentrations. (Panels 1, 2) Expression of FGFR1 and FGFR4; (Panel 3) p-AKT; (Panel 4) p-MAPK signal; (Panels 5, 6) Expression of ALDH7A1 and OCT4; (Panel 7) Beta-actin as a loading control.
Figure 6
Figure 6. Gene expression of the spheroids of PC3 and DU145 cell lines compared to 2D monolayer culture and their response to FGFR inhibition.
RT-qPCR was performed on PC3 cells grown in a monolayer, and PC3 cells grown as spheroids either with or without TKI treatment. The following target genes were analyzed through mRNA expression: (A) FGFR1, (B) OCT4, a stem cell marker, (C) ALDH7A1, prostate specific CSC marker, and (D) the epithelial marker, E-cadherin, (E, F) the mesenchymal markers, vimentin and Snail. mRNA expression was normalized against beta-actin and the fold changes were evaluated. RT-qPCR was performed on DU145 cells grown in a monolayer, and DU145 cells grown as spheroids either with or without TKI treatment. The following target genes were analyzed through mRNA expression: (G) FGFR1, (H) OCT4, (I) ALDH7A1, (J) E-cadherin, (K) vimentin and (L) Snail. mRNA expression was normalized against beta-actin and the fold changes were evaluated. The data represent the average of three biological independent experiments and the error bars represent standard error of the means (mean ± SEM).
Figure 7
Figure 7. FGFR signaling in induced Pluripotent Stem (iPS) 87 Spheroids.
(A) Left panel shows single cells of iPS87 after 24 hours of culturing on a TC plate in ES+/+ medium; middle panel shows growth of a spheroid at day 7; right panel shows a spheroid at day 14. The scale bars indicate 100 μm. (B) iPS87 cells on day 1 as single cells in lane 1, 3D spheroids on day 7 in lane 2, and 3D spheroids on day 14 in lane 3 were immunoblotted for: (1st row) FGFR activation was shown by immunoblotting for phospho-Y653/654 FGFR antiserum; (2nd row) Total FGFR1 expression was is shown; (3rd row) STAT3 activation was detected by immunoblotting for phospho-Y705-STAT3; (4th row) STAT5 activation was detected by immunoblotting for phospho-Y694-STAT5; (5th row) AKT activation was detected by immunoblotting for phospho-S473-AKT; (6th row) MAPK activation was shown by immunoblotting for phospho-T202/Y204-MAPK; (7th row) Total ALDH7A1 expression; (8th row) OCT4 expression is shown; (9th row) Beta-actin was used as a loading control. (CE) Triplicate cultures of 3D spheroids of iPS87 were grown in ES+/+ on 12-well TC plates. Samples of cultures were assayed by MTT metabolic assay indicating the number of viable cells on days 1, 4, 7, and 11 to show the proliferation over time. (C) iPS87 spheroids were treated with 10–100 nM of BGJ398. (D) iPS87 spheroids were treated with 100–1 μM of Dovitinib. All experiments were performed in biological triplicate; error bars show standard deviation. (E) The number of spheroids (> 1,000 μm2) from each well of 12-well plates was determined by counting at day 11. Error bars show standard deviation. P values are from two-tailed paired t tests. ns = not significant (P > 0.05), * = P ≤ 0.05, ** = P ≤ 0.01, **** = P ≤ 0.0001. (FK) RT-qPCR was performed on iPS87 cells grown as single cells, and iPS87 cells grown as spheroids either with or without TKI treatment. The following target genes were analyzed through mRNA expression: (F) FGFR1, (G) OCT4, (H) ALDH7A1, (I) E-cadherin, (J) vimentin, and (K) Snail. mRNA expression was normalized against beta-actin and the fold changes were evaluated. Data represent average of three independent experiments; error bars represent standard error of the means (mean ± SEM).

Similar articles

Cited by

References

    1. Bray F, Ferlay J, Soerjomataram I, Siegel RL, Torre LA, Jemal A. Global cancer statistics 2018: GLOBOCAN estimates of incidence and mortality worldwide for 36 cancers in 185 countries. CA Cancer J Clin. 2018; 68:394–424. 10.3322/caac.21492. - DOI - PubMed
    1. Smith MR, Saad F, Chowdhury S, Oudard S, Hadaschik BA, Graff JN, Olmos D, Mainwaring PN, Lee JY, Uemura H, Lopez-Gitlitz A, Trudel GC, Espina BM, et al.. Apalutamide Treatment and Metastasis-free Survival in Prostate Cancer. N Engl J Med. 2018; 378:1408–18. 10.1056/NEJMoa1715546. - DOI - PubMed
    1. Urbanucci A, Sahu B, Seppala J, Larjo A, Latonen LM, Waltering KK, Tammela TL, Vessella RL, Lahdesmaki H, Janne OA, Visakorpi T. Overexpression of androgen receptor enhances the binding of the receptor to the chromatin in prostate cancer. Oncogene. 2012; 31:2153–63. 10.1038/onc.2011.401. - DOI - PubMed
    1. Fennema E, Rivron N, Rouwkema J, van Blitterswijk C, de Boer J. Spheroid culture as a tool for creating 3D complex tissues. Trends Biotechnol. 2013; 31:108–15. 10.1016/j.tibtech.2012.12.003. - DOI - PubMed
    1. Kim JB. Three-dimensional tissue culture models in cancer biology. Semin Cancer Biol. 2005; 15:365–77. 10.1016/j.semcancer.2005.05.002. - DOI - PubMed