

Numerical simulation of the force of infection and the typical times of SARS-CoV-2 disease for different location countries
- PMID: 33457496
- PMCID: PMC7801231
- DOI: 10.1007/s40808-020-01075-3
Numerical simulation of the force of infection and the typical times of SARS-CoV-2 disease for different location countries
Abstract
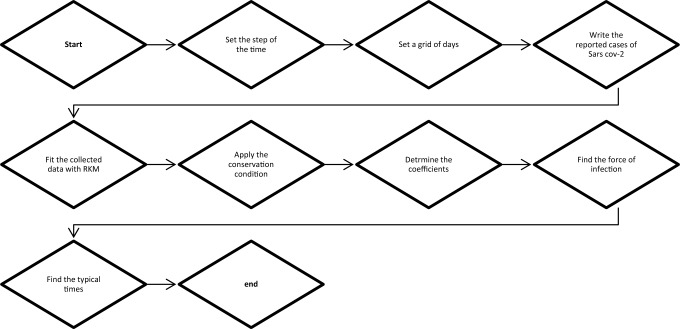
The new coronavirus disease appeared at the end of 2019 which is now a very big problem by spreading over the world and there are multiple parameters that can be discussed to be tools for the forecasting and the spreading of the pandemic such as the force of infection, the exponential base…etc. In this work, we estimate the force of infection and the specific times of the disease. For estimating the force of infection and the specific times, we use SEIR (susceptible cases of the disease, infectious cases of the disease, and recovered cases of the disease) epidemic model and the numerical analysis methods for simulating the values. We use the collected data of the new coronavirus pandemic reported up to 21 September, 2020 in different geographical location countries, which are, China, USA, Russia, the United Kingdom, Brazil, Spain, Bahrain, Egypt, India, Iran, Cyprus and the Syrian Arab Republic. We found that the force of infection and the specific times of SARS-CoV-2 disease are different for different location in countries. We find that there is no actual relation between the force of infection and the specific times of the pandemic of the new coronavirus disease with the weather and the geographical location of the countries.
Keywords: COVID-19; Models; Numerical simulation; Pandemic; SEIR model; The force of infection.
© The Author(s), under exclusive licence to Springer Nature Switzerland AG part of Springer Nature 2021.
Conflict of interest statement
Conflict of interestThe author confirmed that he does not have a conflict of interest.
Figures
References
-
- Al-Raeei M. Using Methods of Statistical Mechanics in the Study of Soft Condensed Matter Materials and Complex Structures. Damascus, Syrian Arab Republic: Damascus University publishing; 2018.
-
- Al-Raeei M. The basic reproduction number of the new coronavirus pandemic with mortality for India, the Syrian Arab Republic, the United States, Yemen, China, France, Nigeria and Russia with different rate of cases. Clin Epidemiol Global Health. 2020 doi: 10.1016/j.cegh.2020.08.005. - DOI - PMC - PubMed
-
- Al-Raeei M. The forecasting of COVID-19 with mortality using SIRD epidemic model for the United States, Russia, China and Syrian Arab Republic. AIP Adv. 2020;10:065325. doi: 10.1063/5.0014275. - DOI
LinkOut - more resources
Full Text Sources
Other Literature Sources
Miscellaneous