. 2021 Jan;2(1):92-109.
doi: 10.1158/2643-3230.BCD-20-0201. Epub 2020 Nov 24.

A Tumor Suppressor Enhancer of PTEN in T-cell development and leukemia

Affiliations

A Tumor Suppressor Enhancer of PTEN in T-cell development and leukemia

Luca Tottone et al. Blood Cancer Discov. 2021 Jan.

Abstract

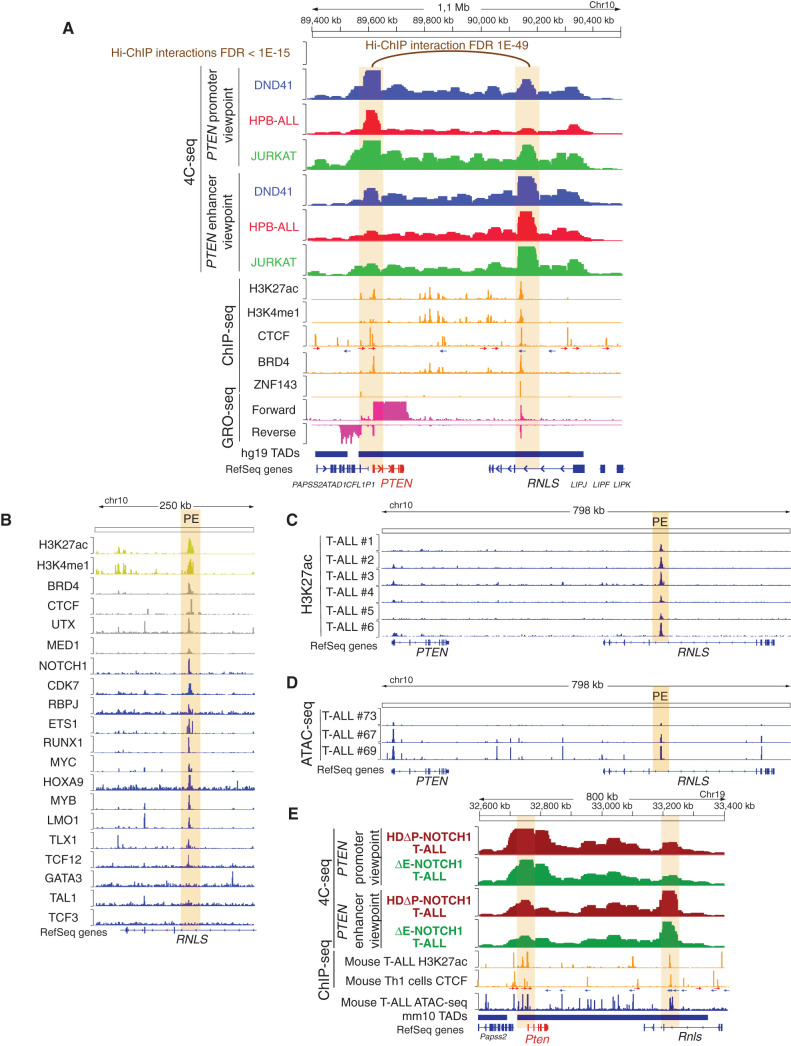
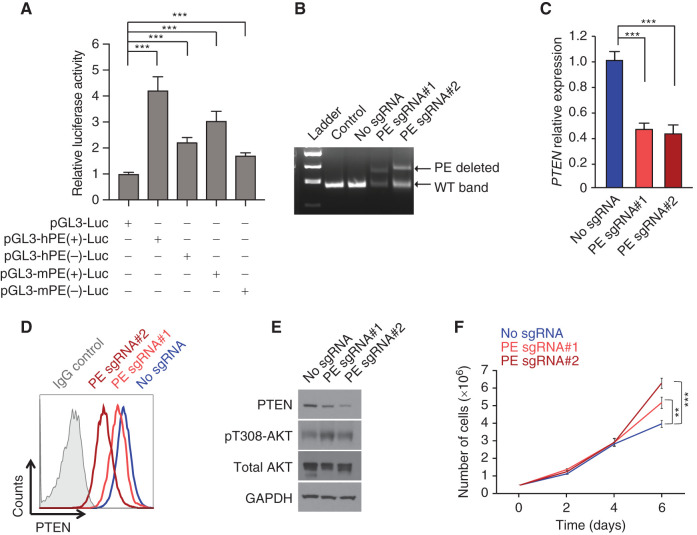
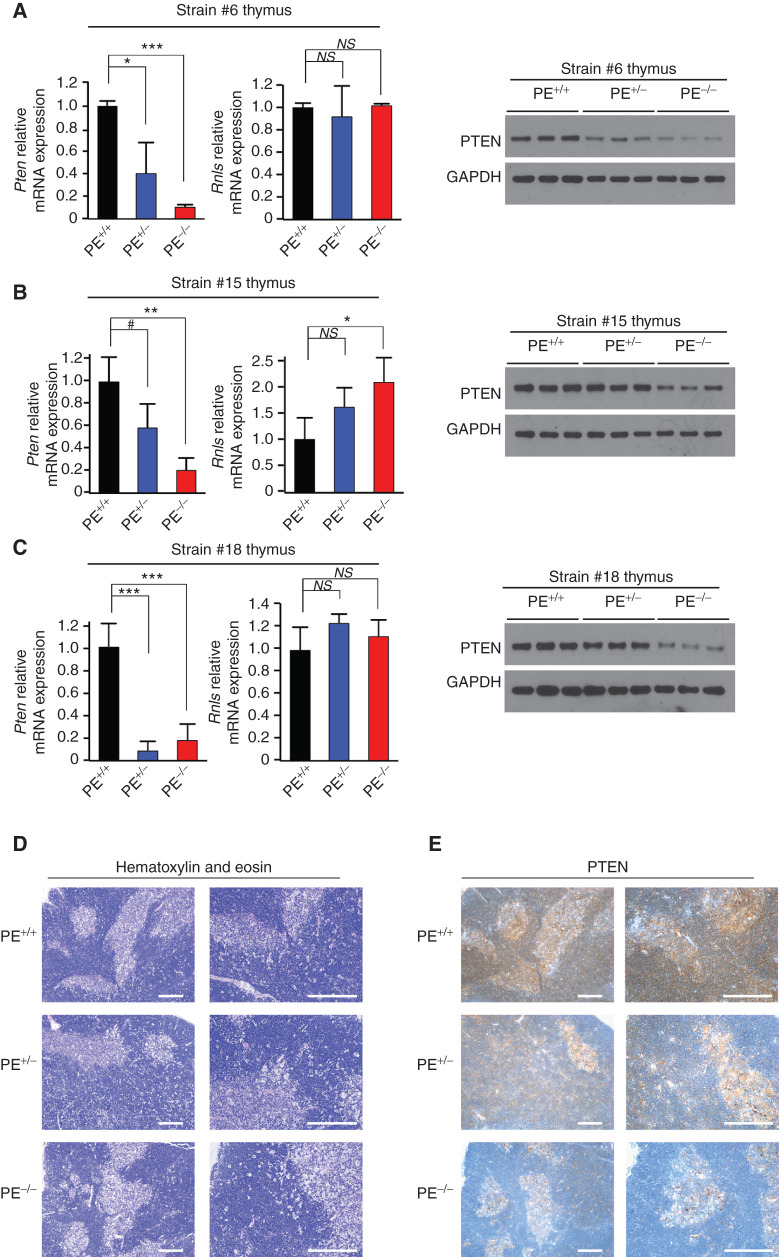
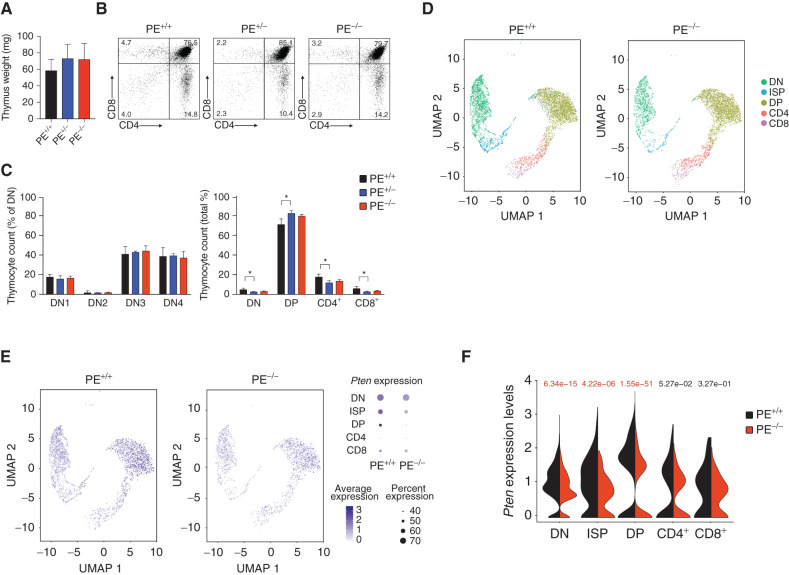
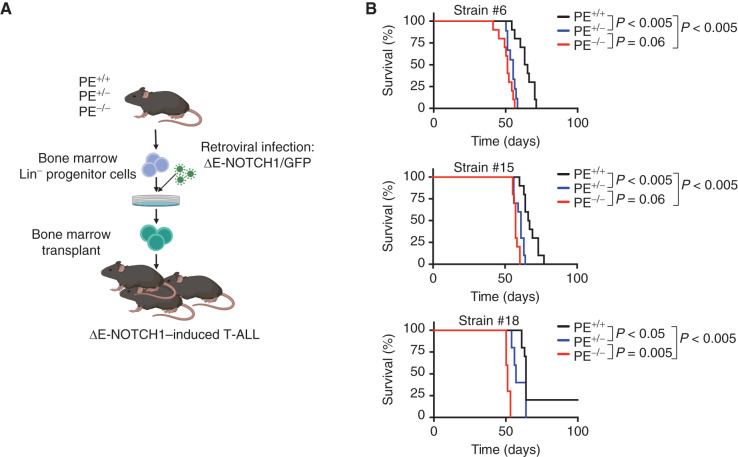
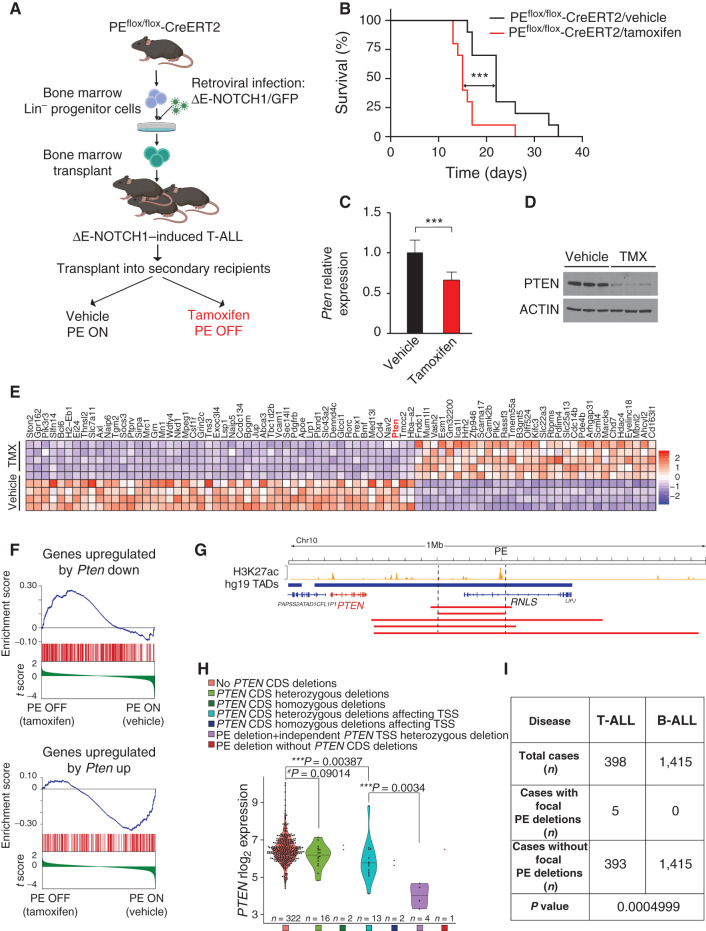
Long-range oncogenic enhancers play an important role in cancer. Yet, whether similar regulation of tumor suppressor genes is relevant remains unclear. Loss of expression of PTEN is associated with the pathogenesis of various cancers, including T-cell leukemia (T-ALL). Here, we identify a highly conserved distal enhancer (PE) that interacts with the PTEN promoter in multiple hematopoietic populations, including T-cells, and acts as a hub of relevant transcription factors in T-ALL. Consistently, loss of PE leads to reduced PTEN levels in T-ALL cells. Moreover, PE-null mice show reduced Pten levels in thymocytes and accelerated development of NOTCH1-induced T-ALL. Furthermore, secondary loss of PE in established leukemias leads to accelerated progression and a gene expression signature driven by Pten loss. Finally, we uncovered recurrent deletions encompassing PE in T-ALL, which are associated with decreased PTEN levels. Altogether, our results identify PE as the first long-range tumor suppressor enhancer directly implicated in cancer.

Keywords: NOTCH1; PTEN; T-ALL; T-cell acute lymphoblastic leukemia; enhancer.


Conflict of interest statement

Conflict of interest disclosure: The authors declare no competing financial interests.

Figures

Figure 1.
Figure 1.
Identification of PE, a PTEN enhancer in T-ALL. A, H3K27ac Hi-C chromatin immunoprecipitation (Hi-ChIP), 4C-seq, chromatin immunoprecipitation sequencing (ChIP-seq), GRO-seq, and Assay for Transposase-Accessible Chromatin using sequencing (ATAC-seq) tracks in human T-ALL cells. Top track shows H3K27ac Hi-ChIP interactions with the PTEN promoter in CUTLL1 T-ALL cells at FDR < 1E-15. Upper tracks show 4C-seq data in DND41 (blue), HPB-ALL (red), or JURKAT (green) T-ALL cells, using either the PTEN promoter or the PE enhancer as the viewpoints. 4C signal is merged across three independent replicates per condition. Middle tracks show ChIP-seq analyses in different T-ALL cell lines for the presence of epigenetic marks or enhancer-associated factors (orange). CTCF motifs are indicated by arrows (red arrow: forward core motif, blue arrow: reverse core motif). Lower tracks show GRO-seq data from CUTLL1 cells (pink). Bottom track shows the PTEN TAD (hg19). The PTEN promoter and the PE enhancer are highlighted by orange columns. B, Analysis of epigenetic marks (yellow), epigenetic factors (gray), and transcription factor (blue) PE occupancy by ChIP-seq in human T-ALL cells. PE enhancer is highlighted by an orange column. C, H3K27ac mark by ChIPmentation around the PE enhancer (highlighted in orange) in six independent human primary T-ALLs. D, ATAC-seq profile around the PE enhancer (highlighted in orange) in three independent human primary T-ALLs (GSE124223). E, 4C-seq, ChIP-seq, and ATAC-seq tracks in mouse T-ALL cells. Upper tracks show 4C-seq data from NOTCH1-induced mouse primary T-ALLs driven by either a NOTCH1-HDΔP construct (brown) or a NOTCH1-ΔE construct (green), using either the Pten promoter or the PE enhancer as the viewpoints. 4C signal is merged across three independent replicates per condition. Middle tracks show ChIP-seq (orange) of H3K27ac mark in mouse T-ALL cells and CTCF binding in mouse Th1 cells. CTCF motifs are indicated by arrows (red arrow: forward core motif, blue arrow: reverse core motif). Lower tracks show ATAC-seq data from a mouse primary T-ALL (blue), as well as the track showing the Pten TAD (mm10). The Pten promoter and the PE enhancer are highlighted by orange columns.
Figure 2.
Figure 2.
Functional characterization of the PE enhancer. A, Luciferase reporter activity in JURKAT T-ALL cells of a pGL3 promoter empty construct (pGL3-Luc), a pGL3 promoter plus the human PE enhancer in the forward [hPE(+)-Luc] or reverse [hPE(–)-Luc] orientation, or a pGL3 promoter plus the mouse PE enhancer in the forward [mPE(+)-Luc] or reverse [mPE(–)-Luc] orientation. Data from three independent electroporation replicates are shown. B, Genotyping of DND41 single-cell colonies harboring a heterozygous deletion for the PE enhancer. DND41 cells not electroporated (control) or electroporated with Cas9 but without single-guide RNAs, or sgRNAs (no sgRNA), are shown as controls. WT, wild-type. C–E, PTEN mRNA expression levels (C) and PTEN protein expression levels via intracellular FACS staining (D) or via Western blot analysis, together with AKT activation (E) in DND41 control cells or two independent DND41 single-cell colonies with PE heterozygous deletion. F, Proliferation curve of DND41 control cells or two independent DND41 single-cell colonies with PE heterozygous deletion. **, P < 0.01 and ***, P < 0.005 values calculated using two-tailed Student t test.
Figure 3.
Figure 3.
PE-deficient mice show reduced Pten levels in the thymus. A–C, Pten and/or Rnls mRNA and protein levels in thymi from PE+/+, PE+/−, and PE−/− mice (n = 3 per genotype) from strains #6 (A), #15 (B), and #18 (C). #, P < 0.1; *, P < 0.05; **, P < 0.01; and ***, P < 0.005 values calculated using two-tailed Student t test. NS, not significant. D and E, Hematoxylin and eosin (D) and PTEN (E) staining in thymi from PE+/+, PE+/−, and PE−/− mice (strain #6). Scale bars, 50 μm.
Figure 4.
Figure 4.
Effects of PE loss in thymic T-cell development. A, Thymus weight in 6-week-old WT (PE+/+), PE heterozygous knockout (PE+/−), and PE homozygous knockout (PE−/−) mice (n = 3 per genotype). B, Representative flow cytometry plots of thymocyte populations stained with antibodies to CD4 and CD8 in PE WT, PE heterozygous knockout, and PE homozygous knockout 6-week-old mice. Percentage populations are indicated in each quadrant. C, Quantification of intrathymic T-cell populations in PE WT, PE heterozygous knockout, and PE-null mice in relative numbers. Significance was calculated using two-tailed Student t test (*, P < 0.05; all other comparisons not significant). D, scRNA-seq analysis of a 1:1 mix of total thymocytes and CD4CD3 thymocytes from 6-week-old PE WT and PE homozygous knockout mice. UMAP embeddings show the cells annotated to each thymic population. E, UMAP embeddings as in D representing single-cell Pten expression. Dot plots (right) represent the expression of Pten. Size of the dots is proportional to the percentage of cells expressing Pten in each population; color of the dots represents Pten average expression. F, Violin plots represent the expression of Pten in the different thymic populations. Significance was calculated using the Wilcoxon rank-sum test (significant values shown in red).
Figure 5.
Figure 5.
PE loss leads to accelerated NOTCH1-induced T-ALL development. A, Schematic of retroviral-transduction protocol for the generation of NOTCH1-induced T-ALLs from PE+/+, PE+/−, and PE−/− mice. B, Kaplan–Meier curves of mice transplanted with ΔE-NOTCH1–infected PE+/+, PE+/−, and PE−/− hematopoietic progenitors (n = 10 per genotype). P values were calculated using the log-rank test.
Figure 6.
Figure 6.
Secondary loss of PE leads to accelerated NOTCH1-induced T-ALL progression and reduced levels of PTEN in mouse and human T-ALL.A, Schematic of retroviral-transduction protocol or the generation and analysis of PE conditional knockout NOTCH1–induced T-ALL. B, Kaplan–Meier curves of mice transplanted with PE conditional knockout ΔE-NOTCH1–induced T-ALL and treated in vivo with vehicle (control) or tamoxifen to induce isogenic deletion of PE. ***, P ≤ 0.005 values calculated using the log-rank test. C, Quantitative RT-PCR analysis of Pten expression in tumor cells isolated from PE conditional knockout leukemia–bearing mice treated with vehicle only (n = 7) or tamoxifen (n = 8) in vivo. Graph shows the mean values, and the error bars represent the SD. ***, P ≤ 0.005 was calculated using two-tailed Student t test. D, Western blot analysis of PTEN expression in tumor cells isolated from PE conditional knockout leukemia–bearing mice treated with vehicle only (n = 3) or tamoxifen (TMX; n = 3) in vivo. E, Heatmap representation of the top 81 differentially expressed genes between control- and tamoxifen-treated PE conditional knockout NOTCH1–induced leukemias. Cutoffs used: Wald statistic < −5 or > 5; P-adjusted value < 1E-04; sorted based on mean expression levels in tamoxifen-treated samples (for full list of significantly downregulated genes upon tamoxifen treatment, see Supplementary Fig. S12A). The scale bar shows color-coded differential expression, with red indicating higher levels of expression and blue indicating lower levels of expression. F, GSEA of genes regulated by PTEN in vehicle only–treated compared with tamoxifen-treated PE conditional knockout NOTCH1–induced leukemia cells in vivo. G, H3K27ac ChIP-seq mark in DND41 T-ALL cells along the PTEN-containing TAD and schematic representation of chromosome 10q23 focal deletions (red bars) found in human T-ALL. H, PTEN mRNA expression levels in human primary T-ALL samples (n = 360). Samples are subdivided according to the presence/absence of PTEN CDS deletions, the presence/absence of PTEN CDS deletions affecting its TSS, and the presence/absence of PE focal deletions. P value was calculated using t test. rlog, regularized log-transformed. I, PE focal deletions found specifically in T-ALL but not B-ALL. P value calculated using Fisher exact test.

References

    1. Belver L, Yang AY, Albero R, Herranz D, Brundu FG, Quinn SA, et al. GATA3-controlled nucleosome eviction drives MYC enhancer activity in T-cell development and leukemia. Cancer Discov 2019;9:1774–91. - PMC - PubMed
    1. Levine M, Cattoglio C, Tjian R. Looping back to leap forward: transcription enters a new era. Cell 2014;157:13–25. - PMC - PubMed
    1. Ong CT, Corces VG. Enhancer function: new insights into the regulation of tissue-specific gene expression. Nat Rev Genet 2011;12:283–93. - PMC - PubMed
    1. Shlyueva D, Stampfel G, Stark A. Transcriptional enhancers: from properties to genome-wide predictions. Nat Rev Genet 2014;15:272–86. - PubMed
    1. Sur I, Taipale J. The role of enhancers in cancer. Nat Rev Cancer 2016;16:483–93. - PubMed

Publication types