. 2020 Dec 31;2(1):100238.
doi: 10.1016/j.xpro.2020.100238. eCollection 2021 Mar 19.

Calcium imaging of adult-born neurons in freely moving mice

Affiliations

Calcium imaging of adult-born neurons in freely moving mice

Alvaro Carrier-Ruiz et al. STAR Protoc. .

Abstract

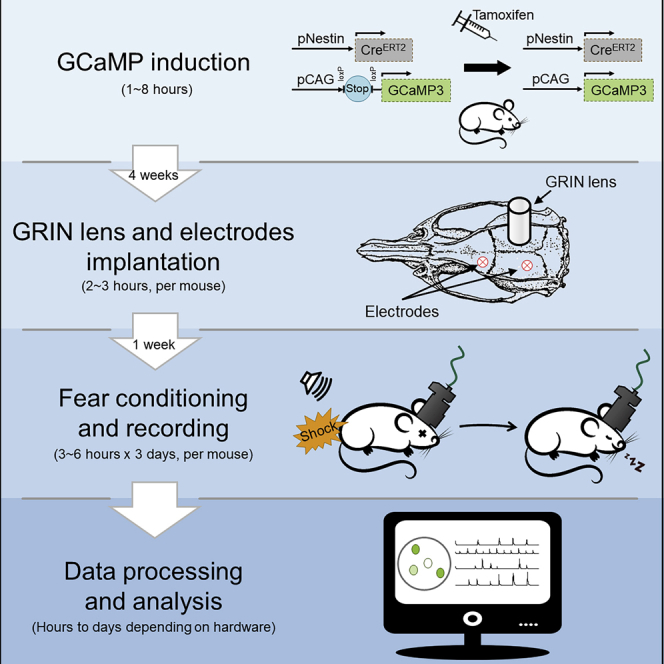
Adult-born neurons (ABNs) in the dentate gyrus bestow unique cellular plasticity to the mammalian brain. We recently found that the activity of ABNs during sleep is necessary for memory consolidation. Here, we describe our method for Ca2+ imaging of ABN activity using a miniaturized fluorescent microscope and sleep recordings. As preparatory surgery and post-recording data processing can be major obstacles, we provide detailed descriptions and problem-solving tips. For complete details on the use and execution of this protocol, please refer to Kumar et al. (2020).

Keywords: Microscopy; Model Organisms; Neuroscience.


Conflict of interest statement

The authors declare no competing interests.

Figures

None
Graphical abstract
Figure 1
Figure 1
Adult-born neurons (ABNs) expressing the calcium (Ca2+) sensor GCaMP3 Optical section of the dentate gyrus (DG) with confocal microscopy showing ABNs expressing the Ca2+ sensor GCaMP3 induced by tamoxifen injection. The letters g, h, and ml represent the granule cell layer, hilus, and molecular layer, respectively. The arrowhead indicates the subgranular zone, and the dotted line indicates the border between the DG and cornu ammonis 1 (CA1). Scale bar, 100 μm.
Figure 2
Figure 2
Positions of the four screws and hole for the gradient-index (GRIN) lens The blue arrow indicates the GRIN lens position. The green arrowhead indicates bregma.
Figure 3
Figure 3
White matter tracts with white striations exposed during aspiration of cortical tissue The area of white matter tracts is surrounded by the light blue dotted line. The cranial window (blue dotted line) is larger than the exposed area. Scale bar, 1 mm.
Figure 4
Figure 4
Setup for GRIN lens insertion A GRIN lens (blue arrow) is held by a clip holder (green arrow) and inserted into the hippocampus.
Figure 5
Figure 5
Electrodes and GRIN lens fixed with dental cement The skull and electroencephalogram (EEG)/electromyogram (EMG) wires are completely covered with black dental cement. Note that the EEG/EMG socket (green arrow) and GRIN lens (blue arrow) are not covered.
Figure 6
Figure 6
GRIN lens and the surrounding area covered with silicone The silicone is indicated by dotted line.
Figure 7
Figure 7
Fluorescent signals from the DG observed through the GRIN lens The DG is shown (A) without or (B) with ΔF/F processing. Red arrows indicate vasculature, and the blue arrowhead indicates a Ca2+ transient in an ABN. Scale bar, 100 μm.
Figure 8
Figure 8
Black baseplate secured above the GRIN lens using black dental cement (A) Top view. (B) Rear view. Note that the screw (blue arrows) and the surface of the baseplate are not covered by dental cement.
Figure 9
Figure 9
Dummy miniscope and dummy EEG/EMG cables attached to the mouse The dummy miniscope and the dummy EEG/EMG cables are indicated by a blue and a green arrow, respectively.
Figure 10
Figure 10
Histological confirmation of GRIN lens position and GCaMP3 signal The letters g, h, and ml indicate the granule cell layer, hilus, and molecular layer of the DG, respectively. The white line indicates the position of the lens, and the white dotted line indicates the border between the DG and stratum lacunosum moleculare. The expression of GCaMP3 is shown in green. Scale bar, 100 μm.
Figure 11
Figure 11
Analysis of Ca2+ imaging data Overlapping batch analysis. (A) Local correlation (CORR) and peak-to-noise ratio (PNR) image of three neurons in a recording file. (B) Ca2+ transients detected and CORR for three neurons in three consecutive batches. Black trace shows the final estimated signal for the entire recording. (C) Normalized CORR for a 3-h video obtained by analyzing the entire video sequence versus the maximum projection of the CORR images obtained by overlapping batch implementation. Note that CORR of the entire video sequence includes many highly correlated non-circular shapes that are unlikely to represent real ABNs. Analysis of the entire video will introduce several false positives and noisier estimation of Ca2+ transients in this case. (D) Spatial and temporal features of Ca2+ transients extracted by conventional CNMF-E (CC) and overlapping batches (OB) methods. The two transients were randomly chosen from those extracted by CC or OB methods. (E) Circularities (isoperimetric quotient) of spatial components and PNR of temporal traces. (F) Example of spatial components extracted from an individual batch (i), the OB method (ii), or the CC method (ii) in the same time period. Because there are more neurons in the entire recording period than in an individual batch, spatial components were weighted by average activity during the period. (G) Left: Cosine similarity of spatial components for the individual batch versus CC method and individual batch versus OB method. The star symbol in the figure corresponds to the spatial components shown in (F). Right: Temporal correlation of Ca2+ transients of common neurons for the individual batch versus CC method and individual batch versus OB method. A neuron extracted by the CC or OB method was considered to be the same as that in an individual batch if its spatial component had a cosine similarity >0.8. If more than two pairs of neurons satisfied this condition, the pair with the higher temporal correlation was used for calculations. (H) Left: percentage of active neurons not detected in an individual batch. Right: PNR of missed neurons. Data were analyzed by Mann-Whitney tests (E, G) and one-sample t tests (H).

References

    1. Boyce R., Glasgow S.D., Williams S., Adamantidis A. Causal evidence for the role of REM sleep theta rhythm in contextual memory consolidation. Science. 2016;352:812–816. - PubMed
    1. Combrisson E., Vallat R., Eichenlaub J.B., O'Reilly C., Lajnef T., Guillot A., Ruby P.M., Jerbi K. Sleep: an open-source python software for visualization, analysis, and staging of sleep data. Front. Neuroinform. 2017;11:60. - PMC - PubMed
    1. Danielson N.B.B., Kaifosh P., Zaremba J.D.D., Lovett-Barron M., Tsai J., Denny C.A.A., Balough E.M.M., Goldberg A.R.R., Drew L.J.J., Hen R. Distinct contribution of adult-born hippocampal granule cells to context encoding. Neuron. 2016;90:101–112. - PMC - PubMed
    1. Ghandour K., Ohkawa N., Fung C.C.A.C.A., Asai H., Saitoh Y., Takekawa T., Okubo-Suzuki R., Soya S., Nishizono H., Matsuo M. Orchestrated ensemble activities constitute a hippocampal memory engram. Nat. Commun. 2019;10:2637. - PMC - PubMed
    1. Ghosh K.K., Burns L.D., Cocker E.D., Nimmerjahn A., Ziv Y., Gamal A.E., Schnitzer M.J. Miniaturized integration of a fluorescence microscope. Nat. Methods. 2011;8:871–878. - PMC - PubMed

Publication types

LinkOut - more resources