. 2021 Jan 1;13(1):1866974.
doi: 10.1080/19490976.2020.1866974.

Role of gut microbiota in regulating gastrointestinal dysfunction and motor symptoms in a mouse model of Parkinson's disease

Affiliations

Role of gut microbiota in regulating gastrointestinal dysfunction and motor symptoms in a mouse model of Parkinson's disease

Yogesh Bhattarai et al. Gut Microbes. .

Abstract

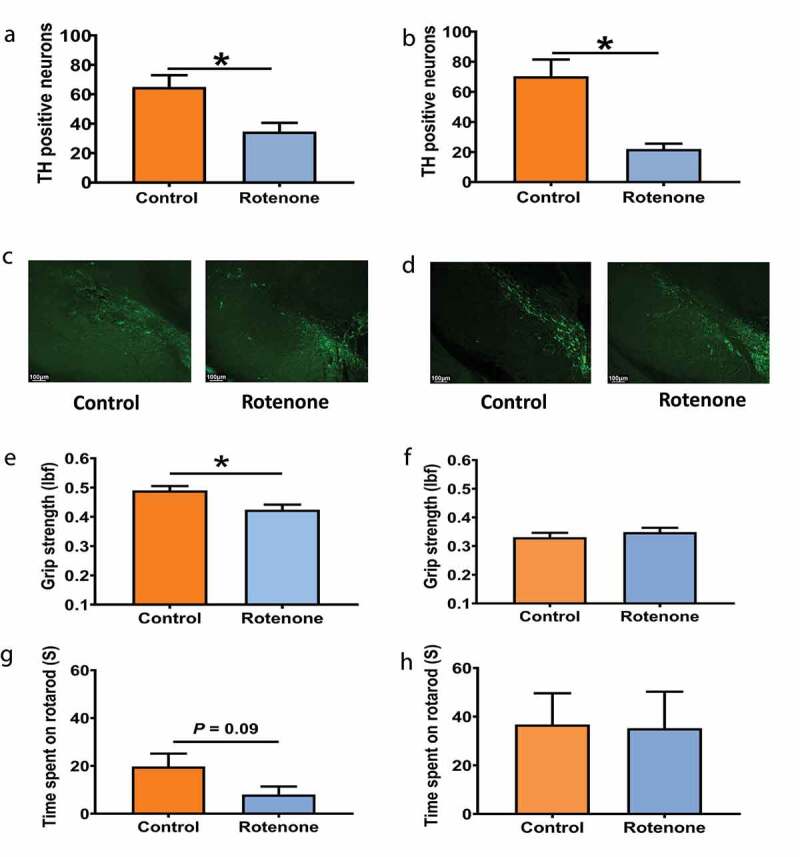
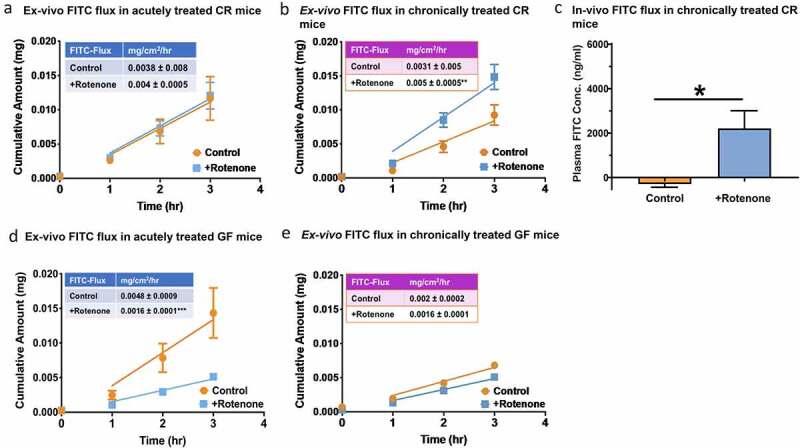
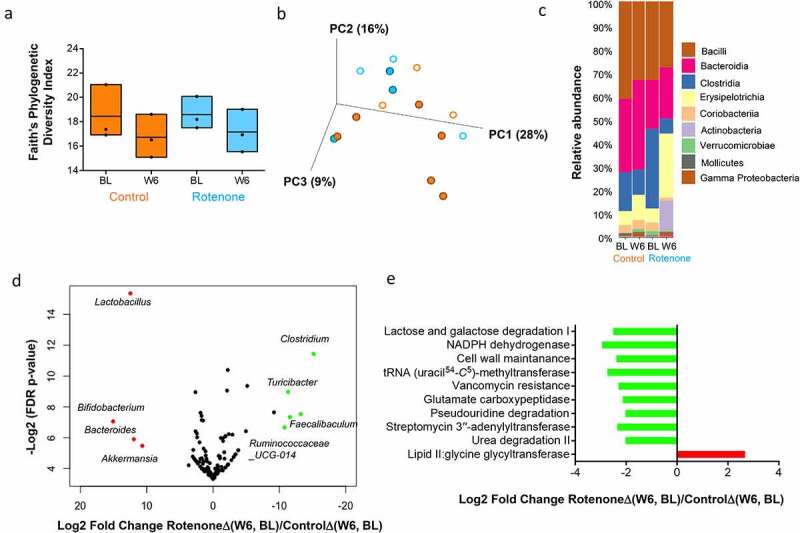
Parkinson's disease (PD) is a common neurodegenerative disorder characterized primarily by motor and non-motor gastrointestinal (GI) deficits. GI symptoms' including compromised intestinal barrier function often accompanies altered gut microbiota composition and motor deficits in PD. Therefore, in this study, we set to investigate the role of gut microbiota and epithelial barrier dysfunction on motor symptom generation using a rotenone-induced mouse model of PD. We found that while six weeks of 10 mg/kg of chronic rotenone administration by oral gavage resulted in loss of tyrosine hydroxylase (TH) neurons in both germ-free (GF) and conventionally raised (CR) mice, the decrease in motor strength and coordination was observed only in CR mice. Chronic rotenone treatment did not disrupt intestinal permeability in GF mice but resulted in a significant change in gut microbiota composition and an increase in intestinal permeability in CR mice. These results highlight the potential role of gut microbiota in regulating barrier dysfunction and motor deficits in PD.

Keywords: Microbiota-gut-brain axis, intestinal epithelial barrier, idiopathic Parkinson's disease, gnotobiotic mice, Braak hypothesis.


Figures

Figure 1.
Figure 1.
Chronic rotenone administration causes motor dysfunction in CR mice but not in GF mice. Change in TH-neuron number in substantia nigra following treatment with rotenone (10mg/kg) or vehicle with representative images in CR (A, C) and GF mice (B, D). Changes in grip strength and time spent in rotarod in CR mice (E, G) and GF mice (F, H) respectively following treatment with rotenone (10mg/kg) or vehicle. The data are presented as mean ± SEM [unpaired Student's t-test (two-tailed); *P <0.05]
Figure 2.
Figure 2.
Chronic rotenone administration disrupts epithelial permeability and alters gut microbiota composition in CR mice. The cumulative fluorescein isothiocyanate (FITC) flux across the ex-vivo colonic mucosal explants obtained from (A) acutely rotenone and vehicle treated CR mice and (B) chronically rotenone and vehicle treated CR mice. (C) In-vivo FITC flux in CR mice subjected to chronic rotenone and vehicle treatment. Ex-vivo FITC flux across colonic mucosal explants in (D) acutely rotenone and vehicle treated GF mice and (E) chronically rotenone and vehicle treated GF mice. The data is presented as mean ± SEM. Difference between the slopes are calculated by F-test; in chronically treated CR: DFn = 1, DFd = 20; **P<0.01 and in acutely treated GF: DFn = 1, DFd = 28; **P<0.01. Plasma absorption of orally administered FITC in chronically vehicle control versus rotenone treated CR mice [Student’s t-test (two-tailed); *P <0.05]
Figure 3.
Figure 3.
Changes in gut microbiota composition following rotenone or vehicle treatment in CR mice. (a) Change in α-diversity from baseline (BL) to week 6 (W6) following rotenone (blue) or vehicle (orange) treatment in conventionally raised (CR) mice was assessed using Faith’s phylogenetic diversity index. Kruskal–Wallis (pairwise) test, vehicle control: BL vs W6, q = 0.6; rotenone: BL vs W6, q = 0.6; BL: rotenone vs vehicle control, q = 0.7; W6: rotenone vs vehicle control, q = 0.7. A comparison of the change in α-diversity from BL to W6 following rotenone [RotenoneΔ(W6, BL)] or vehicle treatment [ControlΔ(W6, BL] shows no statistically significant difference (Wilcoxon Sign-Rank Test) between the treatment groups. (b) Bray Curtis-based PCoA plot (2-dimensional representation of 3-dimensional plot) of gut microbial communities in CR mice treated with vehicle solution (orange; control group) or rotenone solution (blue). BL samples are represented by open circles while W6 samples are represented by filled circles. There was no statistically significant difference in beta diversity at BL (PERMANOVA test; q = 0.26) or W6 (PERMANOVA test; q = 0.23) between rotenone and vehicle-treated mice. A comparison of the change in beta diversity from BL to W6 following rotenone [RotenoneΔ(W6, BL)] or vehicle treatment [ControlΔ(W6, BL] shows no statistically significant difference (Wilcoxon Sign-Rank Test) between the treatment groups. (c) Bar plot showing changes in relative abundance of different bacterial classes from BL to W6 following treatment of CR mice with rotenone (blue) or vehicle (orange). (d) Volcano plot showing compositional difference in gut microbiota between vehicle (control) and rotenone treated CR mice. Log2-transformed fold change in microbiota composition (RotenoneΔ(W6, BL)/ControlΔ(W6, BL)) is plotted on the x-axis and log-transformed, FDR adjusted p-values are plotted on the y-axis. Bacterial genera that are significantly increased [FDR adjusted P < .05] following rotenone administration are represented in red while those that are significantly decreased are represented in green. (e) Comparison of the change in predicted microbial metabolic pathways (PICRUSt) FDR<0.25) from BL to W6 following vehicle and rotenone treatment in CR mice [RotenoneΔ(W6, BL)/ControlΔ(W6, BL)]. Pathways (FDR<0.25) that are significantly increased are shown in red while those that are significantly decreased following rotenone administration are shown in green

Similar articles

Cited by

References

    1. DeMaagd G, Philip A.. Parkinson’s disease and its management: part 1: disease entity, risk factors, pathophysiology, clinical presentation, and diagnosis. P T. 2015;40:504–9. - PMC - PubMed
    1. Marras C, Beck JC, Bower JH, Roberts E, Ritz B, Ross GW, Abbott RD, Savica R, Van Den Eeden SK, Willis AW, et al. Prevalence of Parkinson’s disease across North America. NPJ Parkinsons Dis. 2018;4(1):21. doi:10.1038/s41531-018-0058-0. - DOI - PMC - PubMed
    1. Power JH, Barnes OL, Chegini F. Lewy bodies and the mechanisms of neuronal cell death in Parkinson’s disease and dementia with lewy bodies. Brain Pathol. 2017;27(1):3–12. doi:10.1111/bpa.12344. - DOI - PMC - PubMed
    1. Bereczki D. The description of all four cardinal signs of Parkinson’s disease in a Hungarian medical text published in 1690. Parkinsonism Relat Disord. 2010;16(4):290–293. doi:10.1016/j.parkreldis.2009.11.006. - DOI - PubMed
    1. Wu SL, Liscic RM, Kim S, Sorbi S, Yang YH. Nonmotor symptoms of Parkinson’s disease. Parkinsons Dis. 2017;2017:4382518. - PMC - PubMed

Publication types

Supplementary concepts

LinkOut - more resources