. 2021 Nov;17(11):3408-3423.
doi: 10.1080/15548627.2021.1874134. Epub 2021 Jan 18.

Lipophagy confers a key metabolic advantage that ensures protective CD8A T-cell responses against HIV-1

Affiliations

Lipophagy confers a key metabolic advantage that ensures protective CD8A T-cell responses against HIV-1

Hamza Loucif et al. Autophagy. 2021 Nov.

Abstract

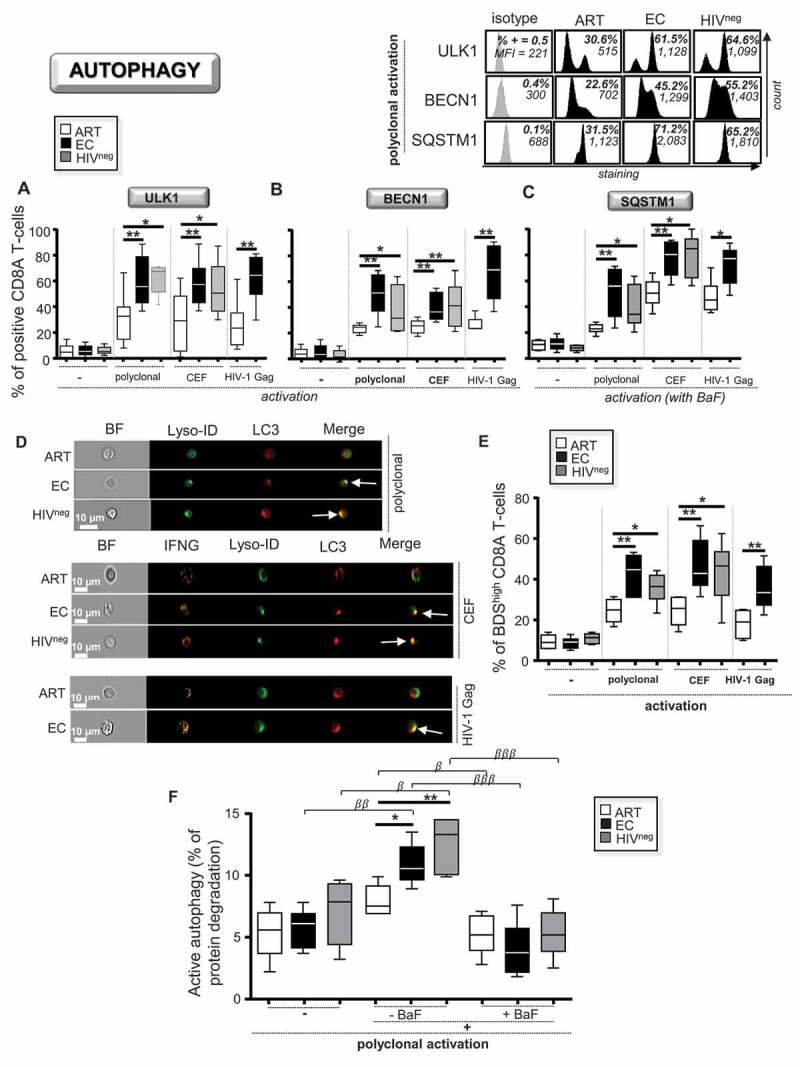
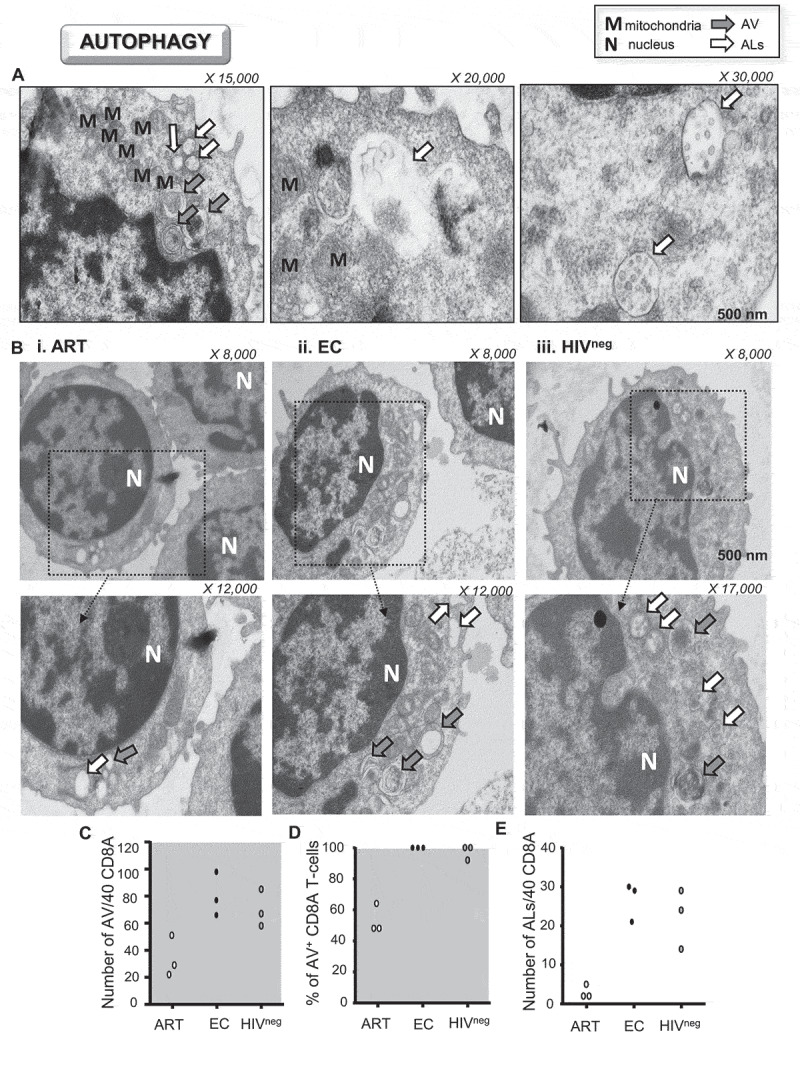
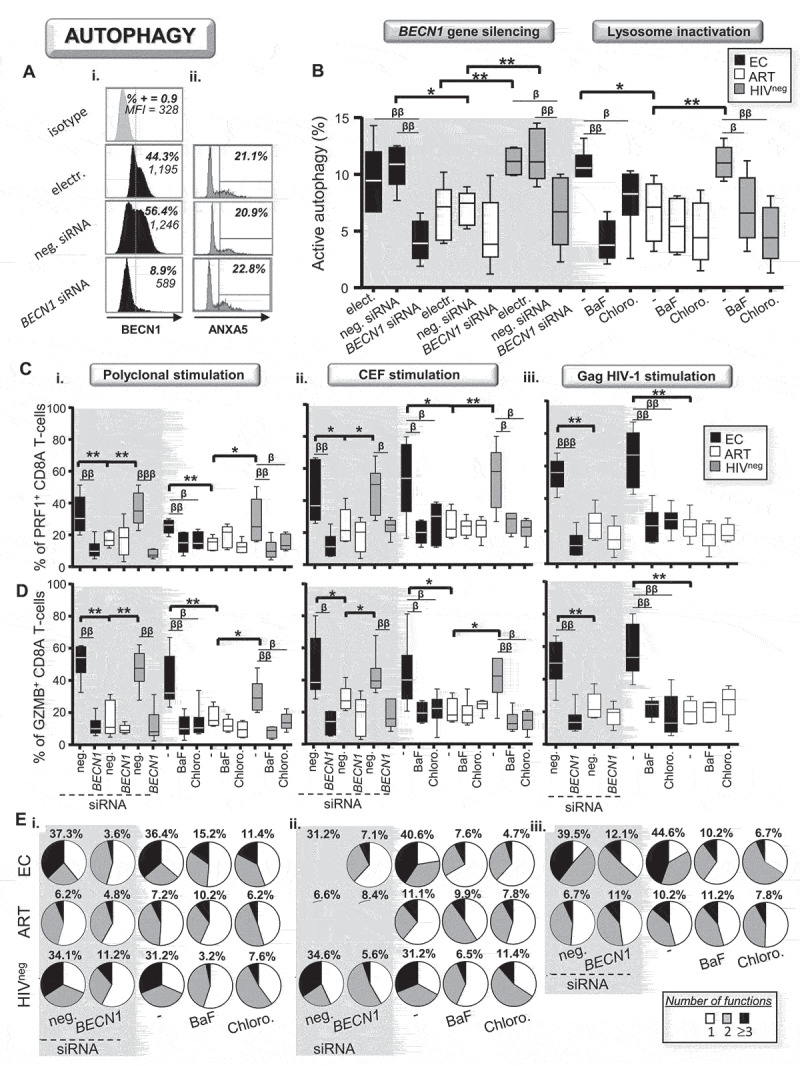
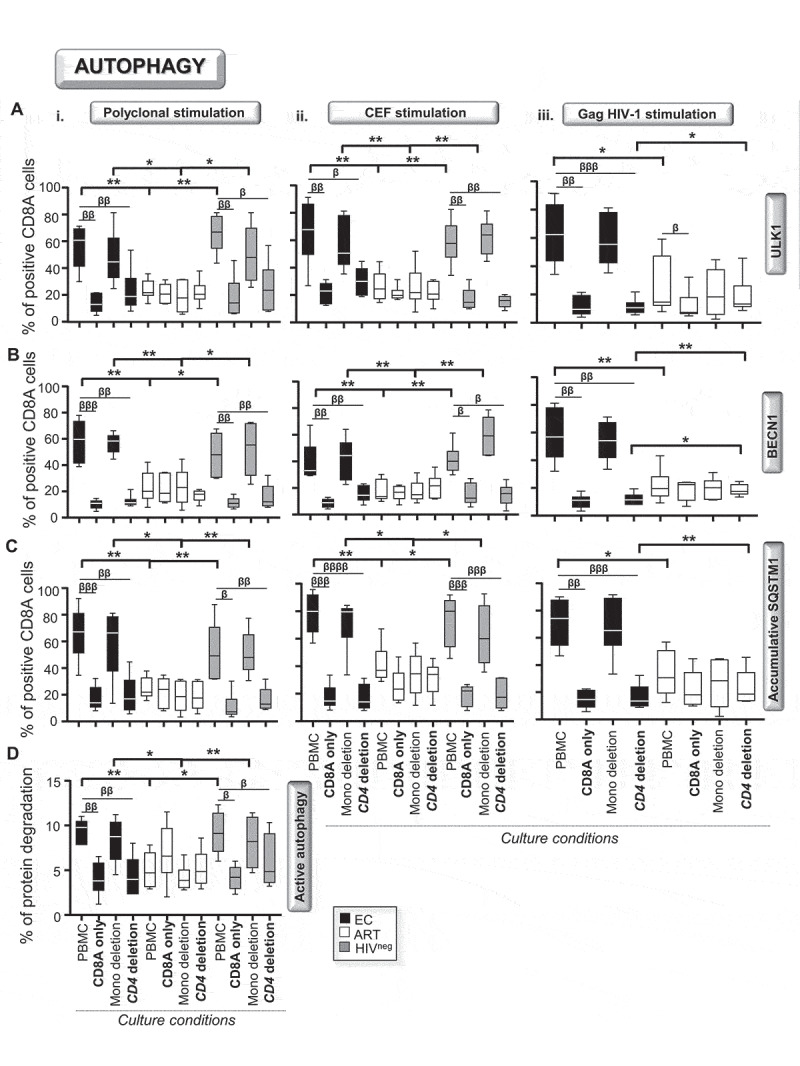
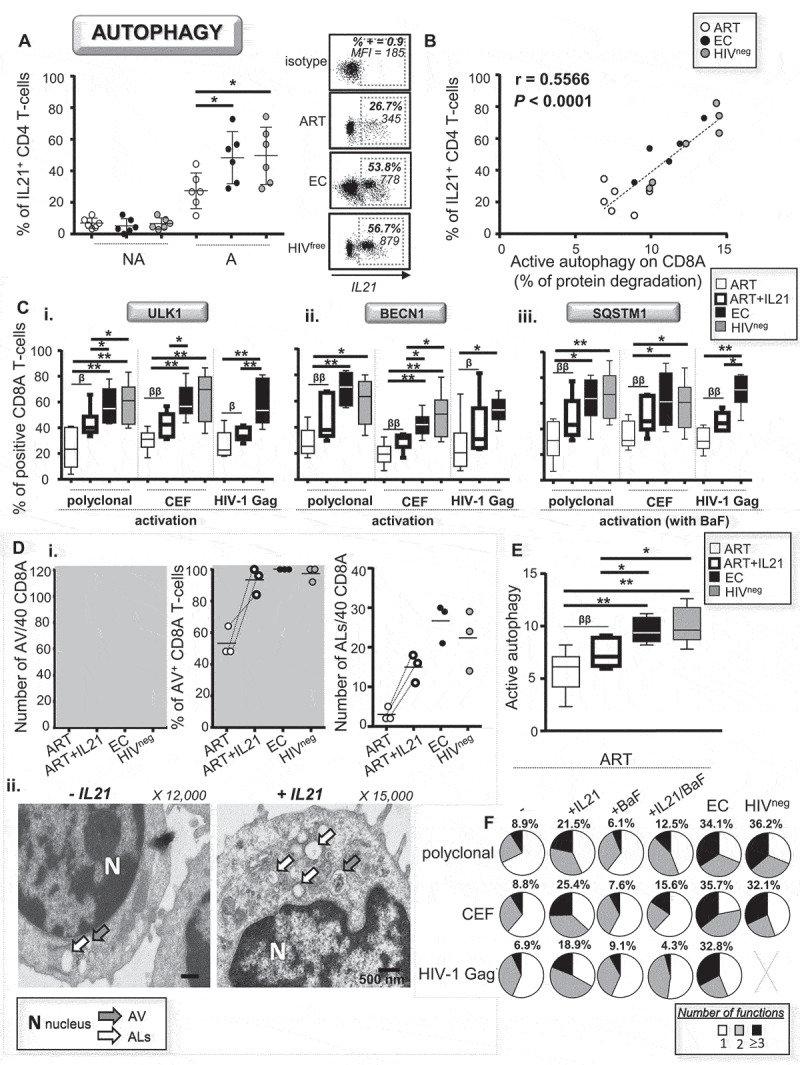
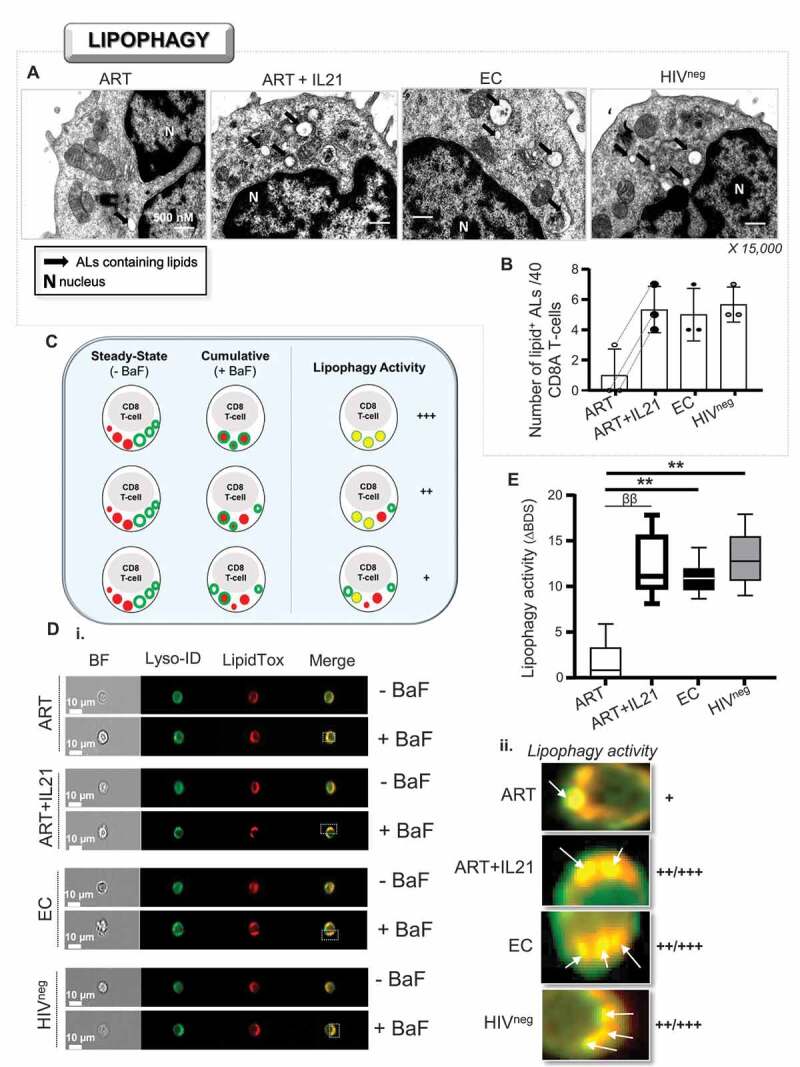
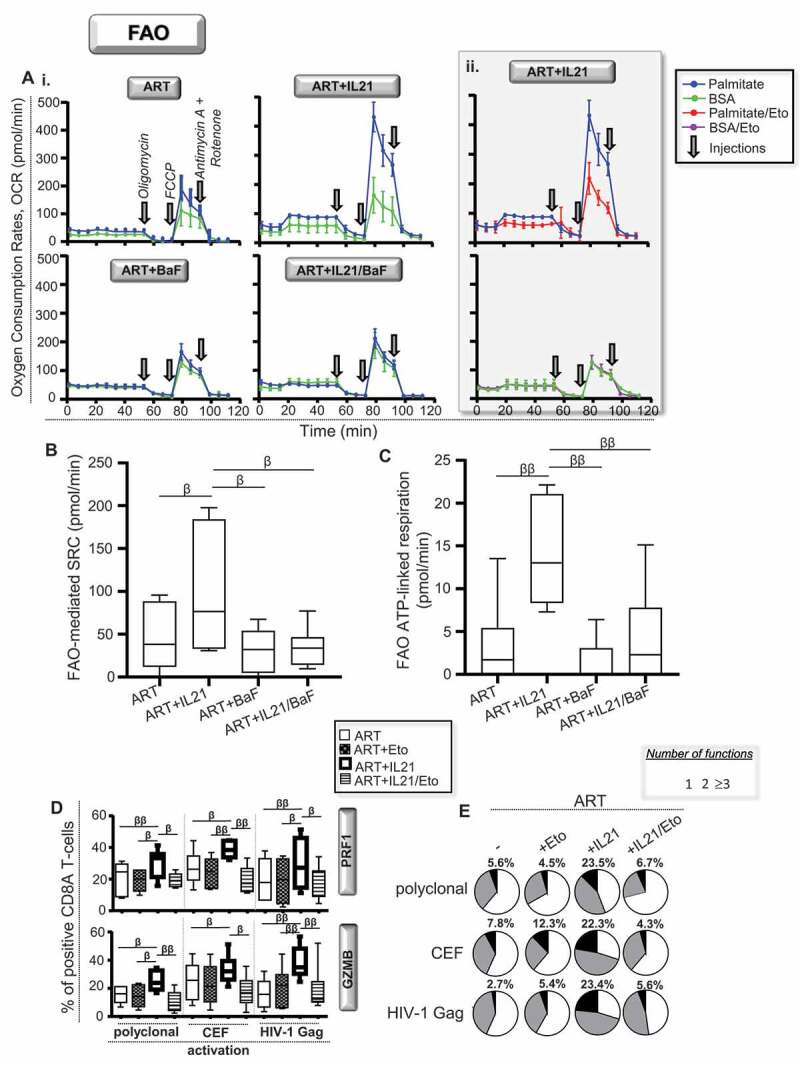
Although macroautophagy/autophagy has been proposed as a critical defense mechanism against HIV-1 by targeting viral components for degradation, its contribution as a catabolic process in providing optimal anti-HIV-1 immunity has never been addressed. The failure to restore proper antiviral CD8A/CD8 T-cell immunity, especially against HIV-1, is still the major limitation of current antiretroviral therapies. Consequently, it is of clinical imperative to provide new strategies to enhance the function of HIV-1-specific CD8A T-cells in patients under antiretroviral treatments (ART). Here, we investigated whether targeting autophagy activity could be an optional solution to make this possible. Our data show that, after both polyclonal and HIV-1-specific activation, CD8A T-cells from ART displayed reduced autophagy-dependent degradation of lysosomal contents when compared to naturally HIV-1 protected elite controllers (EC). We further confirmed in EC, by using specific BECN1 gene silencing and lysosomal inhibitors, the critical role of active autophagy in superior CD8A T-cell protection against HIV-1. More importantly, we found that an IL21 treatment was effective in rescuing the antiviral CD8A T-cell immunity from ART in an autophagy-dependent manner. Finally, we established that IL21-dependent rescue occurred due to the enhanced degradation of endogenous lipids via autophagy, referred to as lipophagy, which fueled the cellular rates of mitochondrial beta-oxidation. In summary, our data show that autophagy/lipophagy can be considered as a therapeutic tool to elicit functional antiviral CD8 T-cell responses. Our results also provide additional insights toward the development of improved T-cell-based prevention and cure strategies against HIV-1.Abbreviations: ART: patients under antiretroviral therapy; BaF: bafilomycin A1; BECN1: beclin 1; CEF: cytomegalo-, Epstein-Barr- and flu-virus peptide pool; Chloro.: chloroquine; EC: elite controllers; FAO: fatty acid beta-oxidation; HIVneg: HIV-1-uninfected control donors; IFNG/IFN-γ: interferon gamma; IL21: interleukin 21; MAP1LC3/LC3: microtubule associated protein 1 light chain 3; PBMC: peripheral blood mononuclear cells; SQSTM1: sequestosome 1; ULK1: unc-51 like autophagy activating kinase 1.

Keywords: Antiretroviral therapy; FAO; HIV-1; IL21; elite controllers; lipophagy; polyfunctionality.


Conflict of interest statement

No potential conflicts of interest were disclosed.

Figures

Figure 1.
Figure 1.
Reduced autophagic activity in ART after CD8A T-cell activation. (A-E) CD8A T-cells from ART, EC and HIVneg were either polyclonally or antigen-specifically (CEF peptides or Gag antigens) activated and cultured without activation for 6 h (n = 6). Of note, antigen-specific CD8A T-cells were identified at 6 h post-activation by positive staining for IFNG. The percentages of positive cells were then determined in CD8A T-cells for the autophagy-related players (A) ULK1 and (B) BECN1. (C) We also assessed the percentages of SQSTM1+ CD8A T-cells when lysosomal activity was blocked by BaF during the culture. Representative histograms including isotype controls after 6 h of post-polyclonal activation are also shown above. (D and E) Lysosomal content of LC3 determined by Imaging flow cytometry. (D) Representative images of single CD3W+ CD8A+ (polyclonal activation) and CD3W+ CD8A+ IFNG+ T-cells (CEF and HIV-1 activations) merged for fluorescent signals from LC3 and Lyso-ID. BF, bright field. (E) Percentages of BDShigh LC3+ Lyso-ID+ CD8A T-cells in ART, EC and HIVneg. The colocalization index BDS stands for bright detail similarity. (F) Autophagy-dependent proteolytic degradation of long-lived proteins determined in purified CD8A T-cells after polyclonal activation in the presence or absence of BaF, by using a pulse-chase approach. β, symbol used for paired t test (comparison between treated CD8A T-cells and their untreated control). *, symbol used for Mann-Whitney test (comparison between study groups). One symbol, 0.05 > P> 0.01; two symbols, 0.01 > P> 0.001; and three symbols, 0.001 > P> 0.0001
Figure 2.
Figure 2.
Lower amounts of ALs in activated CD8A T-cells from ART. (A-E) Ultrastructural analysis of purified CD8A T-cells from ART, EC and HIVneg after 6 h of polyclonal activation (n = 3). (A) Representative ultrastructural micrographs from uninfected controls to differentiate AV (autophagic vacuoles; gray arrows) from ALs (autolysosomes; white arrows). (B) Ultrastructural micrographs in i. ART, ii. EC and iii. HIVneg including strategic magnifications to appreciate the numbers of cellular vacuoles (X 8,000–17,000). Quantitative analysis of (C) the number and (D) percentages of positive CD8A T-cells for AV per 40 cells. (E) Number of ALs per 40 CD8A T-cells
Figure 3.
Figure 3.
Active autophagy plays a key role in antiviral CD8A immunity during HIV-1 infection. (A-E) Active autophagy and effector function were both determined in activated CD8A T-cells under specific BECN1 gene silencing or lysosomal inactivation with Baf or Chloro (n = 6). (A) Representative histograms of i. BECN1 expression and ii. ANXA5 staining in transfected CD8A T-cells from EC at 6 h post-polyclonal activation. (B) Autophagy-dependent proteolytic degradation of long-lived proteins assessed in polyclonally activated CD8A T-cells when active autophagy was inhibited or not. Percentages of (C) PRF1+ and (D) GZMB+ CD8A T-cells in the context of autophagy blockade. Results were shown in the context of i. polyclonal, ii. CEF-specific and iii. HIV-1-specific activation. (E) Pie chart representations of CD8A T-cell polyfunctionality that were determined after i. polyclonal and ii and iii. antigen-specific activations with or without autophagy blockade. Percentages of highly functional CD8A T-cells (expressing three or more antiviral cytokines and cytotoxic molecules in addition to IFNG) were also indicated in bold for all study groups and conditions. β, symbol used for paired t test (comparison between treated CD8A T-cells and their untreated control). *, symbol used for Mann-Whitney test (comparison between study groups). One symbol, 0.05 > P> 0.01; two symbols, 0.01 > P> 0.001; and three symbols, 0.001 > P> 0.0001
Figure 4.
Figure 4.
CD4 T-cell help is required to ensure high autophagic activity in EC. We first activated total PBMC, purified CD8A T-cells and PBMC whose CD4 T-cells or monocytes have been depleted either i. polyclonally, ii. CEF- or iii. HIV-1 Gag-specifically for 6 h (n = 6). Then, we assessed the percentages of (A) ULK1+, (B) BECN1+ and (C) SQSTM1+ (with BaF) in CD8A T-cells for all conditions by flow cytometry. (D) We also determined at 6 h post-polyclonal activation on purified CD8A T-cells the autophagy-dependent proteolytic degradation of long-lived proteins using the pulse-chase approach. β, symbol used for paired t test (comparison between treated CD8A T-cells and their untreated control). *, symbol used for Mann-Whitney test (comparison between study groups). One symbol, 0.05 > P> 0.01; two symbols, 0.01 > P> 0.001; and three symbols, 0.001 > P> 0.0001
Figure 5.
Figure 5.
Rescue of antiviral CD8A immunity in ART by IL21 is driven by enhanced active autophagy. (A) Percentages of IL21-producing CD4 helpers from all study groups were determined after 6 h of polyclonal activation by flow cytometry. Representative dot plots are also shown including isotype control. (B) Correlation between the percentages of IL21-producing CD4 helpers and levels of active autophagy in activated CD8A T-cells for all participants. (C-F) 10 ng/mL recombinant IL21 was added in cultures form ART when their CD8A T-cells were activated either polyclonally or antigen-specifically. (C) Percentages of i. ULK1+, ii. BECN1+ and iii. SQSTM1+ CD8A T-cells were then assessed by flow cytometry. (D) Ultrastructural analysis of purified CD8A T-cells following polyclonal activation including cells from ART that have been stimulated with or without IL21. i. Number and percentage of positivity for AV and ALs per 40 CD8A T-cells. ii. Representative micrographs with and without IL21. (E) Autophagy-dependent proteolytic degradation of long-lived protein determined in purified CD8A T-cells form ART with or without IL21. (F) CD8A T-cell polyfunctionality was assessed in activated CD8A T-cells from ART (with or without IL21 and BaF treatments), EC and HIVneg. Percentages of highly functional CD8A T-cells (expressing three or more antiviral cytokines and cytotoxic molecules in addition to IFNG) were also indicated in bold. n = 6, except for (B) n = 18 and (D) n = 3. β, symbol used for paired t test (comparison between treated CD8A T-cells and their untreated control). *, symbol used for Mann-Whitney test (comparison between study groups). One symbol, 0.05 > P> 0.01; two symbols, 0.01 > P> 0.001; and three symbols, 0.001 > P> 0.0001
Figure 6.
Figure 6.
Enhanced lipophagy in ART in response to IL21 treatment. (A and B) Visualization of ALs containing endogenous lipids using osmium tetroxide negative-staining in activated CD8A T-cells (n = 3). (A) Magnified images showing ALs containing lipids (black arrows) for all study groups including ART that have been treated or not with IL21 (15,000 X). (B) Quantitative analysis of the number of ALs containing lipids per 40 cells. (C-E) Assessment of lipophagy activity by using a novel ImageStream-based lipophagy assay (n = 6). (C) Schematic representation for assessing lipophagy activity. (D) i. Representative images of single Lyso-ID+LipidTox+ CD8A T-cells for all groups after 6 h of polyclonal activation in the presence or absence of BaF (“cumulative” and “steady-state” conditions, respectively). BF, bright field. ii. Magnified images showing increased lysosomal content of endogenous lipids in BaF-treated cells, which is an indicator of lipophagy activity when compared to cells without BaF. (E) Quantification of lipophagy activity determined in Lyso-ID+LipidTox+ CD8A T-cells in ART (with or without IL-21), EC and HIVneg. Lipophagy activity was determined by the formula: ΔBDS = (% of BDShigh cells with BaF) – (% of BDShigh cells without BaF). β, symbol used for paired t test (comparison between treated CD8A T-cells and their untreated control). *, symbol used for Mann-Whitney test (comparison between study groups). One symbol, 0.05 > P> 0.01; two symbols, 0.01 > P> 0.001; and three symbols, 0.001 > P> 0.0001
Figure 7.
Figure 7.
Lipophagy-induced IL21 in ART improves the cellular rates of mitochondrial beta-oxidation. (A-C) FAO determined in purified CD8A T-cells from ART at 6 h of polyclonal activation with or without IL21 and BaF (n = 6). (A) Representative graphs showing real-time oxygen consumption rates (OCR) in response to injections of mitochondrial respiration modulators, which are Oligomycin, Carbonyl cyanide 4-(trifluoromethoxy)-phenylhydrazone (FCCP) and Rotenone and Antimycin A, respectively in i. cells that have been incubated for the last 45 min with palmitate (blue kinetic) or BSA (green kinetic) and in ii. IL21-treated cells that have also been treated with the FAO inhibitor etomoxir (red and purple kinetics). Assessment of (B) FAO-mediated respiration and (C) related ATP-linked respiration for all conditions. Of note, FAO-mediated spare respiratory capacity (SRC) was determined with the formula: (SRC with palmitate) – (SRC with BSA). (D and E) CD8 T-cell polyfunctionality determined in CD8 T-cells from ART that have been polyclonally, CEF- and HIV-1 Gag- activated specifically in the presence or absence of IL21 and etomoxir (n = 6). (D) Percentages of PRF1+ and GZMB+ cells. (E) Pie chart representations of CD8A T-cell polyfunctionality. Percentages of highly functional CD8A T-cells were also indicated in bold. β, symbol used for paired t test (comparison between treated CD8 T-cells and their untreated control). β, 0.05 > P> 0.01; ββ, 0.01 > P> 0.001 and βββ, 0.001 > P> 0.0001

References

    1. Graw F, Regoes RR.. Predicting the impact of CD8+ T cell polyfunctionality on HIV disease progression. J Virol. 2014;88:10134–10145. - PMC - PubMed
    1. Boyd A, Almeida JR, Darrah PA, et al. Pathogen-specific T cell polyfunctionality is a correlate of T cell efficacy and immune protection. PLoS One. 2015;10:e0128714. - PMC - PubMed
    1. Almeida JR, Price DA, Papagno L, et al. Superior control of HIV-1 replication by CD8+ T cells is reflected by their avidity, polyfunctionality, and clonal turnover. J Exp Med. 2007;204:2473–2485. - PMC - PubMed
    1. Angin M, Volant S, Passaes C, et al. Metabolic plasticity of HIV-specific CD8(+) T cells is associated with enhanced antiviral potential and natural control of HIV-1 infection. Nat Metab. 2019;1:704–716. - PubMed
    1. Betts MR, Nason MC, West SM, et al. HIV nonprogressors preferentially maintain highly functional HIV-specific CD8+ T cells. Blood. 2006;107:4781–4789. - PMC - PubMed

Publication types

MeSH terms