. 2021 Nov;17(11):3491-3510.
doi: 10.1080/15548627.2021.1875611. Epub 2021 Jan 25.

Decrease of neuronal FKBP4/FKBP52 modulates perinuclear lysosomal positioning and MAPT/Tau behavior during MAPT/Tau-induced proteotoxic stress

Affiliations

Decrease of neuronal FKBP4/FKBP52 modulates perinuclear lysosomal positioning and MAPT/Tau behavior during MAPT/Tau-induced proteotoxic stress

Béatrice Chambraud et al. Autophagy. 2021 Nov.

Abstract

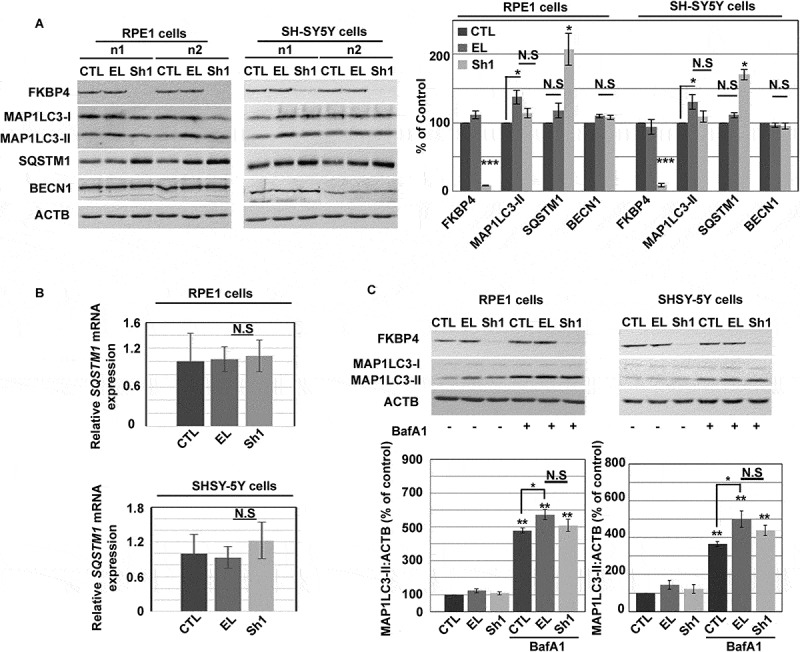
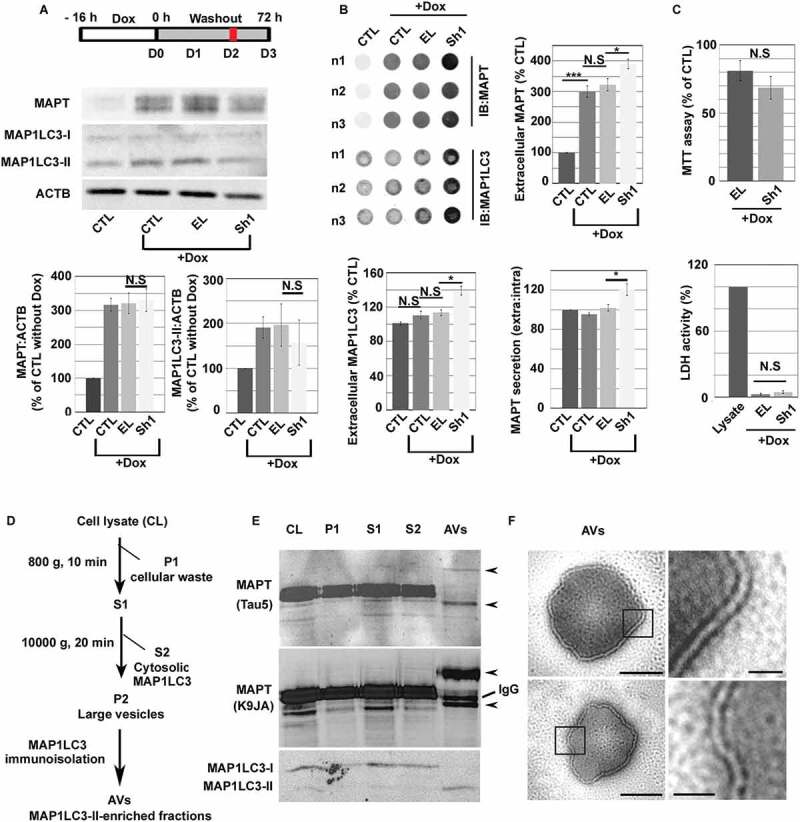
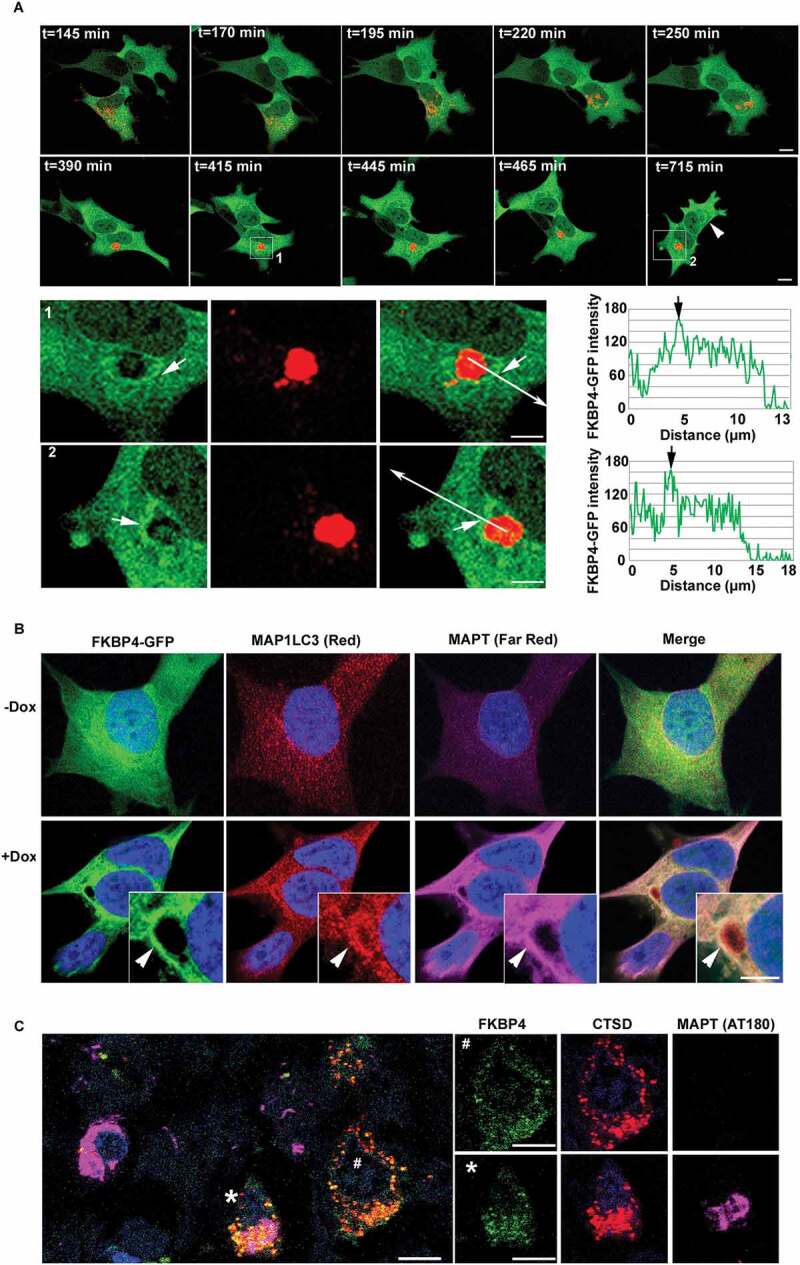
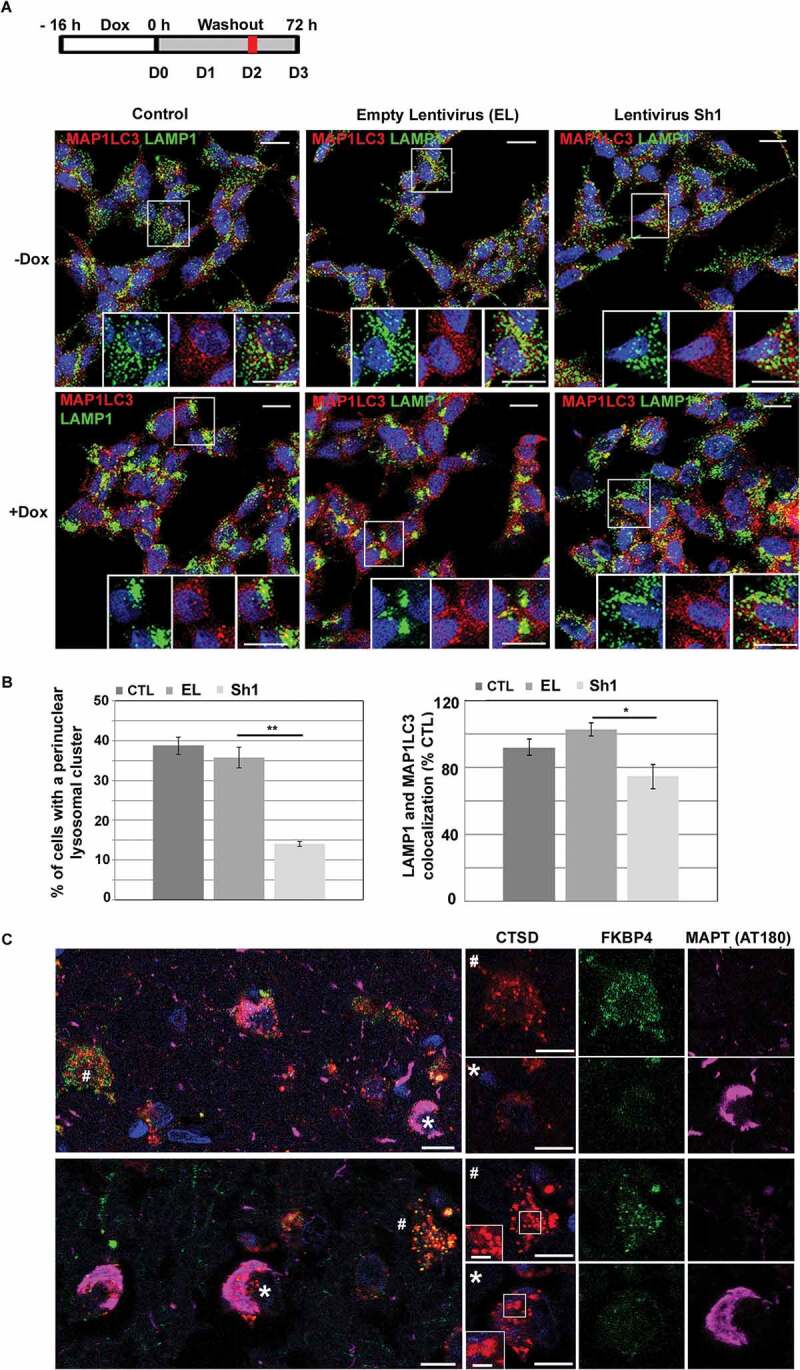
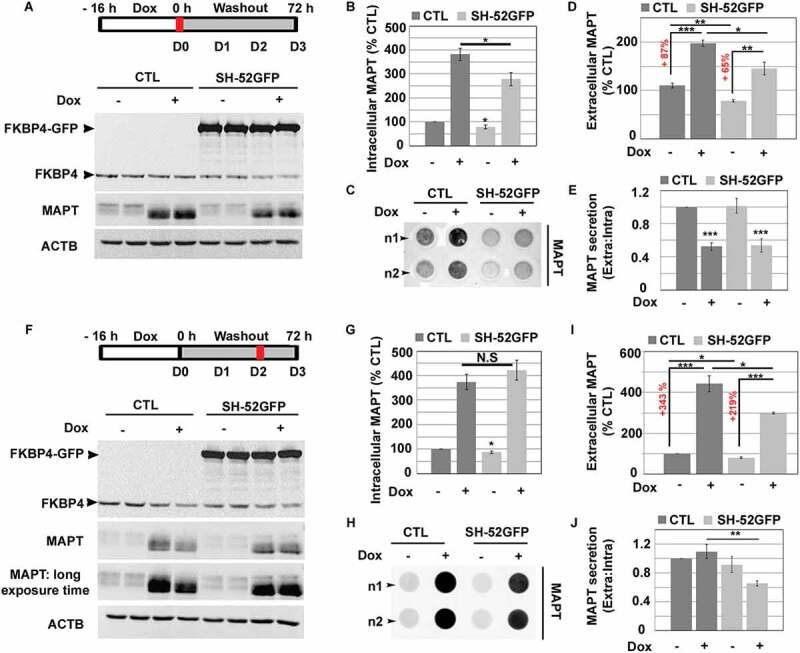
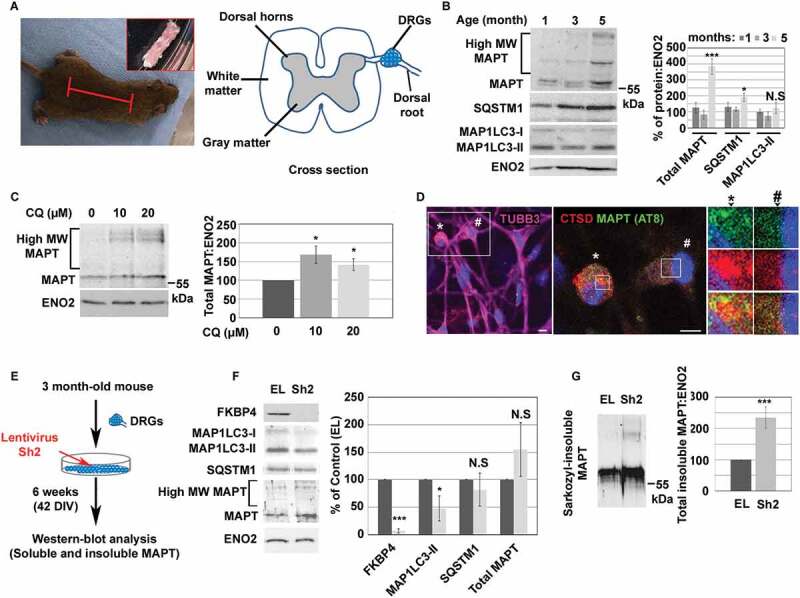
Defects of autophagy-lysosomal protein degradation are thought to contribute to the pathogenesis of several neurodegenerative diseases, and the accumulation of aggregation prone proteins such as MAPT/Tau in Alzheimer disease (AD). We previously showed the localization of the immunophilin FKBP4/FKBP52 in the lysosomal system of healthy human neurons suggesting its possible role in lysosome function. We also showed that decreased FKBP4 levels in AD brain neurons correlate with abnormal MAPT accumulation and aggregation. In this study, we demonstrate that FKBP4 decrease in a human neuronal cell line (SH-SY5Y) and in dorsal root ganglion (DRG) neurons from human MAPTP301S transgenic mice affected the function of the autophagy-lysosomal system under MAPT induced proteotoxic stress conditions. We show that acute MAPT accumulation in SH-SY5Y cells induced perinuclear clustering of lysosomes, triggered FKBP4 localization around the clusters and its colocalization with MAPT and MAP1LC3/LC3-positive autophagic vesicles; a similar FKBP4 localization was detected in some AD brain neurons. We demonstrate that FKBP4 decrease altered lysosomal clustering along with MAPT and MAP1LC3 secretion increase. Although ectopic FKBP4 expression could not induce autophagy under our experimental conditions, it prevented MAPT secretion after MAPT accumulation in SH-SY5Y cells implying a regulatory role of FKBP4 on MAPT secretion. Finally, we observe that FKBP4 deficiency decreased MAP1LC3-II expression and provoked MAPT accumulation during long-term stress in mouse DRG neurons. We hypothesize that the abnormal FKBP4 decrease observed in AD brain neurons might hinder autophagy efficiency and contribute to the progression of the tauopathy by modulating MAPT secretion and accumulation during MAPT pathogenesis.Abbreviations: AD: Alzheimer disease; AKT/protein kinase B: AKT serine/threonine kinase; ALP: Autophagy-lysosomal pathway; ATG: autophagy-related; BafA1: bafilomycin A1; CQ: chloroquine; CTSD: cathepsin D; DIV: days in vitro; DRG: dorsal root ganglion neurons; Dox: doxycycline; DNAJC5: DnaJ heat shock protein family (Hsp40) member C5; EL: empty lentiviral vectors; ENO2/NSE: enolase 2, gamma neuronal; FKBP4/FKBP52: FKBP prolyl isomerase 4; FTLD-Tau: frontotemporal lobar degeneration with Tau pathology; GFP: green fluorescent protein; LAMP1: lysosomal associated membrane protein 1; LDH: lactate dehydrogenase; MAP1LC3/LC3: microtubule associated protein 1 light chain 3; MAPT/Tau: microtubule associated protein tau; MTT: tetrazolium salt; NFTs: neurofibrillary tangles; RPE-1: retinal pigment epithelial cells; shRNA: small-hairpin ribonucleic acid; SQSTM1/p62: sequestosome 1; SD: standard deviation; SEM: standard error of the mean; SH-SY5Y: human neuroblastoma cells; Sh1 or Sh2: Lentiviral shRNA vectors inducing FKBP4 decrease; SH-52GFP: MAPT/Tau-inducible SH-SY5Y cell line constitutively expressing FKBP4-GFP; TUBB3/βIII tubulin: tubulin beta 3 class III; UPS: ubiquitin-proteasome system.

Keywords: Alzheimer disease; FKBP52; Tau; autophagy; lysosomes; proteotoxic stress.


Conflict of interest statement

The authors have no conflicts of interest to disclose.

Figures

Figure 1.
Figure 1.
FKBP4 decrease modulated MAP1LC3-II and SQSTM1 expression in RPE-1 and SH-SY5Y cells. (A) Representative western-blot analysis of FKBP4, MAP1LC3 and SQSTM1 levels in shRNA-treated cell lysates (n1 and n2). ACTB/actin was used as loading control. CTL: untreated cells; EL: empty lentivirus; Sh1: shRNA directed against FKBP4. n = 6 experiments. Quantification of immunoblot signal was normalized to ACTB and expressed as the mean ± SEM of the values normalized to the CTL condition. Statistical analysis was performed using Student’s t-test **p < 0.01 and ***p < 0.001. (B) Quantitative real-time PCR analysis of SQSTM1 mRNA levels. An equal amount of mRNA level relative to controls (CTL and EL) was detected in Sh1 cells. (C) Autophagy flux measurement. Representative western-blot analysis showing FKBP4 and MAP1LC3 levels in lysates of cells treated or not with shRNA (CTL, EL, Sh1) with or without autophagy inhibitor BafA1 (25 nM, 2 h). Quantification of MAP1LC3-II signal was normalized to ACTB. Statistical analysis was performed using Student’s t-test *p < 0.05 and **p < 0.01, n = 4. Abbreviations: BafA1, bafilomycin A1; N.S., not significant; PCR, polymerase chain reaction; shRNA, small hairpin RNA; SEM, standard error of the mean
Figure 2.
Figure 2.
The absence of FKBP4 generated a decrease of intracellular MAP1LC3-II during MAPT proteotoxic stress in SH-SY5Y cells. (A) Western-blot of FKBP4, MAP1LC3, SQSTM1 and MAPT levels in shRNA-treated cells for three days (D0-D3) after doxycycline (Dox) washout. ACTB was used as loading control. (B) Quantification of immunoblot signals normalized to ACTB at each day (D0-D3), n = 4 experiments, error bars represent means ± SEM. (C) Representative western-blot analysis of MAPT level in Dox-treated SH-SY5Y cells after cell treatment with CQ (20 µM, 24 h). Cells were treated at D1 and cell lysates analyzed at D2 (see schema). (D) Quantification of immunoblot signal for MAPT was normalized to ACTB. Statistical analysis was determined by Student’s t-test **p < 0.01 and ***p < 0.001; n = 5, ± SEM. Abbreviations: CQ, chloroquine; N.S, not significant; ShRNA, small hairpin RNA; SEM, standard error of the mean
Figure 3.
Figure 3.
The absence of FKBP4 stimulated MAPT and MAP1LC3 secretion during MAPT proteotoxic stress. (A) Representative western-blot analysis of intracellular MAPT and MAP1LC3 levels in Dox-treated SH-SY5Y cells at D2 after doxycycline (Dox) washout. Quantification of immunoblot signal was normalized to ACTB. Error bars represent means ± SEM. (B) Representative triplicate (n1-n3) dot-blot image showing MAPT and MAP1LC3 signals in extracellular medium at D2 for control (CTL), CTL+Dox, EL+Dox and Sh1+ Dox cells. Dot-blot signals for MAP1LC3 and MAPT (extracellular and extra/intra) were quantified, n = 3 experiments, statistical analysis was determined by Student’s t-test *p < 0.05 and ***p < 0.001; NS: not significant. Error bars represent means ± SEM. (C) Cell viability was measured by MTT and LDH assays. (D) AVs immunoisolation from FKBP4-deficient cells lysates (CL). CL was centrifuged 10 min at 800 g to eliminate cellular waste (P1). The supernatant (S1) was then centrifuged 20 min at 10,000 g to obtain large vesicles (P2) and remove cytosolic MAP1LC3 (S2). P2 was then incubated with anti-MAP1LC3 antibodies and immunoisolated to provide MAP1LC3-II enriched fractions (AVs). (E) Representative western-blot analysis of MAPT and MAP1LC3 signals. MAPT was detected in AVs fractions (black arrows) with a mouse monoclonal (Tau5) and a rabbit polyclonal (K9JA) antibody respectively. IgG: heavy chains. (F) Transmission electron micrographs showing immunoisolated AVs exhibiting double membrane structures. Scale bar: 500 nm (100 nm in magnifications). Abbreviations: AVs, autophagic vacuoles; Dox, doxycycline; EL, empty lentivirus; Sh1, small hairpin RNA inducing FKBP4 decrease; SEM, standard error of the mean
Figure 4.
Figure 4.
FKBP4 concentration close to a perinuclear lysosomal cluster after MAPT overexpression in SH-SY5Y cells. (A) Time-lapse imaging of MAPT-inducible SH-SY5Y cells constitutively expressing FKBP4-GFP and transiently expressing LAMP1-RFP. Confocal images (Z = 0.4 µm thick single plane) starting from t = 145 min to t = 715 min after MAPT induction by Dox (t = 0) showing lysosomal clustering in a perinuclear area and FKBP4 concentration around the lysosomal cluster. LAMP1-RFP negative cells exhibiting a similar FKBP4 concentration are indicated by a white arrowhead. The FKBP4-GFP fluorescence intensity was analyzed at two different time points (see magnification at t = 415 min (1) and t = 715 min (2)). FKBP4-GFP accumulation is shown by white arrows. The fluorescence profile confirms the increase of FKBP4-GFP intensity in a perinuclear lysosomal cluster (see white and black arrows). Scale bar: 5 µm. (B) Images after double immunofluorescent labeling for MAP1LC3 (Red) and MAPT (Far Red) in cells expressing FKBP4-GFP after 24 h of MAPT induction by Dox. FKBP4 colocalization with MAP1LC3 and MAPT is indicated by white arrowhead. Scale bar: 5 µm. Blue indicates DAPI-stained nuclei. (C) Confocal analysis of FKBP4 (EPR6618, green), CTSD (C-20, red) and pathological MAPT (AT180, magenta) immunolabeling of frontal cortex tissue sections from AD brains. Some neurons show pathological MAPT accumulation (*) and exhibit FKBP4 concentration in close proximity to a lysosomal cluster, whereas some neurons, without MAPT accumulation (#), show normal distribution of lysosomes and FKBP4. We observe on the left the presence of a neuron with a strong MAPT accumulation showing low levels of FKBP4 and CTSD. Scale bar: 10 µm. Abbreviations: Dox, doxycycline
Figure 5.
Figure 5.
Absence of FKBP4 generated an alteration of lysosomal positioning during MAPT-induced proteotoxic stress in SH-SY5Y cells. (A) Immunofluorescence analysis of MAP1LC3 (red) and LAMP1 (green) of SH-SY5Y cells treated or not by Dox treatment two days after MAPT induction (D2) in control and lentivirus-treated cells (EL and Sh1). Autophagosomes (red vesicles) and lysosomes (green vesicles) are numerous and homogeneously distributed in control neurons while MAPT induction by Dox treatment induces lysosomal clustering (see magnifications). Scale bar: 10 µm. (B) Quantification of Dox-treated cells with a perinuclear lysosomal cluster (histogram in the left) in control (n = 5, 2984 cells), in EL (n = 5, 3041 cells) and Sh1 (n = 5, 2761 cells) cells. Statistical analysis was performed using Student’s t-test (**p < 0.01 ± SD). Quantification of LAMP1 and MAP1LC3 colocalization (autolysosomes) in the whole cytoplasm of Dox-treated cells. Statistical analysis was determined by Student’s t-test (*p < 0.05 ± SD). Blue indicates DAPI-stained nuclei. (C) Confocal analysis of CTSD (C-20, red), FKBP4 (EPR6618, green) and pathological MAPT (AT180, magenta) immunolabeling of frontal cortex tissue sections from AD brains. Some neurons show pathological MAPT accumulation (*) and lysosomal abnormalities (decrease of CTSD signals, upper; accumulation of enlarged lysosomes, bottom) whereas some neurons, without MAPT accumulation (#), show normal labeling and normally sized lysosomes. Scale bar: 10 µm (2.5 µm in magnification). Abbreviations: Dox, doxycycline; SD, standard deviation
Figure 6.
Figure 6.
FKBP4 overexpression inhibited MAPT secretion after MAPT accumulation in SH-SY5Y cells. (A) Representative western-blot analysis of FKBP4 and MAPT levels at D0 in SH-SY5Y and SH-52GFP cells treated or not by Dox. (B) Quantification of the western-blot signal of intracellular MAPT and FKBP4 was normalized to ACTB. Statistical analysis was performed using Student’s t-test *p < 0.05; ± SEM. (C) Representative duplicate (n1-n2) dot-blot image showing MAPT signal in extracellular medium at D0 for CTL, CTL+Dox, SH-52GFP and SH-52GFP +Dox cells. (D) Dot-blot quantification. Statistical analysis was determined by Student’s t-test *p < 0.05, **p < 0.01 and ***p < 0.001; ± SEM. (E) Quantification of extracellular MAPT normalized to intracellular MAPT (***p < 0.001; ± SEM). (F) Representative western-blot analysis of FKBP4 and MAPT levels at D2 in SH-SY5Y and SH-52GFP cells treated or not by Dox. (G) Quantification of the western-blot signal of intracellular MAPT and FKBP4 was normalized to ACTB. Statistical analysis was performed using Student’s t-test *p < 0.05; N.S, ± SEM. (H) Representative duplicate (n1-n2) dot-blot image showing MAPT signal in the extracellular medium at D2. (I) Dot-blot quantification for MAPT in extracellular medium at D2. Statistical analysis was determined by Student’s t-test *p < 0.05, ***p < 0.001; ± SEM. (J) Quantification of extracellular MAPT normalized to intracellular MAPT (**p < 0.01; ± SEM). Abbreviations: CTL, control; Dox, doxycycline; N.S: not significant; SEM, standard error of the mean
Figure 7.
Figure 7.
FKBP4 decrease triggered insoluble MAPT accumulation in a neuronal model of tauopathy using mice transgenic for the human MAPTP301S. (A) Images showing the region where the spinal cord was collected from the mouse (red lines) and the spinal cord sample (top right). The drawing illustrates a cross section of the spinal cord; the cluster of sensory neuron cell bodies (DRGs) situated on the dorsal root of the spinal cord is drawn in blue. (B) Representative western-blot analysis of MAPT, SQSTM1 and MAP1LC3 levels in mouse DRGs (5 DIV) at different ages (month). MAPT electrophoretic profile shows MAPT bands at ~55 kDa and also at higher molecular weight (High MW MAPT). Neuron specific enolase (ENO2/NSE) is used as loading control. Quantification of the western-blot signal of total MAPT (MAPT at ~55 kDa + High MW MAPT), SQSTM1 and MAP1LC3-II was normalized to ENO2. Statistical analysis was performed using Student’s t-test; n = 4, *p < 0.05 and ***p < 0.001; ± SEM. (C) Representative western-blot analysis of MAPT in 5 month-old DRG neurons after treatment with CQ at 10 or 20 µM (24 h). Quantification of the western-blot signal of total MAPT (MAPT at ~55 kDa + High MW MAPT) was normalized to ENO2. Statistical analysis was performed using Student’s t-test, n = 4; *p < 0.05; ± SEM. (D) Images after triple immunofluorescent labeling for CTSD (C-20, red), pathological MAPT (AT8, green) and TUBB3 (Neuronal marker, magenta) in 5 month-old DRG neurons (5 DIV). Two DRG neurons, identified by TUBB3 labeling (image on the left, * and #), were magnified and analyzed for their CTSD and MAPT AT8 signals. The neuron with pathological MAPT accumulation (AT8, green) showed a partial colocalization of MAPT at the periphery of a lysosomal cluster (red) (see the asterisk *) whereas the neuron with lower levels of pathological MAPT showed a normal lysosomal distribution (see the cross #). Scale bar: 5 µm. Blue indicates DAPI-stained nuclei. (E) DRGs dissection from 3 month-old mice. DRG neurons were collected from MAPTP301S mice spinal cords, dissociated and cultured. After 5 days of culture, DRGs were transduced at MOI 20 for five days and maintained during 42 DIV (6 weeks). Soluble and sarkozyl-insoluble fractions of cell lysates were analyzed by western-blot. (F) Representative western-blot analysis showing FKBP4, MAP1LC3, SQSTM1 and total MAPT (MAPT at ~55 kDa + High MW MAPT) levels in lysates of cells treated or not with shRNA (EL, Sh2). ENO2 was used as loading control. Quantification of the western-blot protein signal was normalized to ENO2. Statistical analysis was performed using Student’s t-test; n = 4, *p < 0.05 and ***p < 0.001; ± SEM. (G) Representative western-blot analysis of sarkozyl-insoluble fractions of MAPT (MAPT at ~55 kDa + High MW MAPT) in lysates of cells treated or not with shRNA (EL, Sh2). Quantification of total MAPT was normalized to ENO2. Statistical analysis was performed using Student’s t-test; n = 4, ***p < 0.001; ± SEM. Abbreviations: CQ, chloroquine; DIV: days in vitro; MW: molecular weight; N.S: not significant; SEM, standard error of the mean

Similar articles

Cited by

References

    1. Goldberg AL. Protein degradation and protection against misfolded or damaged proteins. Nature. 2003. Dec 18;426(6968):895–899. - PubMed
    1. Mizushima N, Levine B, Cuervo AM, et al. Autophagy fights disease through cellular self-digestion. Nature. 2008. Feb 28;451(7182):1069–1075. - PMC - PubMed
    1. Morimoto RI. Proteotoxic stress and inducible chaperone networks in neurodegenerative disease and aging. Genes Dev. 2008. June 1;22(11):1427–1438. - PMC - PubMed
    1. Kaushik S, Cuervo AM. Proteostasis and aging. Nat Med. 2015. Dec;21(12):1406–1415. - PubMed
    1. Rubinsztein DC, Marino G, Kroemer G. Autophagy and aging. Cell. 2011. Sept 2;146(5):682–695. - PubMed

Publication types

MeSH terms