. 2021 Feb 12;478(3):647-668.
doi: 10.1042/BCJ20200780.

A pipeline to evaluate inhibitors of the Pseudomonas aeruginosa exotoxin U

Affiliations

A pipeline to evaluate inhibitors of the Pseudomonas aeruginosa exotoxin U

Daniel M Foulkes et al. Biochem J. .

Abstract

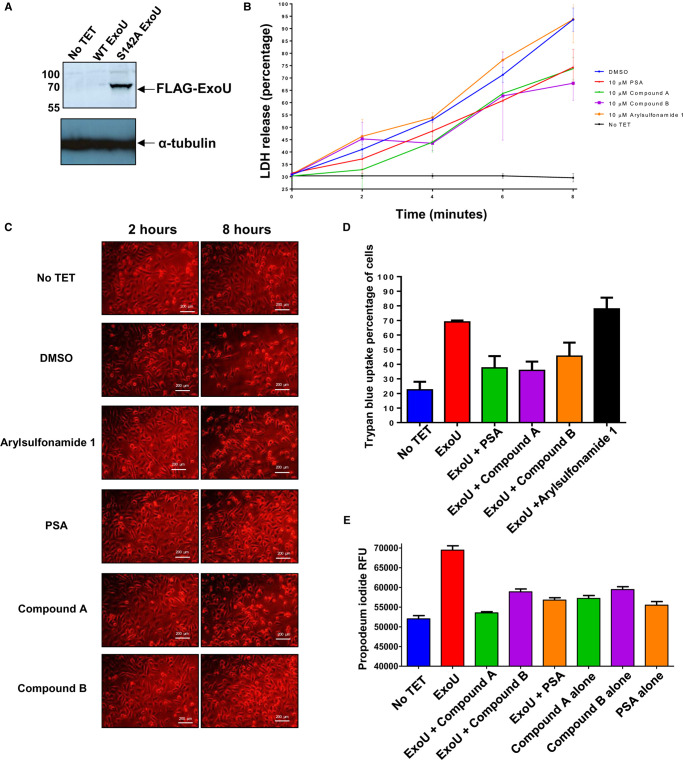
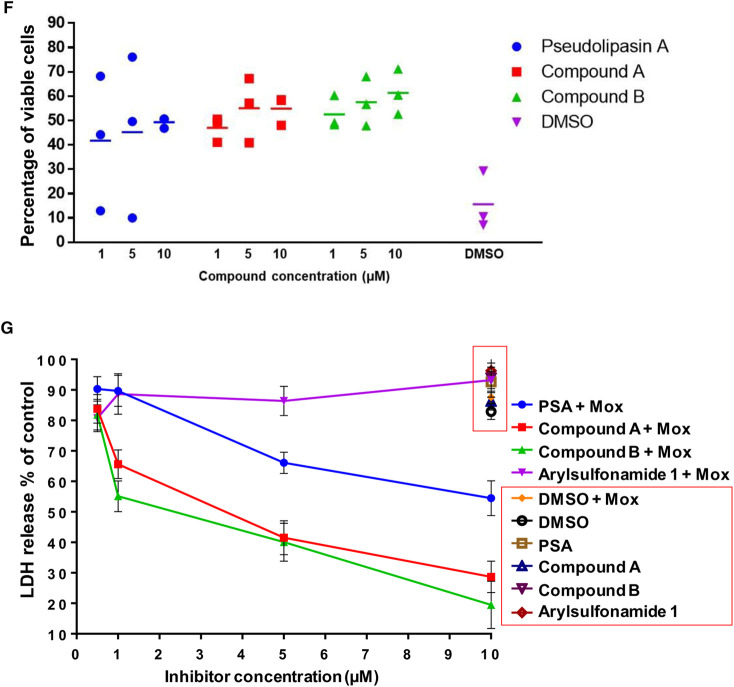
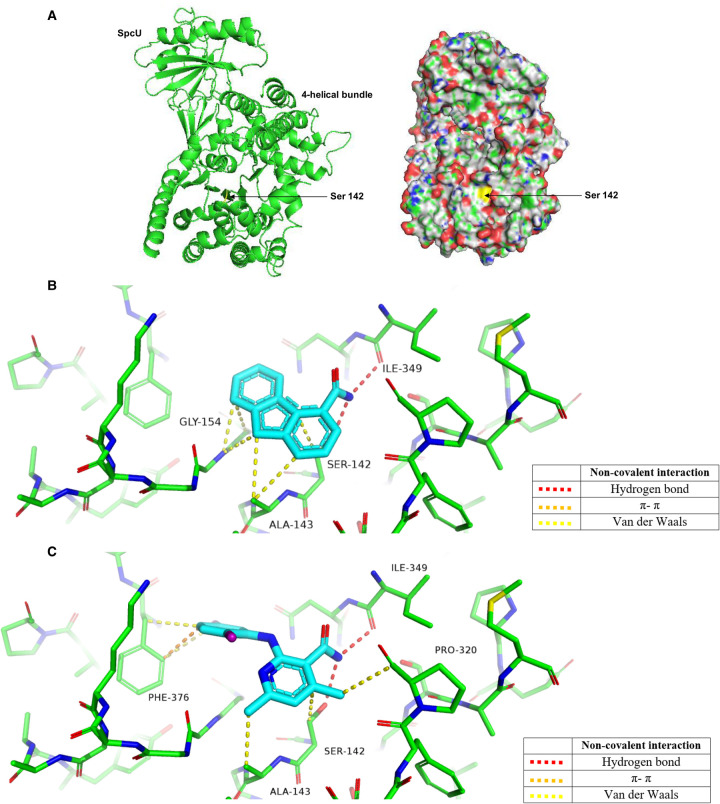
Pseudomonas aeruginosa has recently been highlighted by the World Health Organisation (WHO) as a major threat with high priority for the development of new therapies. In severe P. aeruginosa infections, the phospholipase activity of the type 3 secretion system toxin, ExoU, induces lysis of target host cells and results in the poorest clinical outcomes. We have developed an integrated pipeline to evaluate small molecule inhibitors of ExoU in vitro and in cultured cell models, including a disease-relevant corneal epithelial (HCE-T) scratch and infection model using florescence microscopy and cell viability assays. Compounds Pseudolipasin A, compound A and compound B were effective in vitro inhibitors of ExoU and mitigated P. aeruginosa ExoU-dependent cytotoxicity after infection of HCE-T cells at concentrations as low as 0.5 µM. Addition of the antimicrobial moxifloxacin controlled bacterial load, allowing these assays to be extended from 6 h to 24 h. P. aeruginosa remained cytotoxic to HCE-T cells with moxifloxacin, present at the minimal inhibitory concentration for 24 h, but, when used in combination with either Pseudolipasin A, compound A or compound B, a greater amount of viable cells and scratch healing were observed. Thus, our pipeline provides evidence that ExoU inhibitors could be used in combination with certain antimicrobials as a novel means to treat infections due to ExoU producing P. aeruginosa, as well as the means to identify more potent ExoU inhibitors for future therapeutics.

Keywords: Pseudomonas aeruginosa; ExoU; antimicrobial; inhibitor; type 3 secretion system; virulence factor.


Conflict of interest statement

The authors declare that there are no competing interests associated with the manuscript.

Figures

Figure 1.
Figure 1.. Purification and in vitro analysis of recombinant ExoU with prospective small molecule inhibitors.
(A) Left: His-tagged ExoU was purified from C43(DE3) E. coli. Immobilised metal affinity chromatography (IMAC) purified His-ExoU, including two major contaminant proteins, were resolved by SDS–polyacrylamide gel electrophoresis (SDS–PAGE) and identified by employing mass spectrometry. Right: His-ExoU was further purified to homogeneity by size-exclusion chromatography; 5 µg of His-ExoU was resolved and visualised by SDS–PAGE. (B) The hydrolysis of arachidonoyl Thio-PC substrate by ExoU was assessed in the presence of 10 µM of the indicated compound. To each reaction, ubiquitin and PIP2 were added in order to allow induction of ExoU phospholipase activity. Experiments were performed in triplicate, the results represent means, and error bars represent standard deviations and representative profiles are shown of substrate conversion as a function of absorbance with the progression of time (QD = quinacrine dihydrochloride and OP = oleyoxylethyl phosphoryl choline). (C) Chemical structures of prospective compounds that are proposed to inhibit ExoU mediated toxicity in cells. IC50 values are shown.
Figure 2.
Figure 2.. Inhibition of ExoU in a HeLa cell transfection model with prospective small molecules.
(A) Flp-In T-REx-HeLa cells were transfected with pcDNA5/FRT/TO encoding the full-length WT or S142A EoxU gene so that FLAG-ExoU could be expressed upon incubation with TET for 6 h, prior to whole-cell lysis and analysis by western blotting. (B) LDH release of HeLa cells transfected and induced to express WT ExoU over 8 h in the presence of 10 µM of the indicated compound. One-way ANOVA analyses were performed to determine statistical significance between DMSO and compound treated cells. (C) Brightfield microscopy images of HeLa cells 8 h subsequent to induction of WT ExoU expression in the presence of indicated compound. (D) Trypan blue uptake of HeLa cells 8 h subsequent to induction WT ExoU expression in the presence of the indicated compound. (E) Propidium iodide uptake of WT ExoU expressing HeLa cells in the presence of the indicated compound, measured by flow cytometry.
Figure 3.
Figure 3.. Analysis of S142A ExoU stability in HeLa cells in the presence of compound.
(A) Flp-In T-REx-HeLa cells were transfected with pcDNA5/FRT/TO encoding the full-length S142A EoxU gene FLAG-S142A ExoU expression was induced with TET and 10 µM of the indicated compound for 8 h, prior to whole-cell lysis and analysis by Western blotting. (B) Densitometry analysis of S142A ExoU signal from compound treated HeLa cells, relative to a DMSO. T-tests were used to determine statistically significant differences between compound A (P = 0.0035) and compound B (P = 0.0039) relative to DMSO treated.
Figure 4.
Figure 4.. Establishment of a HCE-T cell scratch and infection assay with cytotoxicity analysis of prospective ExoU inhibitors.
HCE-T were gown to full confluence and a scratch applied to the cell monolayer prior to infection with PA103 ΔUT: ExoU at an MOI of 2.5 for 6 h, followed by analysis by Live/Dead fluorescence microscopy (A) or LDH release (B). (C) MTT assays comparing the cytotoxicity of ExoU inhibitors in HCE-T cells. The MTT assay was performed 72 h subsequent to initial compound exposure and IC50 values in µM ± SD derived from three independent experiments are shown.
Figure 5.
Figure 5.. Protection of scratched HCE-T cells, during infection with ExoU expressing PA103, by selected compounds.
(A) Live/Dead fluorescence microscopy analysis of scratched HCE-T cells 6 h post infection with ExoU expressing PA103 (PA103 ΔUT ExoU), in the presence of varying concentrations of indicated compound. (B) Measurement of total scratch area (mm2) in compound treated HCE-T cells 6 h post infection. (C) Percentage of viable cells calculated within the scratch margin. (D) Dose response analysis of inhibitors analysing the protective effect of compounds on scratched then infected HCE-T cells after 6 h incubation, by LDH release.
Figure 6.
Figure 6.. Compounds synergise with moxifloxacin to mitigate cell death induced by ExoU expressing PA103 over 24 h.
(A) Moxifloxacin (Mox) at the established MIC of 2 µM was added to scratched HCE-T cells that had been infected with PA103 ΔUT: ExoU at an MOI of 2.5 for 24 h. The number of CFU in the cell culture medium was then deduced. (B) LDH release from scratched HCE-T cells after 24 h infection in the presence of moxifloxacin at the MIC. (C) Live/Dead fluorescence microscopy analysis of scratched HCE-T cells 24 h post infection, without and with moxifloxacin at the MIC. (D) Live/Dead fluorescence microscopy analysis of scratched HCE-T cells 24 h post infection, in the presence of varying concentrations of indicated compound, with moxifloxacin present at the MIC. (E) Measurement of total scratch area (mm2) in compound treated HCE-T cells 24 h post infection in the presence of moxifloxacin. (F) Percentage of viable cells calculated within the scratch margin 24 h after infection in the presence of moxifloxacin. (G) LDH assay for dose response analysis of inhibitors analysing protective effect of compounds on scratched then infected HCE-T cells after 24 h incubation in the presence or absence of moxifloxacin at the MIC.
Figure 7.
Figure 7.. Docking poses of PSA and compound B to ExoU.
(A) Structure and Connolly surface of the ExoU-SpcU complex with the catalytic serine 142 residue highlighted in yellow. Docked molecules (B) PSA and (C) compound B are rendered as sticks (carbon — cyan, nitrogen — blue, oxygen — red, chlorine — purple). Residues involved in non-covalent interactions are rendered as thin sticks (carbon — green, nitrogen — blue, oxygen — red). Non-covalent contacts are shown as dotted lines with the colour code given in the key. Non-covalent contacts analysed with ViewContacts software. Figure rendered in PyMol.

References

    1. Stewart, R.M., Wiehlmann, L., Ashelford, K.E., Preston, S.J., Frimmersdorf, E., Campbell, B.J.et al. (2011) Genetic characterization indicates that a specific subpopulation of Pseudomonas aeruginosa is associated with keratitis infections. J. Clin. Microbiol. 49, 993–1003 10.1128/JCM.02036-10 - DOI - PMC - PubMed
    1. Newman, J.W., Floyd, R.V. and Fothergill, J.L. (2017) The contribution of Pseudomonas aeruginosa virulence factors and host factors in the establishment of urinary tract infections. FEMS Microbiol. Lett. 364 10.1093/femsle/fnx124 - DOI - PubMed
    1. Schulert, G.S., Feltman, H., Rabin, S. ., Martin, C., Battle, S., Rello, J.et al. (2003) Secretion of the toxin ExoU is a marker for highly virulent Pseudomonas aeruginosa isolates obtained from patients with hospital-acquired pneumonia. J. Infect. Dis. 188, 1695–1706 10.1086/379372 - DOI - PubMed
    1. Roy-Burman, A., Savel, R., Racine, S., Swanson, B., Revadigar, N., Fujimoto, J.et al. (2001) Type III protein secretion is associated with death in lower respiratory and systemic Pseudomonas aeruginosa infections. J. Infect. Dis. 183, 1767–1774 10.1086/320737 - DOI - PubMed
    1. Hauser, A.R., Cobb, E., Bodí, M., Mariscal, D., Vallés, J., Engel, J.N.et al. (2002) Type III protein secretion is associated with poor clinical outcomes in patients with ventilator-associated pneumonia caused by Pseudomonas aeruginosa. Crit. Care Med. 30, 521–528 10.1097/00003246-200203000-00005 - DOI - PubMed

Publication types

MeSH terms