

Evaluation of a multiview architecture for automatic vertebral labeling of palliative radiotherapy simulation CT images
- PMID: 33459402
- PMCID: PMC7756475
- DOI: 10.1002/mp.14415
Evaluation of a multiview architecture for automatic vertebral labeling of palliative radiotherapy simulation CT images
Abstract
Purpose: The purpose of this work was to evaluate the performance of X-Net, a multiview deep learning architecture, to automatically label vertebral levels (S2-C1) in palliative radiotherapy simulation CT scans.
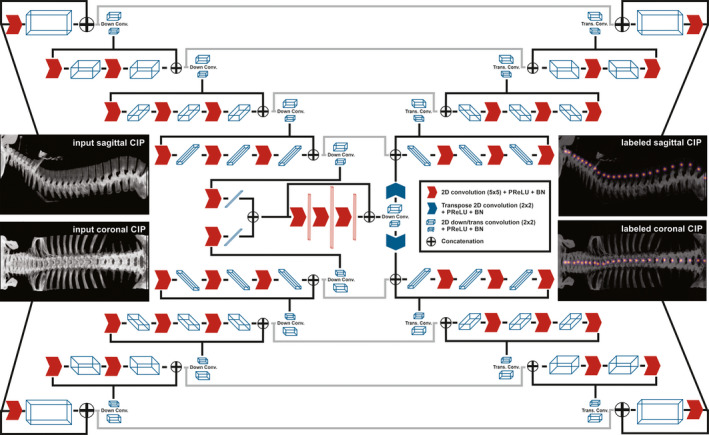
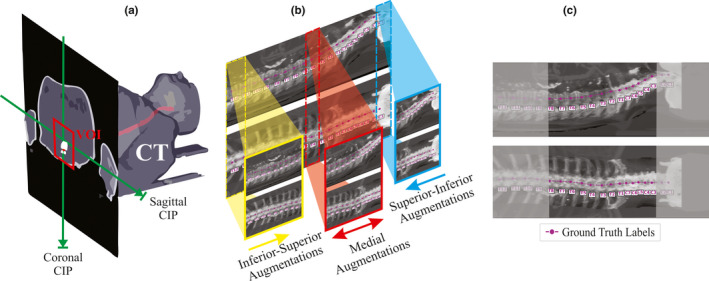
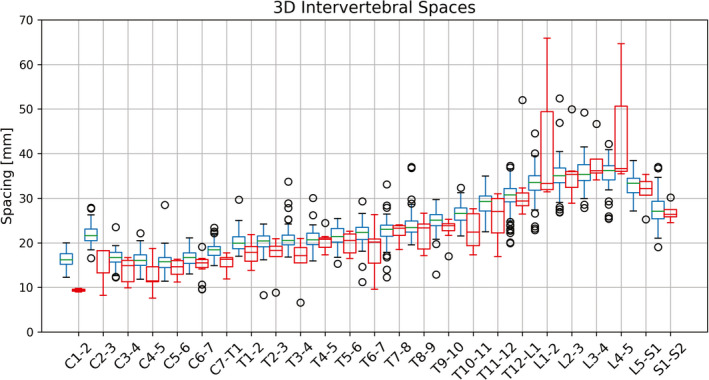
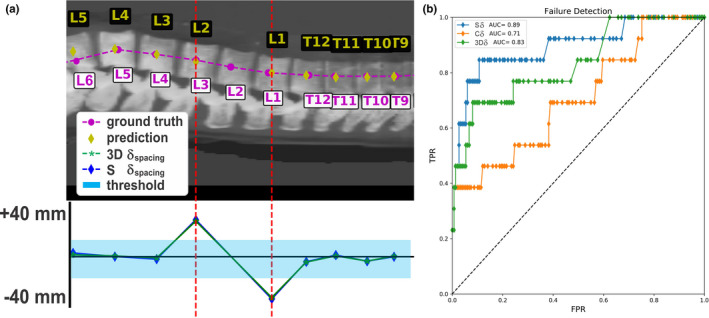
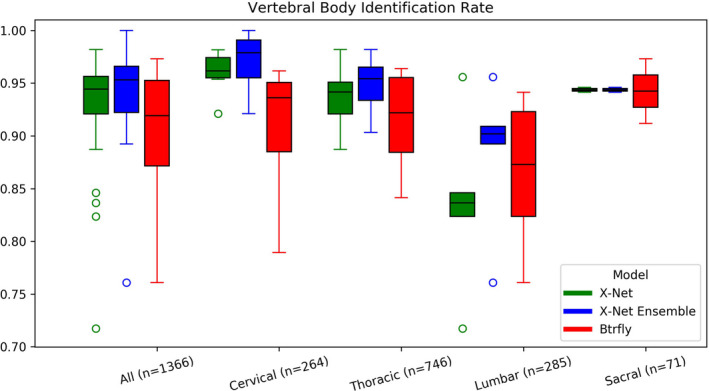
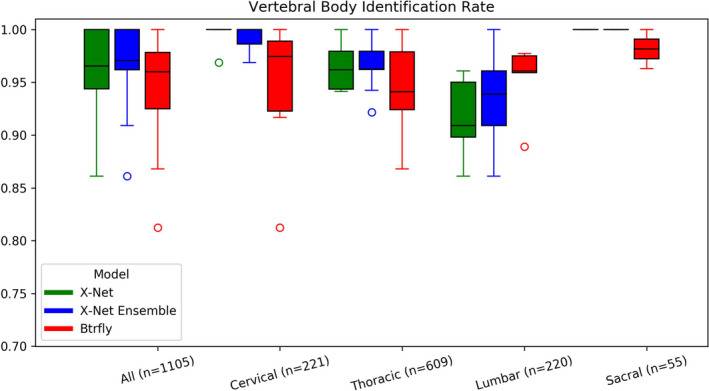
Methods: For each patient CT scan, our automated approach 1) segmented spinal canal using a convolutional-neural network (CNN), 2) formed sagittal and coronal intensity projection pairs, 3) labeled vertebral levels with X-Net, and 4) detected irregular intervertebral spacing using an analytic methodology. The spinal canal CNN was trained via fivefold cross validation using 1,966 simulation CT scans and evaluated on 330 CT scans. After labeling vertebral levels (S2-C1) in 897 palliative radiotherapy simulation CT scans, a volume of interest surrounding the spinal canal in each patient's CT scan was converted into sagittal and coronal intensity projection image pairs. Then, intensity projection image pairs were augmented and used to train X-Net to automatically label vertebral levels using fivefold cross validation (n = 803). Prior to testing upon the final test set (n = 94), CT scans of patients with anatomical abnormalities, surgical implants, or other atypical features from the final test set were placed in an outlier group (n = 20), whereas those without these features were placed in a normative group (n = 74). The performance of X-Net, X-Net Ensemble, and another leading vertebral labeling architecture (Btrfly Net) was evaluated on both groups using identification rate, localization error, and other metrics. The performance of our approach was also evaluated on the MICCAI 2014 test dataset (n = 60). Finally, a method to detect irregular intervertebral spacing was created based on the rate of change in spacing between predicted vertebral body locations and was also evaluated using the final test set. Receiver operating characteristic analysis was used to investigate the performance of the method to detect irregular intervertebral spacing.
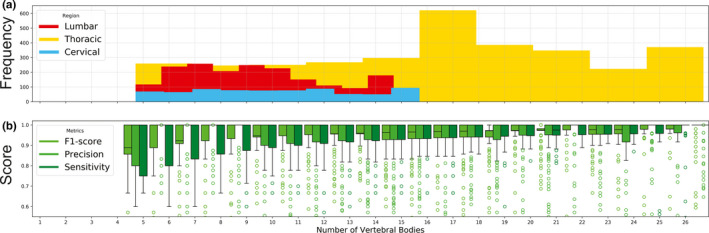
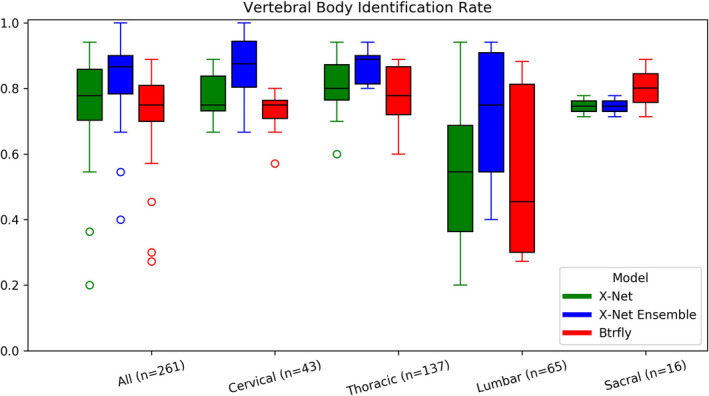
Results: The spinal canal architecture yielded centroid coordinates spanning S2-C1 with submillimeter accuracy (mean ± standard deviation, 0.399 ± 0.299 mm; n = 330 patients) and was robust in the localization of spinal canal centroid to surgical implants and widespread metastases. Cross-validation testing of X-Net for vertebral labeling revealed that the deep learning model performance (F1 score, precision, and sensitivity) improved with CT scan length. The X-Net, X-Net Ensemble, and Btrfly Net mean identification rates and localization errors were 92.4% and 2.3 mm, 94.2% and 2.2 mm, and 90.5% and 3.4 mm, respectively, in the final test set and 96.7% and 2.2 mm, 96.9% and 2.0 mm, and 94.8% and 3.3 mm, respectively, within the normative group of the final test set. The X-Net Ensemble yielded the highest percentage of patients (94%) having all vertebral bodies identified correctly in the final test set when the three most inferior and superior vertebral bodies were excluded from the CT scan. The method used to detect labeling failures had 67% sensitivity and 95% specificity when combined with the X-Net Ensemble and flagged five of six patients with atypical vertebral counts (additional thoracic (T13), additional lumbar (L6) or only four lumbar vertebrae). Mean identification rate on the MICCAI 2014 dataset using an X-Net Ensemble was increased from 86.8% to 91.3% through the use of transfer learning and obtained state-of-the-art results for various regions of the spine.
Conclusions: We trained X-Net, our unique convolutional neural network, to automatically label vertebral levels from S2 to C1 on palliative radiotherapy CT images and found that an ensemble of X-Net models had high vertebral body identification rate (94.2%) and small localization errors (2.2 ± 1.8 mm). In addition, our transfer learning approach achieved state-of-the-art results on a well-known benchmark dataset with high identification rate (91.3%) and low localization error (3.3 mm ± 2.7 mm). When we pre-screened radiotherapy CT images for the presence of hardware, surgical implants, or other anatomic abnormalities prior to the use of X-Net, it labeled the spine correctly in more than 97% of patients and 94% of patients when scans were not prescreened. Automatically generated labels are robust to widespread vertebral metastases and surgical implants and our method to detect labeling failures based on neighborhood intervertebral spacing can reliably identify patients with an additional lumbar or thoracic vertebral body.
Keywords: automatic vertebral labeling; deep learning.
© 2020 The Authors. Medical Physics published by Wiley Periodicals LLC on behalf of American Association of Physicists in Medicine.
Conflict of interest statement
Funding was received in part from Varian Medical Systems and the National Cancer Institute. Multiple authors of this publication are members of the Radiation Planning Assistant team at the University of Texas MD Anderson Medical Center.
Figures
Similar articles
-
An Automated Treatment Planning Framework for Spinal Radiation Therapy and Vertebral-Level Second Check.Int J Radiat Oncol Biol Phys. 2022 Nov 1;114(3):516-528. doi: 10.1016/j.ijrobp.2022.06.083. Epub 2022 Jul 3. Int J Radiat Oncol Biol Phys. 2022. PMID: 35787928
-
Development and multi-institutional validation of a convolutional neural network to detect vertebral body mis-alignments in 2D x-ray setup images.Med Phys. 2023 May;50(5):2662-2671. doi: 10.1002/mp.16359. Epub 2023 Mar 21. Med Phys. 2023. PMID: 36908243
-
Development and interinstitutional validation of an automatic vertebral-body misalignment error detector for cone-beam CT-guided radiotherapy.Med Phys. 2022 Oct;49(10):6410-6423. doi: 10.1002/mp.15927. Epub 2022 Aug 23. Med Phys. 2022. PMID: 35962982
-
Deep learning-based detection of lumbar spinal canal stenosis using convolutional neural networks.Spine J. 2024 Nov;24(11):2086-2101. doi: 10.1016/j.spinee.2024.06.009. Epub 2024 Jun 22. Spine J. 2024. PMID: 38909909
-
Musical Instrument Identification Using Deep Learning Approach.Sensors (Basel). 2022 Apr 15;22(8):3033. doi: 10.3390/s22083033. Sensors (Basel). 2022. PMID: 35459018 Free PMC article. Review.
Cited by
-
Current development and prospects of deep learning in spine image analysis: a literature review.Quant Imaging Med Surg. 2022 Jun;12(6):3454-3479. doi: 10.21037/qims-21-939. Quant Imaging Med Surg. 2022. PMID: 35655825 Free PMC article. Review.
-
Multi-organ segmentation of abdominal structures from non-contrast and contrast enhanced CT images.Sci Rep. 2022 Nov 9;12(1):19093. doi: 10.1038/s41598-022-21206-3. Sci Rep. 2022. PMID: 36351987 Free PMC article.
-
Clinical acceptability of fully automated external beam radiotherapy for cervical cancer with three different beam delivery techniques.Med Phys. 2022 Sep;49(9):5742-5751. doi: 10.1002/mp.15868. Epub 2022 Jul 26. Med Phys. 2022. PMID: 35866442 Free PMC article.
-
Artificial Intelligence and Computer Vision in Low Back Pain: A Systematic Review.Int J Environ Res Public Health. 2021 Oct 17;18(20):10909. doi: 10.3390/ijerph182010909. Int J Environ Res Public Health. 2021. PMID: 34682647 Free PMC article.
-
External validation of an algorithm to detect vertebral level mislabeling and autocontouring errors.Phys Imaging Radiat Oncol. 2025 Feb 25;34:100738. doi: 10.1016/j.phro.2025.100738. eCollection 2025 Apr. Phys Imaging Radiat Oncol. 2025. PMID: 40129727 Free PMC article.
References
-
- Lutz S. The role of radiation therapy in controlling painful bone metastases. Curr Pain Headache Rep. 2012;16:300–306. - PubMed
-
- Lutz S, Balboni T, Jones J, et al. Palliative radiation therapy for bone metastases: Update of an ASTRO Evidence‐Based Guideline. Pract Radiat Oncol. 2017;7:4–12. - PubMed
-
- Janjan N, Lutz S, Bedwinek J, et al. Therapeutic guidelines for the treatment of bone metastasis: a report from the American college of radiology appropriateness criteria expert panel on radiation oncology. J Palliat Med. 2009;12:417–426. - PubMed
-
- Kurihara Y, Yakushiji YK, Matsumoto J, et al. The Ribs: anatomic and radiologic considerations. Radiographics. 1999;19:105–119. - PubMed
MeSH terms
LinkOut - more resources
Full Text Sources
Other Literature Sources
Medical
