. 2021 Jan 18:10:e54346.
doi: 10.7554/eLife.54346.

Antagonism between germ cell-less and Torso receptor regulates transcriptional quiescence underlying germline/soma distinction

Affiliations

Antagonism between germ cell-less and Torso receptor regulates transcriptional quiescence underlying germline/soma distinction

Megan M Colonnetta et al. Elife. .

Abstract

Transcriptional quiescence, an evolutionarily conserved trait, distinguishes the embryonic primordial germ cells (PGCs) from their somatic neighbors. In Drosophila melanogaster, PGCs from embryos maternally compromised for germ cell-less (gcl) misexpress somatic genes, possibly resulting in PGC loss. Recent studies documented a requirement for Gcl during proteolytic degradation of the terminal patterning determinant, Torso receptor. Here we demonstrate that the somatic determinant of female fate, Sex-lethal (Sxl), is a biologically relevant transcriptional target of Gcl. Underscoring the significance of transcriptional silencing mediated by Gcl, ectopic expression of a degradation-resistant form of Torso (torsoDeg) can activate Sxl transcription in PGCs, whereas simultaneous loss of torso-like (tsl) reinstates the quiescent status of gcl PGCs. Intriguingly, like gcl mutants, embryos derived from mothers expressing torsoDeg in the germline display aberrant spreading of pole plasm RNAs, suggesting that mutual antagonism between Gcl and Torso ensures the controlled release of germ-plasm underlying the germline/soma distinction.

Keywords: D. melanogaster; cell fate; developmental biology; germ cell-less; germ cells; germline; torso receptor; transcriptional quiescence.


Conflict of interest statement

MC, LL, LW, GK, EC, PR, PS, DL, GD No competing interests declared

Figures

Figure 1.
Figure 1.. sis-b and Sxl are transcribed in gcl PBs and PGCs.
smFISH was performed using probes specific for sis-b or Sxl on 0–3 hr old embryos to assess the status of transcription in gcl PBs. Wild-type (WT) embryos of similar age were used as control. Posterior poles of representative pre-syncytial blastoderm embryos are shown with sis-b (a/b) or Sxl (c/d) RNA visualized in red and Hoescht DNA dye in blue. While 0% of control embryos display sis-b (a/a’, n = 16) or Sxl (c/c’, n = 18) transcription in PBs, transcription of both sis-b (b/b’) and Sxl (d/d’) is detected in gcl mutant PBs. We observed sis-b transcription in 67% (n = 21, p=2.10e-05) and Sxl transcription in 42% (n = 31, p=0.001593) of gcl embryos. Scale bar represents 10 µm.
Figure 2.
Figure 2.. Gcl represses Sxl expression in the early embryonic pole cells, and ectopic expression of Gcl is sufficient to repress Sxl in somatic nuclei.
0–4 hr old paraformaldehyde-fixed embryos from mothers of indicated genotype were stained with anti-Sxl antibody to assess whether Sxl expression is upregulated in gcl PGCs (A–D). Posterior of the embryos are oriented to the right in all images. Panels A and B: early syncytial blastoderm stage embryos. Sxl protein is absent in the pole cells from the control (wild-type [WT]) embryo (A) whereas some of the gcl mutant pole cells show presence of Sxl (B). Panels C and D: Syncytial blastoderm stage female embryos from mothers of the indicated genotype were stained using anti-Sxl antibody. Similar to pole buds, only gcl mutant pole cells show Sxl protein (D) as opposed to the control (C). Panels E–F’: To determine whether Gcl is sufficient to repress Sxl expression on its own, embryos derived from females carrying gcl-bcd 3’UTR transgene (F) were stained using anti-Sxl antibodies. WT embryos were used as a control (E). The gcl-bcd 3’UTR transgene consists of genomic sequences of the gcl coding region fused to the 3’UTR of the anterior determinant bcd, resulting in ectopic localization of gcl mRNA to the anterior pole. Anterior poles are oriented to the left in each image. Images on the right in the panels E’ and F’ show just the anterior pole from the same embryos. While Sxl-specific signal is strong and uniform in the control embryo, selective reduction in Sxl in the anterior is readily seen in the gcl-bcd 3’UTR embryo (marked with an asterisk).
Figure 3.
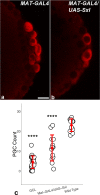
Figure 3.. Precocious expression of Sxl results in reduction in total number of primordial germ cells (PGCs).
Embryos of indicated genotypes were stained for pole cell marker Vasa (panels a and b; imaged in red) to discern the effects of precocious Sxl activity on the early PGCs. UAS-Sxl transgene males were mated with females carrying maternal-tubulin-GAL4 driver (panel b) to assess if precocious Sxl expression adversely influences early PGCs. mat-GAL4 (panel a) and gcl (not shown) embryos served as positive and negative controls, respectively. (c) Quantitation of PGC counts in different genetic backgrounds. The number of pole cells in embryos from mothers of indicated genotypes were counted and compared. Bars represent the mean ± S.D. (n = 23 for gcl, n = 14 for mat-GAL4/UAS-Sxl, n = 12 for mat-GAL4). ****p<0.0001 for gcl and mat-GAL4/UAS-Sxl compared to wild type (WT). Note that *p>0.01 for gcl compared to mat-GAL4/UAS-Sxl (not indicated in the graph).
Figure 4.
Figure 4.. Germ cell-specific expression of Sxl leads to germ cell migration defects during mid-embryogenesis.
Embryos from mothers of the indicated genotypes were stained for the germ cell marker Vasa. UAS-Sxl transgene males were mated with virgin females carrying the germline-specific driver nos-GAL4-VP16 to assess if precocious Sxl expression can influence PGC migration and survival (panels C–F). Embryos at stage 12 (A, C, E) and stage 13 (B, D, F) are shown as germ cell behavior defects become apparent from stage 12 onwards. UAS-Sxl/+ embryos served as control (A and B). Readily detectable germ cell migration defects were seen in the experimental embryos as opposed to the control. 3/21 UAS Sxl/+ control embryos showed >5 mispositioned PGCs as opposed to 9/17 nosGAL4-VP16/UAS-Sxl embryos; p=0.04 (significance determined using Welch’s two sample t-test).
Figure 5.
Figure 5.. Simultaneous removal of gcl and Sxl mitigates the gcl phenotype.
(A-B) 0–12 hr old embryos (from the cross 7BO/Y;gcl/gcl x7BO/Bin;gcl/gcl) were stained using anti-Sxl antibody and for the germline marker Vasa. 7BO is a small deficiency chromosome that specifically deletes the Sxl gene. Embryos that stained positive for Sxl were disregarded (n = 14) since only embryos lacking Sxl and gcl are relevant in this experiment. Male embryos of genotype Bin/Y; gcl/gcl (A) are compared with embryos believed to be of genotype 7BO/7BO; gcl/gcl or 7BO/Y; gcl/gcl(B). The number of pole cells in embryos from mothers of indicated genotypes were counted and plotted (C). Bars represent the mean ± SD (n = 23 for 7BO/7BO; gcl/gcl, n = 19 for 7BO/Y; gcl/gcl, n = 26 for Bin/Y; gcl/gcl). ****p<0.0001 for 7BO/7BO; gcl/gcl and 7BO/Y; gcl/gcl compared to Bin/Y; gcl/gcl. p=0.03 for 7BO/7BO; gcl/gcl compared to 7BO/Y; gcl/gcl. Significance was determined using Welch’s two sample t-test.
Figure 6.
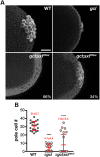
Figure 6.. Knockdown of Sxl partially suppresses germ cell loss of gcl embryos.
gcl;mat-GAL4 virgin females were mated with males carrying UAS-Sxl RNAi. Embryos derived from this cross were stained with anti-Vasa antibody to visualize PGCs (A). Scale bar represents 20 µm. Total number of PGCs were counted for each embryo from different genotypes, and a Mann–Whitney U-test was employed to analyze significant differences between wild type (WT), gcl, and gcl;SxlRNAi (B). In 66% of gcl;SxlRNAi embryos, few or no pole cells are observed, comparable to gcl. However, in 34% of gcl;SxlRNAi embryos, germ cell count is substantially elevated, indicating partial rescue of the gcl phenotype.
Figure 7.
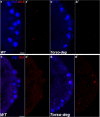
Figure 7.. Sexing embryos based on transcription puncta from X-chromosomes.
0–3 hr old wild-type (WT) embryos were probed for Sxl (green) and sis-b (red) transcription using smFISH, and these embryos were co-stained with Hoescht to visualize DNA. (A) Embryos with two X-chromosomes (females) show two transcription puncta for both sis-b and Sxl, corresponding to expression from each X. (B) XY embryos (males) transcribe sis-b from the only X chromosome and fail to activate expression of Sxl. (A and B) show merge; (A’ and B’) show smFISH signals. A representative section of somatic nuclei is shown in each panel. Scale bar represents 10 µm.
Figure 8.
Figure 8.. Rescue of PGCs in gcl;tsl embryos.
smFISH using Sxl probes was performed to assess the status of transcription in PBs of wild-type (WT) (A), gcl (B), and gcl;tsl (C) 0–3 hr old embryos. Posterior poles of representative blastoderm embryos are shown with Sxl RNA visualized in green and Hoescht DNA dye in blue. While 0% of control embryos display Sxl transcription in PBs, transcription of Sxl is detected in 67% buds of gcl embryos (indicated with a carrot in the representative embryo). In gcl;tsl embryos, however, 0% display any ectopic transcription (Table 3). n = 28, 23, and 24 for WT, gcl, and gcl;tsl embryos, respectively; by Fisher’s exact test, p=1e-06 and 1 for WT compared to gcl and gcl;tsl, respectively, and p=2e-06 for gcl compared to gcl;tsl. Scale bar represents 10 µm. (D) Pole cell counts from WT, gcl, and gcl;tsl embryos were counted using anti-Vasa staining (n = 17, 25, and 18, respectively). ***p<0.001 for the compared genotypes shown. Significance was determined using a one-Way ANOVA (p=0) with pairwise t-test comparisons (p=0 for WT vs. gcl, p=0.14 for WT vs. gcl;tsl, p=0 for gcl vs. gcl;tsl). These data suggest that rescue of the gcl PGC numbers is highly penetrant in gcl;tsl embryos.
Figure 9.
Figure 9.. Transcriptional quiescence in pole cells is compromised in torsoDeg embryos.
smFISH using probes specific for sis-b or Sxl in 0–3 hr old embryos was performed to assess the status of transcription in torsoDeg PBs. Posterior poles of representative pre-syncytial blastoderm embryos are shown with sis-b (a/b) or Sxl (c/d) RNA visualized in red and Hoescht DNA dye in blue. While 0% of control embryos display sis-b (a/a’, n = 16) or Sxl (c/c’, n = 18) transcription in PBs, transcription of both sis-b (b/b’) and Sxl (d/d’) is detected in buds of torsoDeg embryos. Note that transcription in wild-type (WT) embryos is only in somatic nuclei (a). We observed sis-b transcription in 27% (n = 15, p=0.043382) and Sxl transcription in 28% (n = 25, p=0.030307) of torsoDeg embryos. Scale bar represents 10 µm.
Figure 10.
Figure 10.. Sxl is expressed in the male soma in torsoDeg and MEK GOF embryos.
0–3 hr old embryos were probed for somatic Sxl transcription using smFISH. While 0% of control male embryos display Sxl expression in the soma (A and A', n = 10), all control females display uniform somatic Sxl expression (B and B', n = 17). However, we observed sporadic somatic Sxl activation in 43% (n = 14, p=0.023871) of torsoDeg (C and C') and 46% (n = 13, p=0.019079) of MEKE203K (D and D') male embryos. A representative section of somatic nuclei is shown in each panel (blue) with Sxl transcripts in red. Scale bar represents 10 µm.
Figure 11.
Figure 11.. Vasa is mislocalized from the posterior in gcl and torsoDeg embryos.
0–3 hr old paraformaldehyde-fixed embryos collected from wild-type (WT), gcl, or torsoDeg mothers were stained with anti-Vasa antibody to assess whether pole plasm is properly localized in gcl and torsoDeg embryos. On top, images are representative maximum intensity projections of the posterior pole of each indicated genotype. Scale bar represents 10 µm. Below, plot profiles show mislocalization of pole plasm (visualized using Vasa) away from posterior cap in gcl and torsoDeg embryos (see Materials and methods for details of quantification). Each plot shows a representative experiment, with each line depicting pole plasm distribution of an individual embryo. n = 12, 13, and 13 for WT, gcl, and torsoDeg, respectively.
Figure 12.
Figure 12.. gcl RNA is mislocalized from the posterior in torsoDeg embryos.
smFISH using probes specific for gcl was performed in 0–3 hr old embryos to assess whether pole plasm is properly localized in gcl and torsoDeg embryos. gcl embryos lack gcl RNA, as previously reported (Jongens et al., 1992). On top, images are representative maximum intensity projections of the posterior pole of each indicated genotype. Scale bar represents 10 µm. Below, plot profiles show mislocalization of pole plasm (visualized using gcl) away from posterior cap in torsoDeg embryos (see Materials and methods for details of quantification). Each plot shows a representative experiment, with each line depicting pole plasm distribution of an individual embryo. n = 11, 10, and 16 for wild type (WT), gcl, and torsoDeg, respectively.
Figure 13.
Figure 13.. pgc RNA is mislocalized from the posterior in gcl and torsoDeg embryos.
smFISH using probes specific for pgc was performed in 0–3 hr old embryos to assess whether pole plasm is properly localized in gcl and torsoDeg embryos. On top, images are representative maximum intensity projections of the posterior pole of each indicated genotype. Scale bar represents 10 µm. Below, plot profiles show mislocalization of pole plasm (visualized using pgc) away from posterior cap in gcl and torsoDeg embryos (see Materials and methods for details of quantification). Each plot shows a representative experiment, with each line depicting pole plasm distribution of an individual embryo. n = 10, 14, and 14 for wild type (WT), gcl, and torsoDeg, respectively.
Figure 14.
Figure 14.. nos RNA is mislocalized from the posterior in gcl and torsoDeg embryos.
smFISH using probes specific for nos was performed in 0–3 hr old embryos to assess whether pole plasm is properly localized in gcl and torsoDeg embryos. On top, images are representative maximum intensity projections of the posterior pole of each indicated genotype. Scale bar represents 10 µm. Below plot profiles show mislocalization of pole plasm (visualized using nos) away from posterior cap in gcl and torsoDeg embryos (see Materials and methods for details of quantification). Each plot shows a representative experiment, with each line depicting pole plasm distribution of an individual embryo. n = 4, 6, and 6 for wild type (WT), gcl, and torsoDeg, respectively.
Figure 15.
Figure 15.. Before pole buds develop, pole plasm distribution is unaltered in gcl and torsoDeg embryos.
smFISH using probes specific for pgc or gcl was performed in 0–3 hr old embryos to assess whether pole plasm is properly localized in young gcl and torsoDeg embryos. Images are representative maximum intensity projections of the posterior pole of each indicated genotype. Scale bar represents 10 µm. Below, plot profiles show proper anchoring and localization of pole plasm (visualized using pgc or gcl) at the posterior cap in gcl and torsoDeg embryos (see Materials and methods for details of quantification). Each plot shows a representative experiment, with each line depicting pole plasm distribution of an individual embryo. For the pgc smFISH experiment, n = 9, 7, and 7 for wild type (WT), gcl, and torsoDeg, respectively. For the gcl smFISH experiment, n = 14, 9, and 8 for WT, gcl, and torsoDeg, respectively.
Figure 16.
Figure 16.. MEK gain of function embryos also display defects in pole plasm localization.
smFISH using probes specific for pgc or gcl was performed in 0–3 hr old embryos to assess whether pole plasm is properly localized in embryos collected from mothers expressing MEKE203K or MEKF53S driven by mat-GAL4. On top, images are representative maximum intensity projections of pgc RNA localization at the posterior pole of each indicated genotype. Scale bar represents 10 µm. Below, plot profiles show mislocalization of pole plasm (visualized using either pgc or gcl) away from posterior cap in embryos expressing one of two MEK gain of function transgenes (E203K and F53S) (see Materials and methods for details of quantification). Each plot shows a representative experiment, with each line depicting pole plasm distribution of an individual embryo. n = 15, 19, and 9 for wild type (WT), MEKE203K, and MEKF53S, respectively.

References

    1. Ali-Murthy Z, Lott SE, Eisen MB, Kornberg TB. An essential role for zygotic expression in the pre-cellular Drosophila embryo. PLOS Genetics. 2013;9:e1003428. doi: 10.1371/journal.pgen.1003428. - DOI - PMC - PubMed
    1. Ambrosio L, Mahowald AP, Perrimon N. Requirement of the Drosophila raf homologue for torso function. Nature. 1989;342:288–291. doi: 10.1038/342288a0. - DOI - PubMed
    1. Asaoka M, Hanyu-Nakamura K, Nakamura A, Kobayashi S. Maternal Nanos inhibits Importin-α2/Pendulin-dependent nuclear import to prevent somatic gene expression in the Drosophila germline. PLOS Genetics. 2019;15:e1008090. doi: 10.1371/journal.pgen.1008090. - DOI - PMC - PubMed
    1. Blythe SA, Wieschaus EF. Coordinating cell cycle remodeling with transcriptional activation at the Drosophila MBT. Current Topics in Developmental Biology. 2015;113:113–148. doi: 10.1016/bs.ctdb.2015.06.002. - DOI - PubMed
    1. Casanova J, Struhl G. Localized surface activity of torso, a receptor tyrosine kinase, specifies terminal body pattern in Drosophila. Genes & Development. 1989;3:2025–2038. doi: 10.1101/gad.3.12b.2025. - DOI - PubMed

Publication types

MeSH terms

Substances

LinkOut - more resources