Review
. 2021 Mar;207(2):191-204.
doi: 10.1007/s00359-020-01458-y. Epub 2021 Jan 18.

Measuring strain in the exoskeleton of spiders-virtues and caveats

Affiliations
Review

Measuring strain in the exoskeleton of spiders-virtues and caveats

Reinhard Blickhan et al. J Comp Physiol A Neuroethol Sens Neural Behav Physiol. 2021 Mar.

Abstract

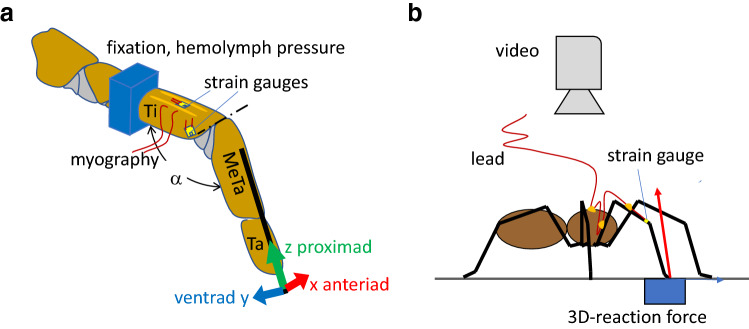
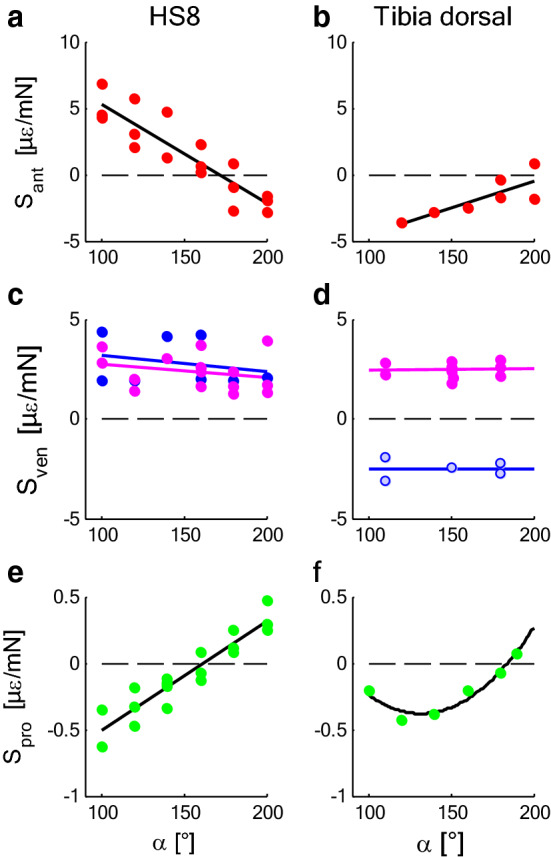
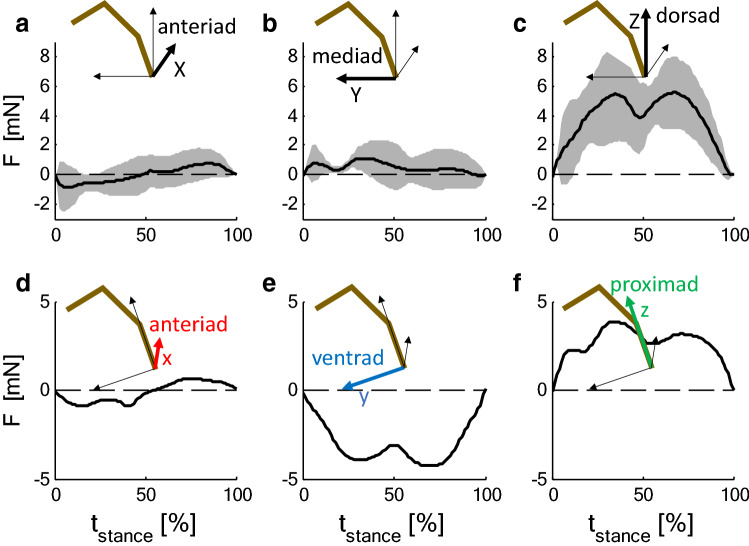
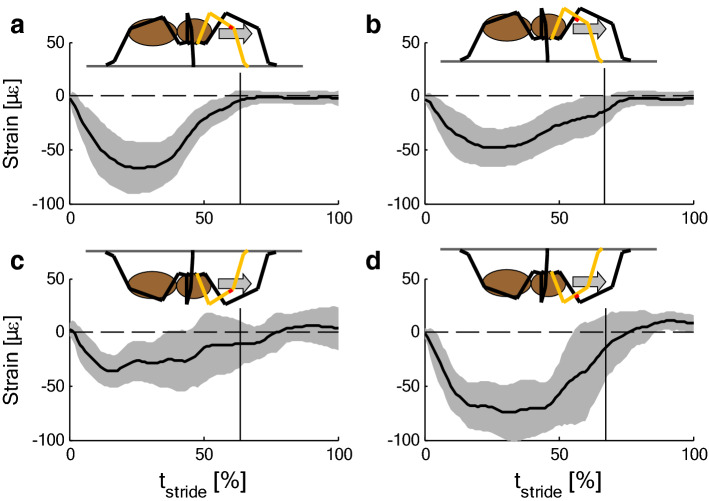
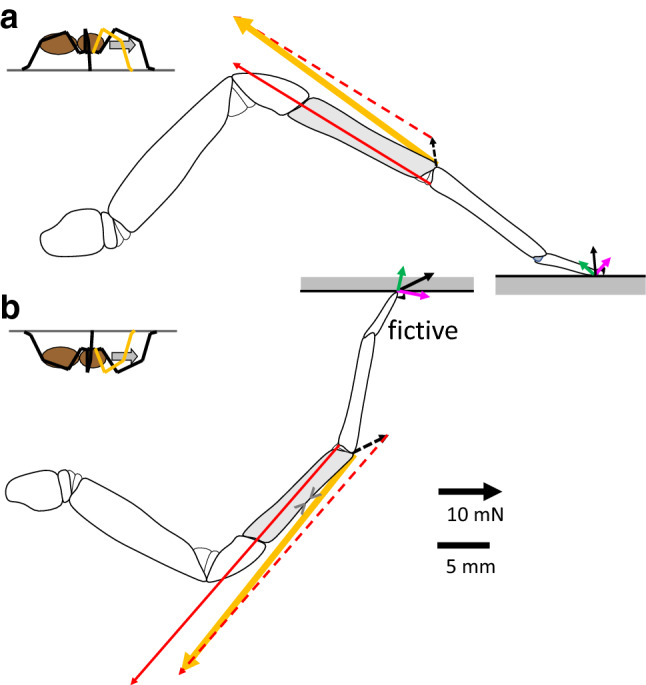
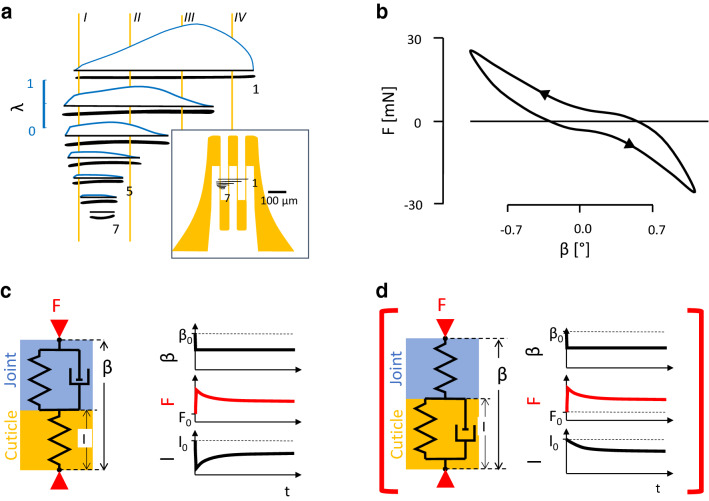
The measurement of cuticular strain during locomotion using foil strain gauges provides information both on the loads of the exoskeleton bears and the adaptive value of the specific location of natural strain detectors (slit sense organs). Here, we critically review available literature. In tethered animals, by applying loads to the metatarsus tip, strain and mechanical sensitivity (S = strain/load) induced at various sites in the tibia were determined. The loci of the lyriform organs close to the tibia-metatarsus joint did not stand out by high strain. The strains induced at various sites during free locomotion can be interpreted based on S and, beyond the joint region, on beam theory. Spiders avoided laterad loading of the tibia-metatarsus joint during slow locomotion. Balancing body weight, joint flexors caused compressive strain at the posterior and dorsal tibia. While climbing upside down strain measurements indicate strong flexor activity. In future studies, a precise calculation and quantitative determination of strain at the sites of the lyriform organs will profit from more detailed data on the overall strain distribution, morphology, and material properties. The values and caveats of the strain gauge technology, the only one applicable to freely moving spiders, are discussed.

Keywords: Joint load; Locomotion; Mechanical sensitivity; Sensory strain reception; Strain gauge.


Conflict of interest statement

No conflicts of interest.

Figures

Fig. 1
Fig. 1
Setup of a tethered tarantula and b freely walking spiders. a Spiders were secured with tape on a brass holder; their second leg fixed with dental cement. At this site, the pressure at the dorsal hemolymph channel was registered. Trimmed strain gauges were affixed with cyanoacrylate. Here, we focus on two sites of gauge application: (1) the dorsal tibia and (2) the site of the lyriform organ HS8. Activity of the flexor M. met. bilobatus was registered. Using a needle fixed with beeswax to the metatarsus, the leg tip was deflected electromagnetically in three orthogonal directions. A custom-built force transducer allowed the registration of the force required to achieve the deflections. While moving the leg tip in the different directions against joint stiffness, the reaction force points in the same direction. However, flexion induced by muscles generates a dorsad, extension generated by hydraulic pressure a ventrad reaction force. α: dorso-ventral angle of the tibia–metatarsus joint; dash-dotted line: dorsal axis of the hinge joint. Ti tibia, MeTa metatarsus, Ta tarsus. Anteriad (x), ventrad (y), proximad (z) form a right-handed system of co-ordinates. b A strain gauge was bonded to the specified site at the tibia of the spider’s leg. Slack leads were guided across the leg to the prosoma and to a holder. In some cases, ground reaction force was measured in 3D with a custom-built force plate and kinematics registered with a video camera supported by mirrors (e.g., Barth 2002)
Fig. 2
Fig. 2
Mechanical sensitivity S in dependence of the joint angle α (s. Fig.1) at the site of the lyriform organ HS8 (left) and the dorsal tibia (right) of tarantulas. a, b Anteriad load, x (red). c, d Dorsad load, y—muscle force (magenta), ventrad load—hemolymph pressure (blue; light blue in d values with low force/pressure ratios). e, f Proximad load, z (green). Compression: S < 0 if load > 0, e.g., anteriad/ventrad/proximad load; compression: S > 0 if load < 0, e.g., posteriad/dorsad/distad load. a, c, e N = 3; b, d, f N = 1. Regressions for mechanical sensitivity S [µε/mN] (α [°]): a Sant = 12.77–7.44E−2 × α; b Sant = − 8.45 + 3.98E−2 × α; c Sven = 4.02–8.14E−3 × α (n.s.); Sdor = 3.35–6.33E−3 × α (n.s.); d see text, Sven = 2.33 + 7.61E−4 × α (n.s.); Sdor = − 2.53 + 1.95E−4 × α (n.s.); e Spro = − 1.33 + 8.22E−3 × α; f Spro = 2.03–3.66E−2 × α + 1.39E−4 × α2; (tarantula; data: Blickhan and Barth 1985). Note the different scales
Fig. 3
Fig. 3
Time courses of the ground reaction force components F at the second leg during slow locomotion (10 cm/s) of Cupiennius salei. Forces ± SD (shaded; N = 4; n > 18) are normalized to a body mass of 3 g. ac Components (X anteriad, Y mediad, Z dorsad) with respect to body orientation (global system; X, Y, Z). The reaction force has only minor anteriad and mediad components. df Components as calculated for a co-ordinate system (x anteriad, y ventrad, z proximad) with the z-axis parallel to the metatarsus and the y-axis within in the plain of the tibia–metatarsus joint (local system). Whereas the anteriad component is small due to the oblique position of the metatarsus, there is a considerable negative ventrad component which must be balanced by flexor activity at the tibia–metatarsus joint (Data: Brüssel ; Barth 2002)
Fig. 4
Fig. 4
Strain (mean ± SD) during slow locomotion (5 cm/s) of Cupiennius salei. a, b Upside up (upright). c, d Upside down. Measurement sites: posterior distal tibia parallel the tibia axis (a, c), dorsal mid-tibia along the tibia axis (b, d). (a N = 4, n > 23; b N = 4, n > 17; c, d N = 3, n > 14). Data: Brüssel . In inverted climbing, the footfall pattern and the strain varies strongly. Vertical lines indicate end of stance phase
Fig. 5
Fig. 5
Loading of the tibia–metatarsus joint of the hunting spider Cupiennius salei a as reconstructed from the measurements of the ground reaction forces during slow locomotion (10 m/s; midstance; Fig. 4) upside up (upright) at level ground and b upside down with forces as assumed (fictive) to be necessary to generate compression at the dorsal tibia (>< ; Fig. 5). Forces: black—resultant vector of the ground reaction force (GRF); green: proximad component of GRF (in b negative, i.e., distad); magenta—dorsad component of GRF; red—muscle force (Fl. met. longus and Fl. met. acc.); yellow—resulting joint force. Dashed: vectors defining the resultant joint load (inertia and weight of the distal segment neglected); dashed black: resultant ground reaction force; dashed red: muscle force. Strain calculated based on ground reaction force and geometry: − 23.4 µε. For details see "Appendix 5", Eqs. (5, 6). b Calculated strain: − 22 µε
Fig. 6
Fig. 6
Factors affecting the strain registration and their impact in different setups. a Integration of deformation: a strain gauge covering the lyriform organ HS8 (right inset to scale) registers the sum of the slit deformation remaining after the attachment of the gauge divided by wire length. The inset depicts the selected strain gauge (yellow) covering the lyriform organ (black: lyriform organ HS8, 1. 7: slit numbers; to scale). In the main figure, the vertical distance between the slits (bold black horizontal lines) is expanded. Yellow vertical lines I…IV: wires of the gauge (comp. inset). Blue curves: deformation of the slits (λ) obtained by FEM and interferometry (λ = deformation of slit/(6.57 × 10–4 × length of slit) [m]; for details, see Hößl et al. ; Schaber et al. 2012). b Joint stiffness during cyclic triangular anteroposteriad deflection (upper arrow) at the metatarsus tip (tarantula; leg angle α = 160°, Fig. 1). F force; β deflection (anteriad: β > 0, for orientation see Fig. 1; 1 mm ≡ 3.5°; rate 0.1°/s; see material and methods). c, d Delineating visco-elastic properties using a standard linear solid. Viscosities can be found both at the joint (see b) and in the cuticle and the strain gauge. The examples describe extreme situations to identify the dominating viscosities. c The quick step deflection β at the leg tip causes an immediate rise in force. It compresses the cuticle spring (l) as the viscous element is rigid. While maintaining the deflection, the viscous element at the joint gives in. The two springs in series now in effect are less stiff than each single spring and the force drops. Correspondingly, the initial compression of the cuticle spring is reduced. This is the behavior observed in our measurements. d Alternative: the initial deflection compresses the joint and viscosities in the cuticle hamper its initial deformation. The joint is slowly compressed, while the external deflection is maintained. This is not observed (red brackets). β0, F0, l0: starting values

References

    1. Autumn K, Hsieh ST, Dudek DM, Chen J, Chitaphan C, Full RJ. Dynamics of geckos running vertically. J Exp Biol. 2006;209(2):260–272. doi: 10.1242/jeb.01980. - DOI - PubMed
    1. Barth F (eds) (2012) Learning from animal sensors: the clever “design” of spider mechanoreceptors. In: Bioinspiration, biomimetics, and bioreplication, vol 833904, SPIE, San Diego. 10.1117/12.902456
    1. Barth FG. A spider’s world: senses and behavior. Berlin: Springer; 2002.
    1. Barth FG. Mechanics to pre-process information for the fine tuning of mechanoreceptors. J Comp Physiol A. 2019;205(5):661–686. doi: 10.1007/s00359-019-01355-z. - DOI - PMC - PubMed
    1. Barth FG. A spider in motion: facets of sensory guidance. J Comp Physiol A. 2020 doi: 10.1007/s00359-020-01449-z. - DOI - PMC - PubMed

Publication types

LinkOut - more resources