

Open-tubular nanoelectrochromatography (OT-NEC): gel-free separation of single stranded DNAs (ssDNAs) in thermoplastic nanochannels
- PMID: 33460211
- PMCID: PMC8107830
- DOI: 10.1002/elps.202000109
Open-tubular nanoelectrochromatography (OT-NEC): gel-free separation of single stranded DNAs (ssDNAs) in thermoplastic nanochannels
Abstract
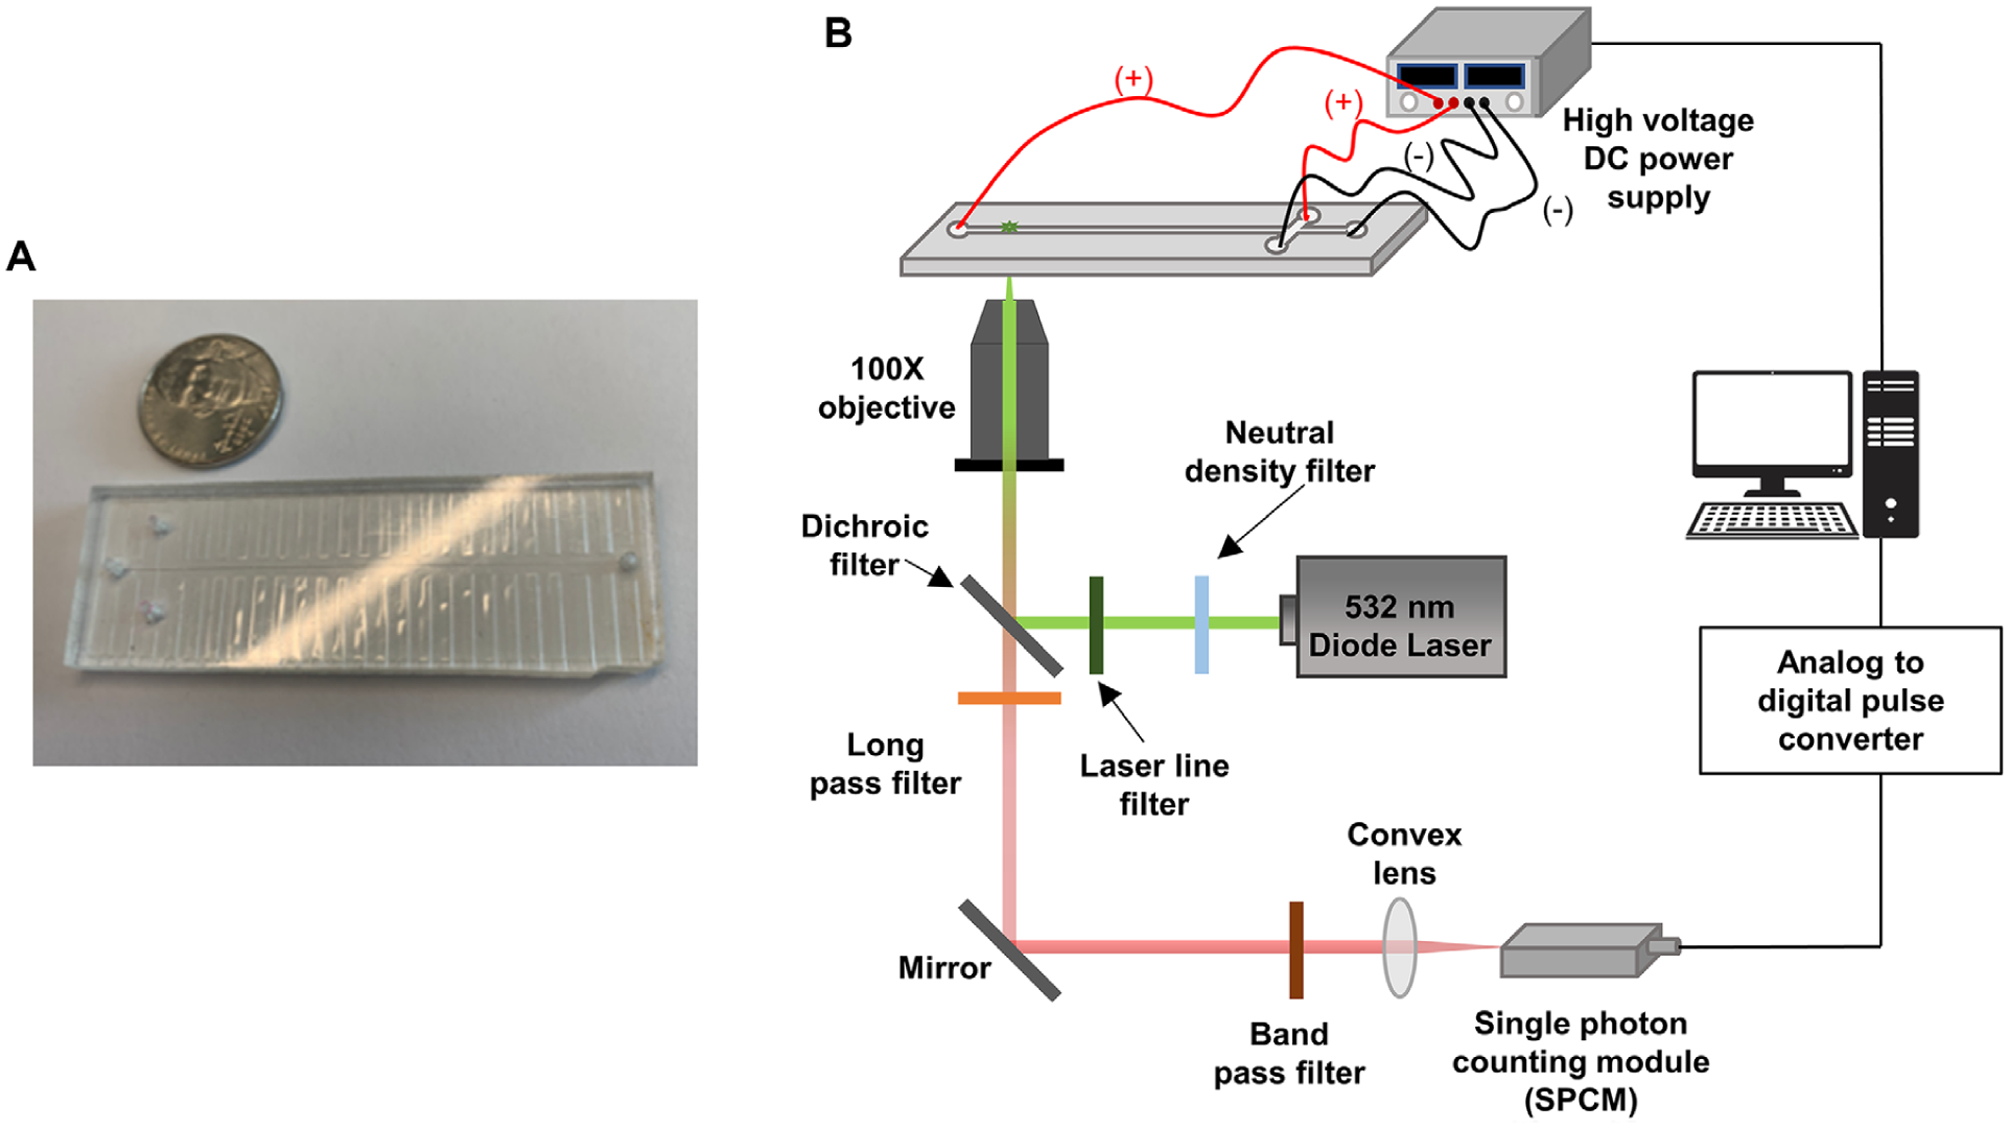
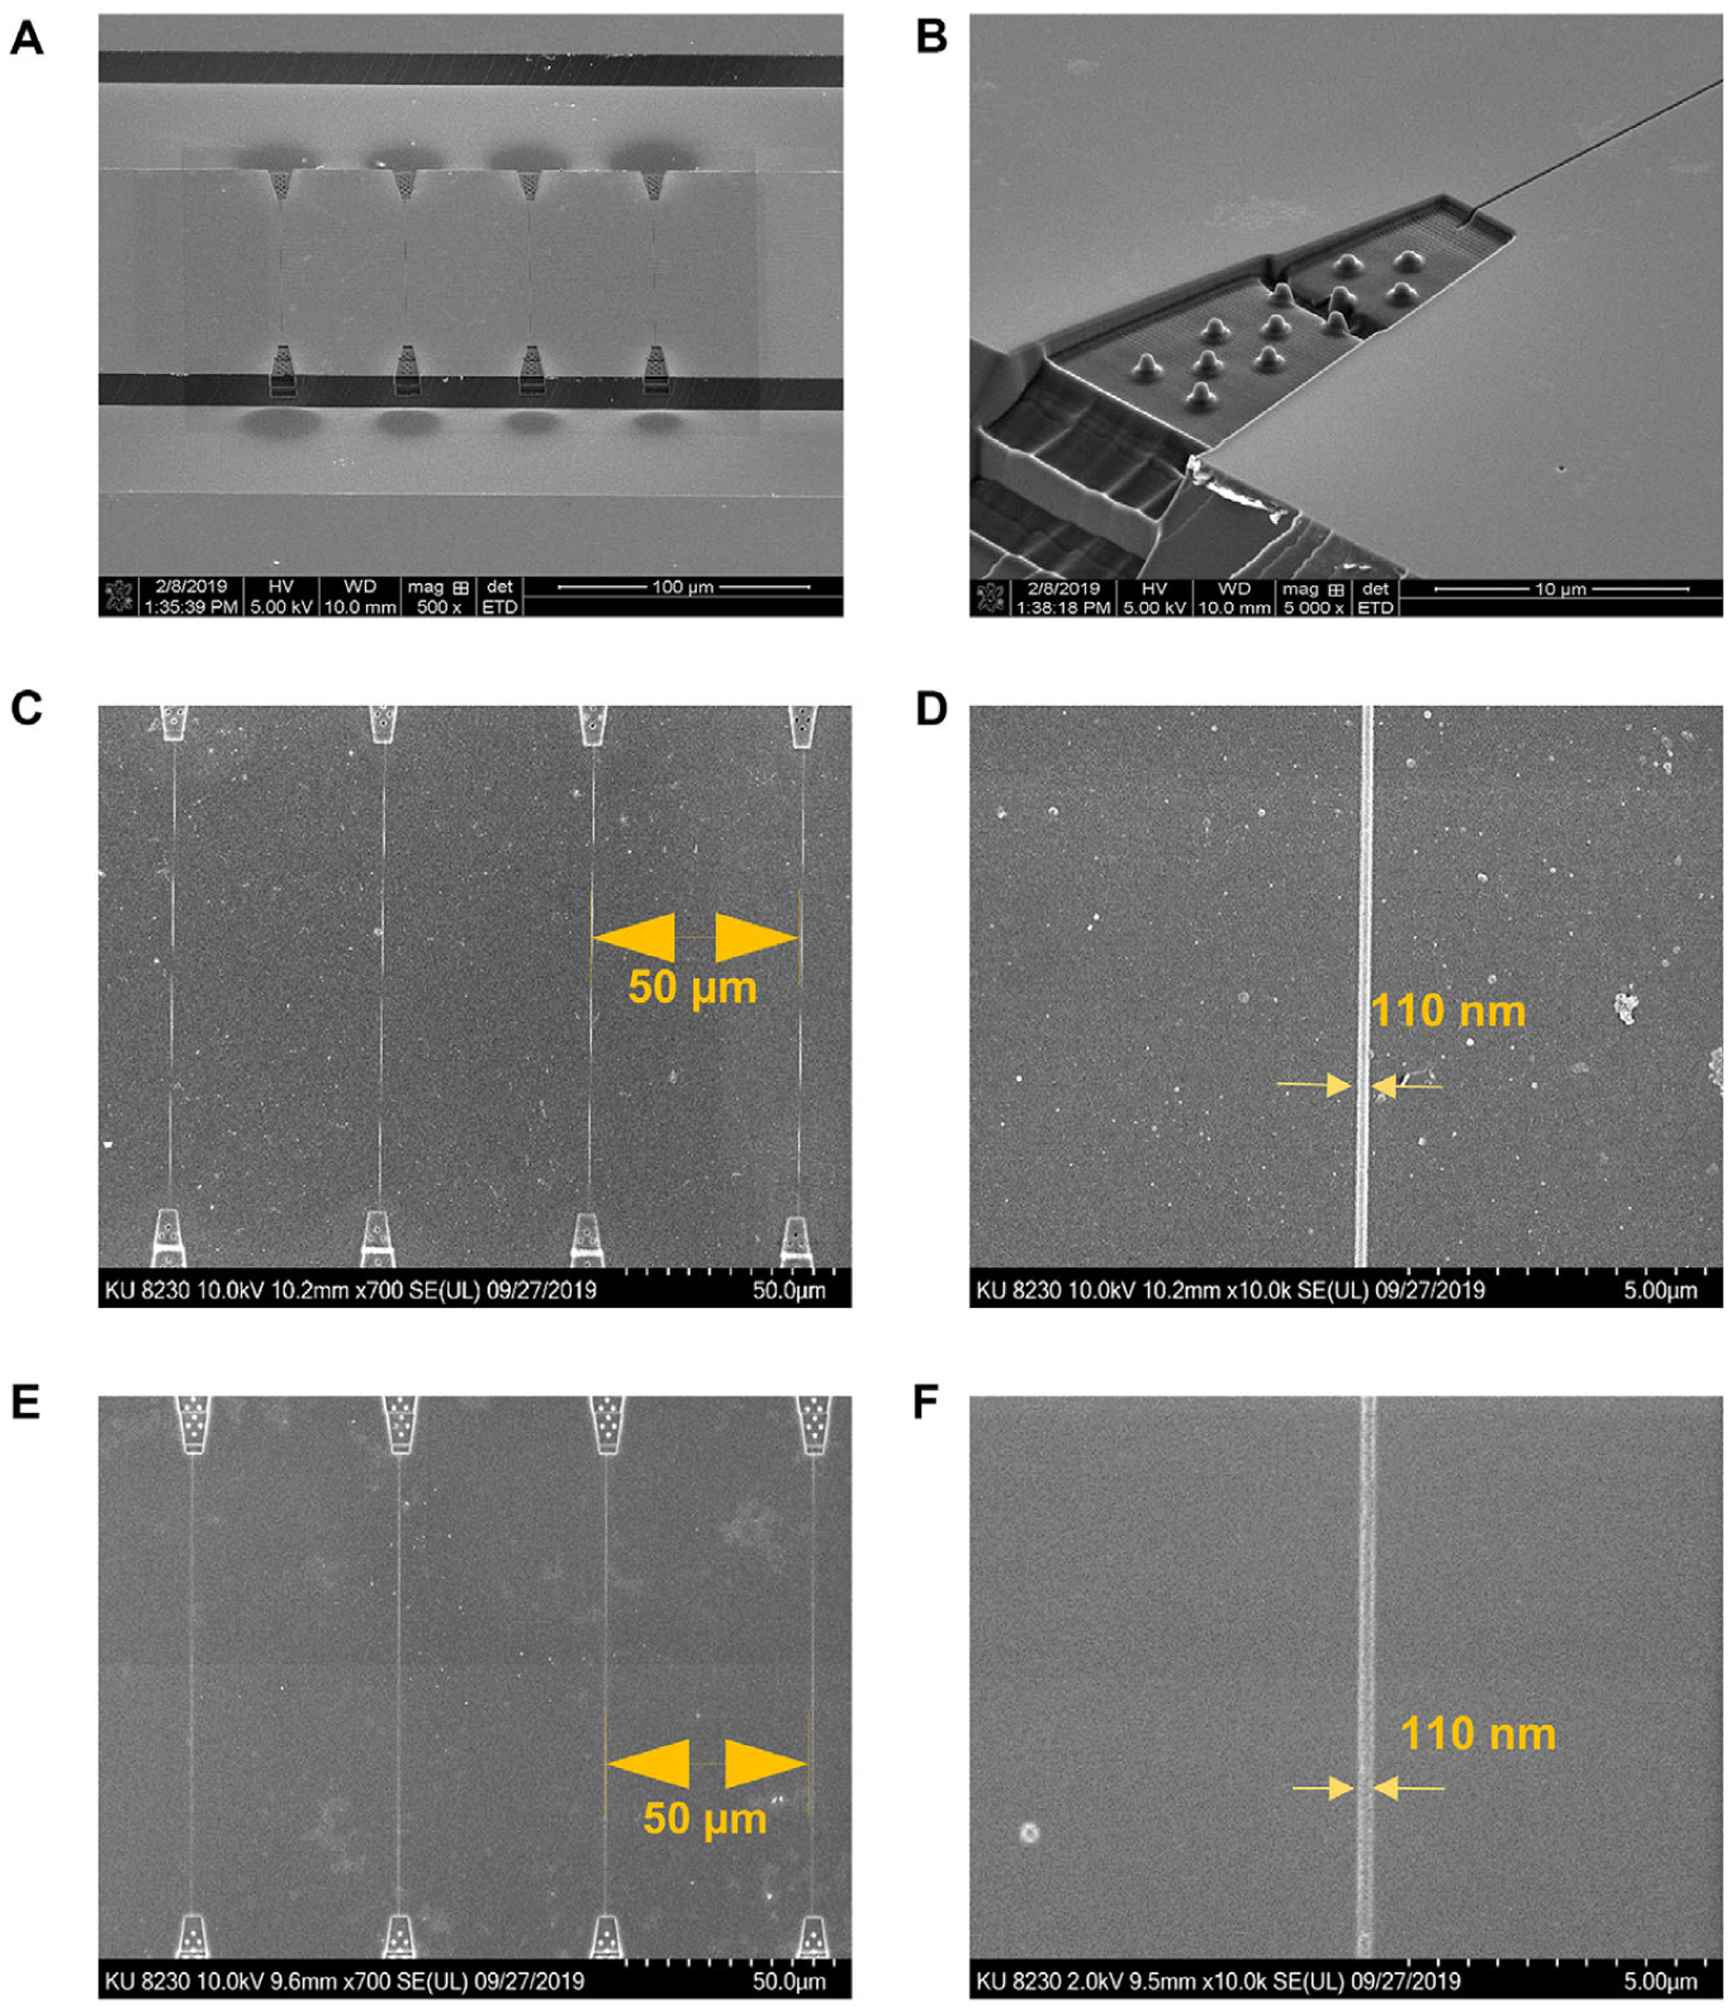
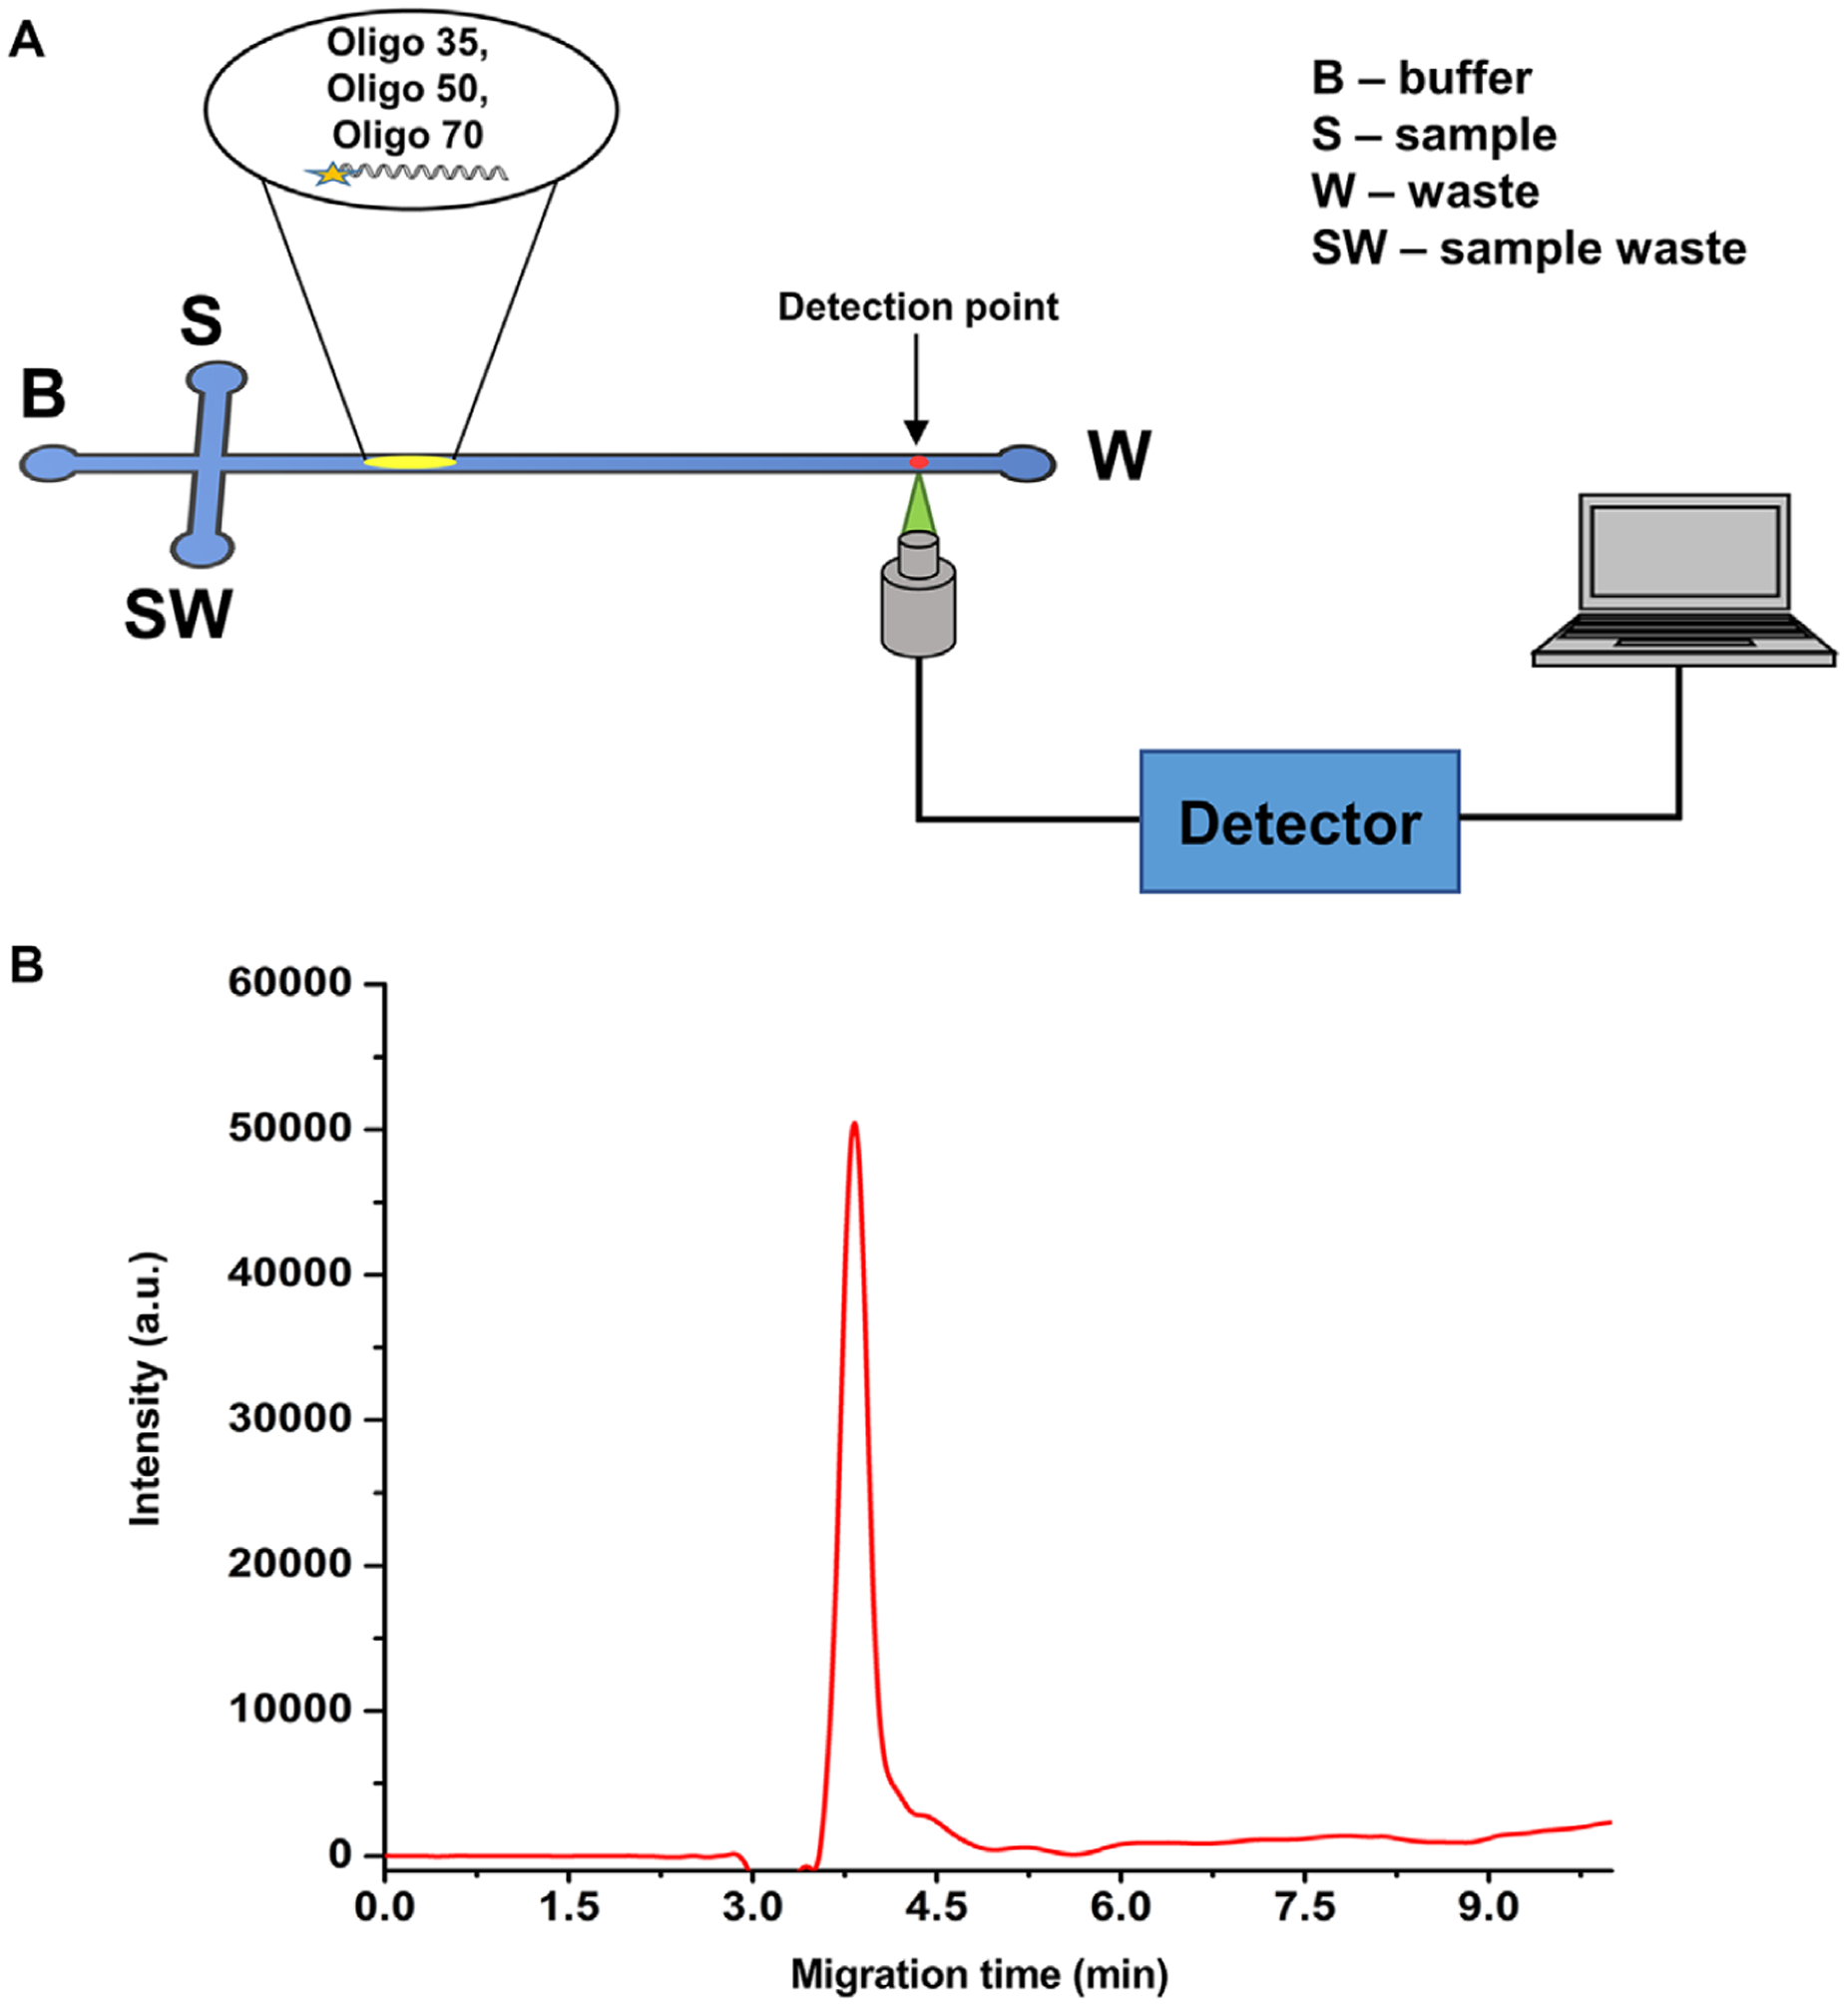
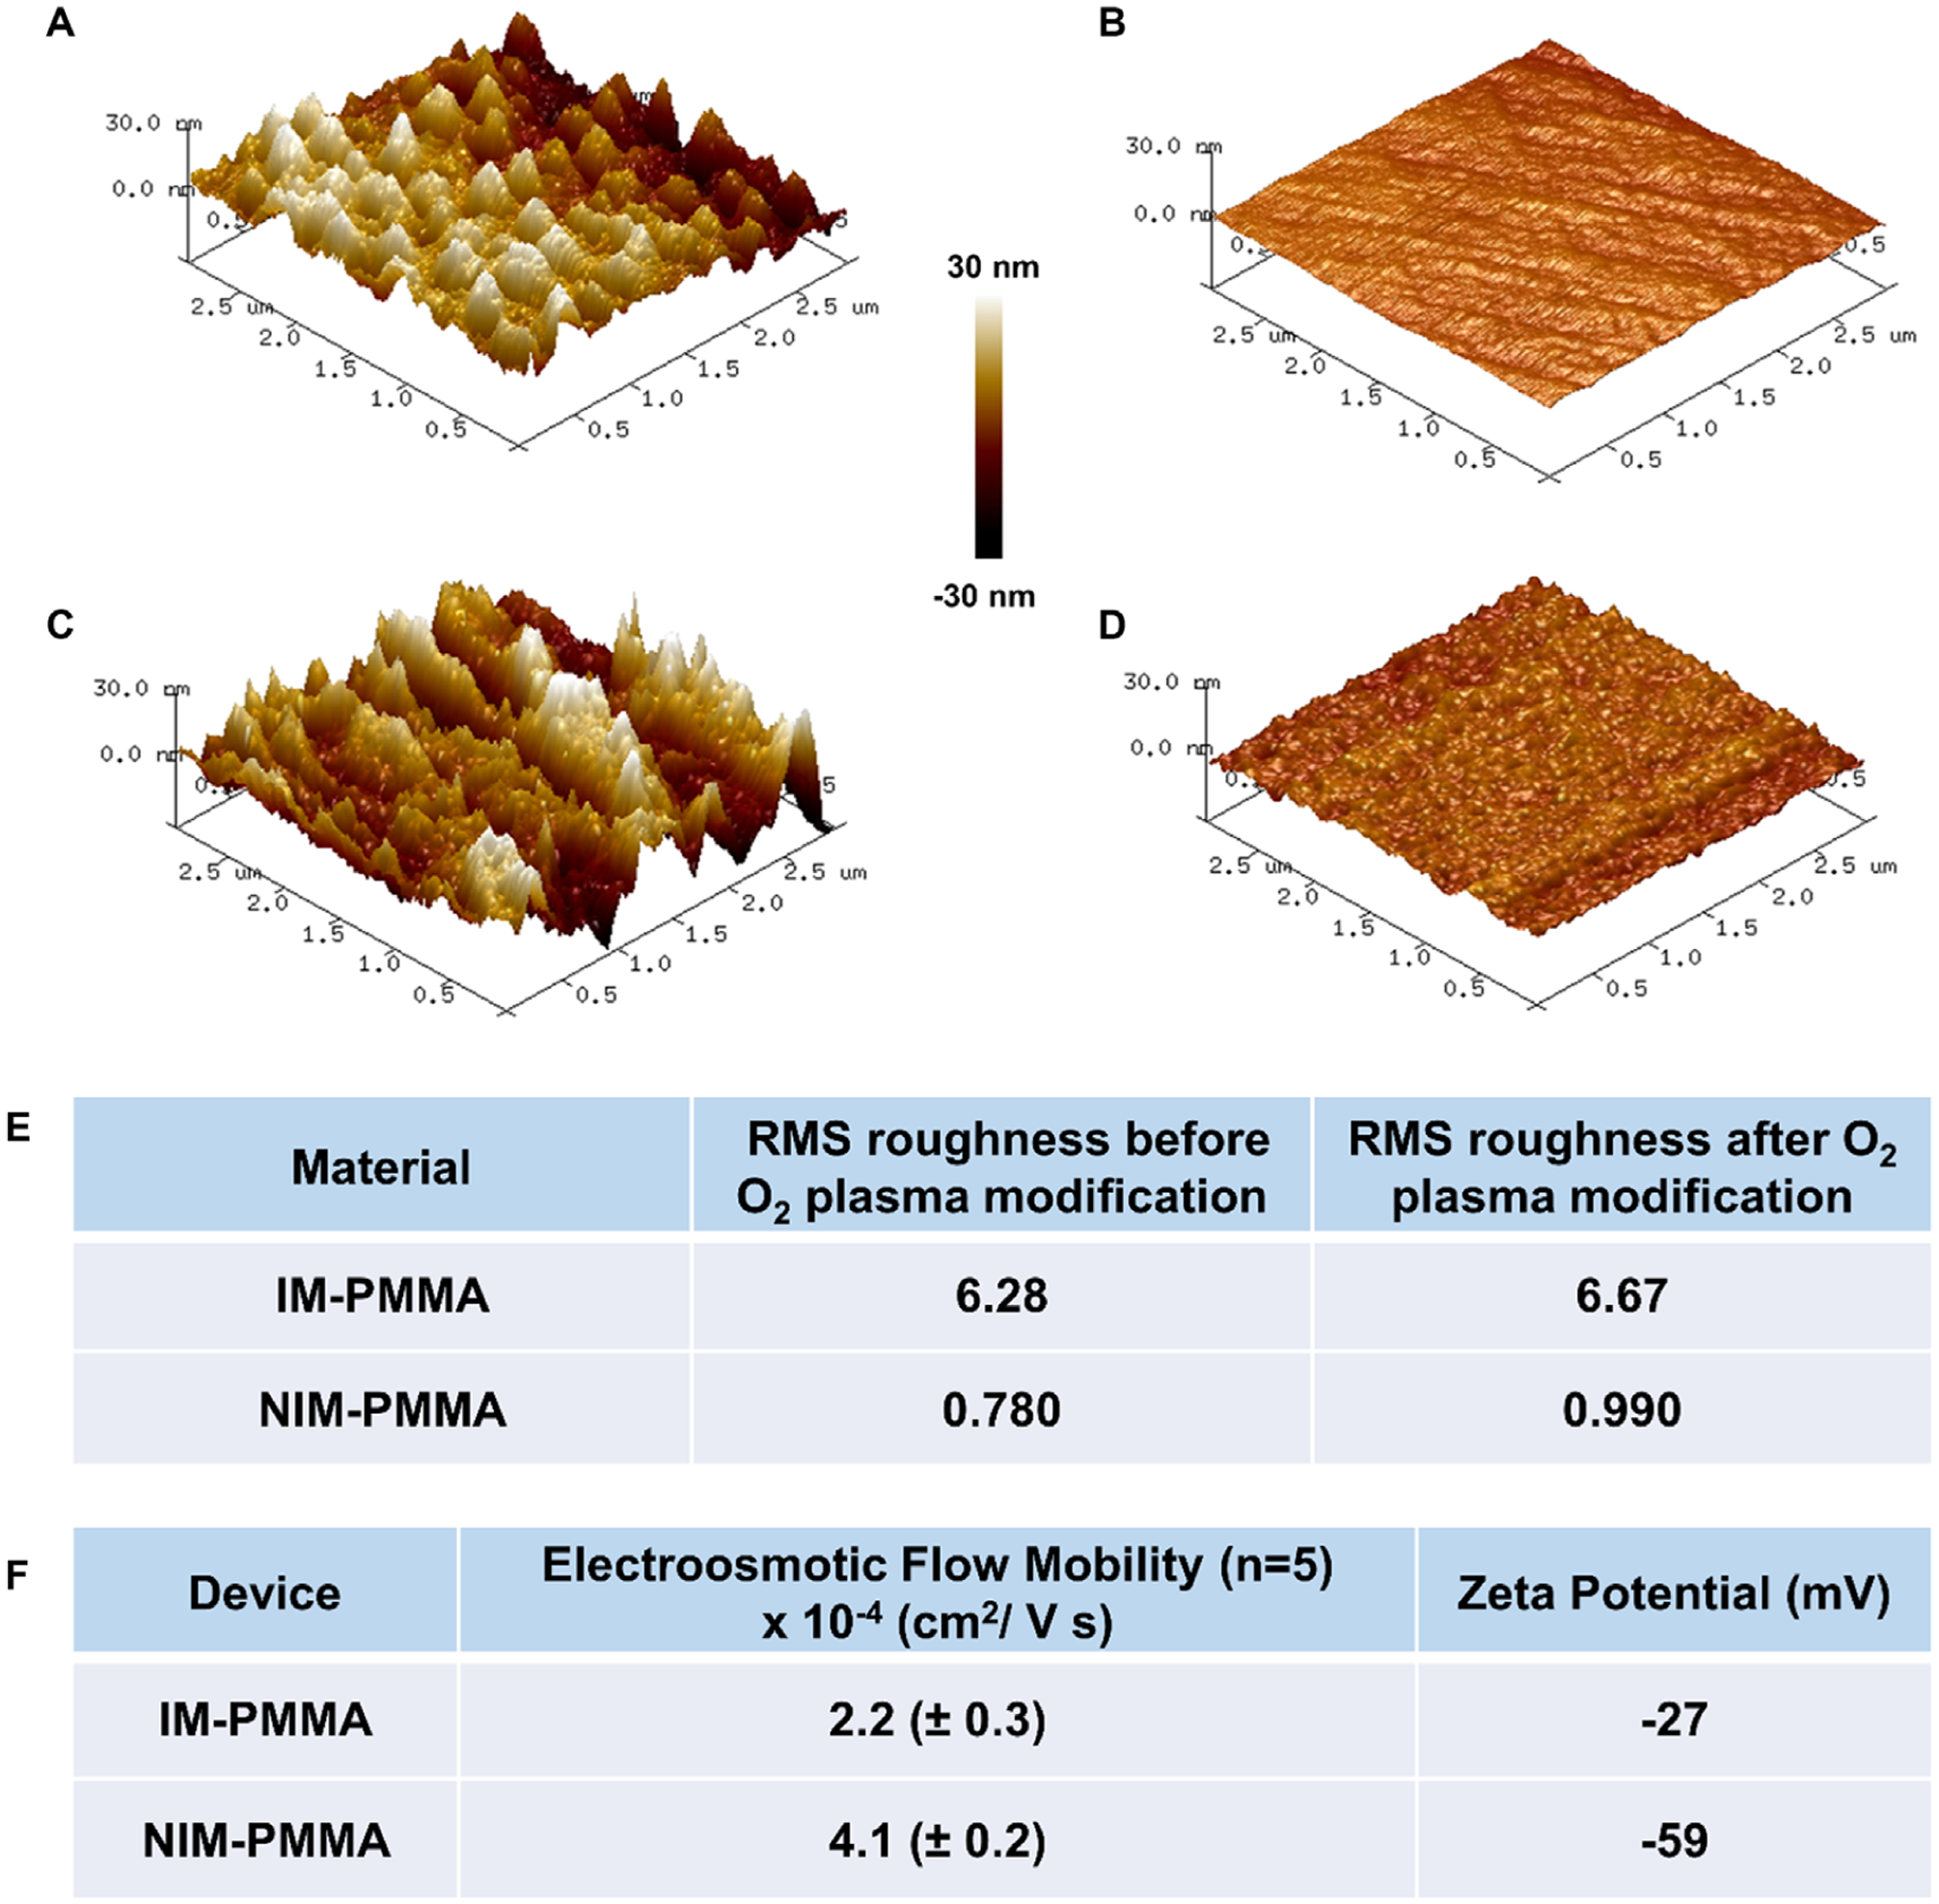
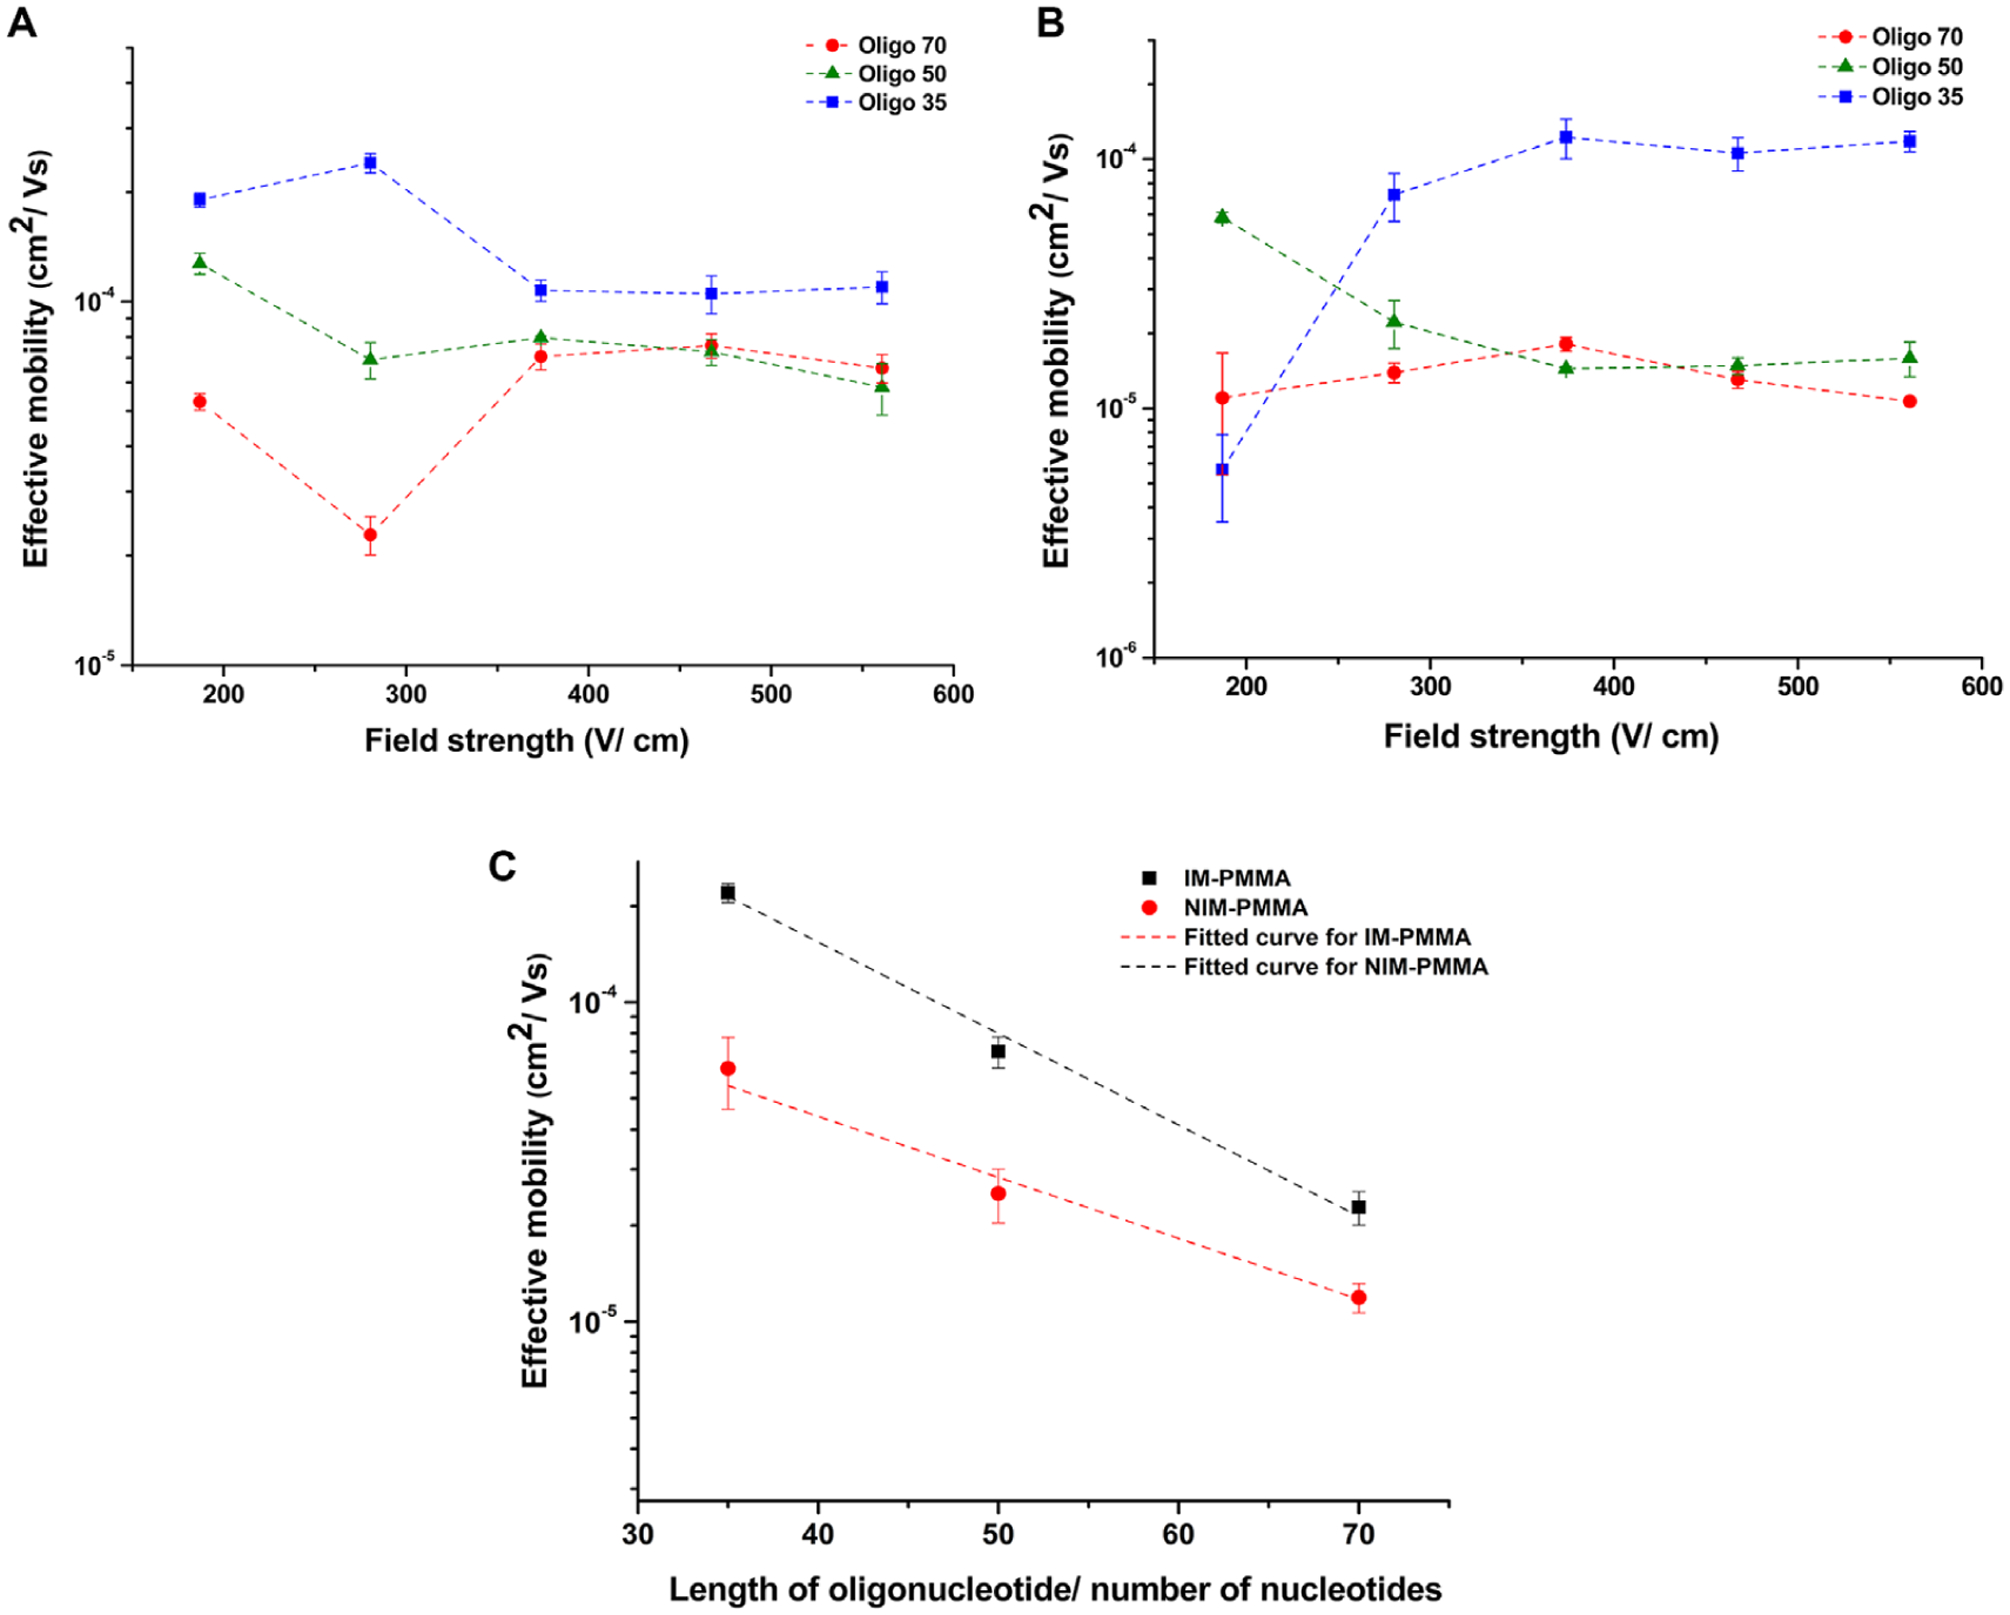
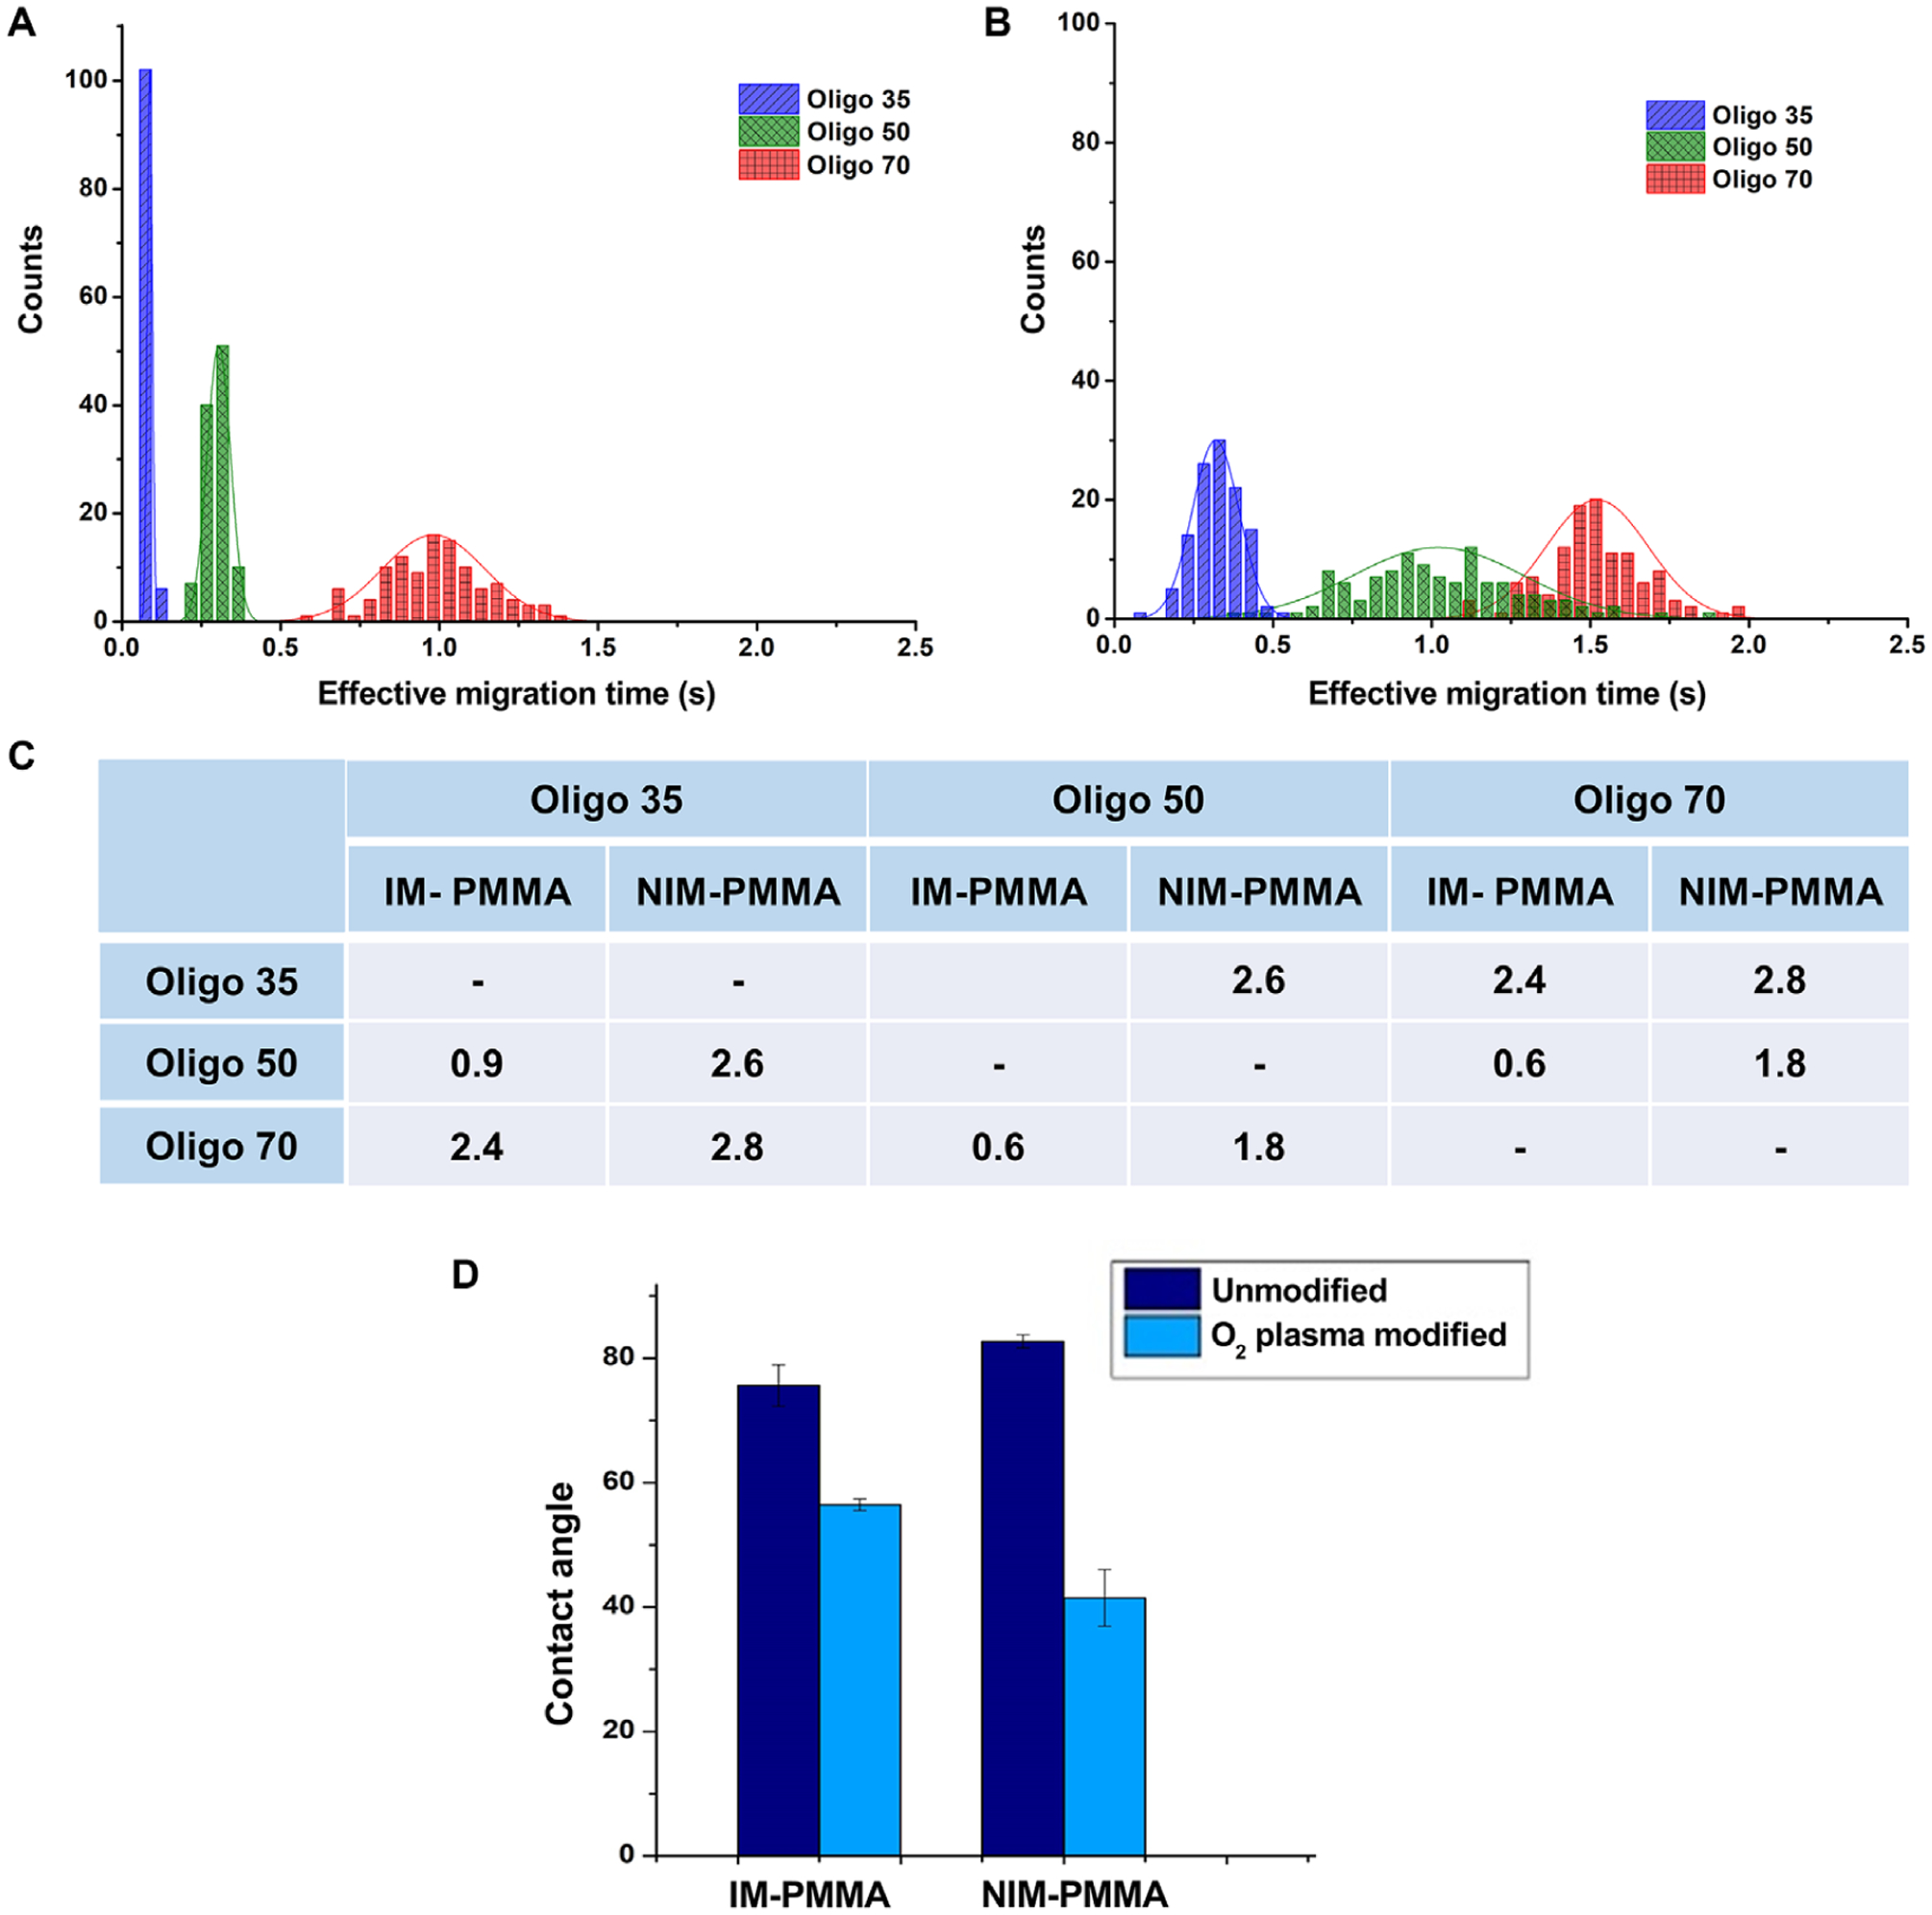
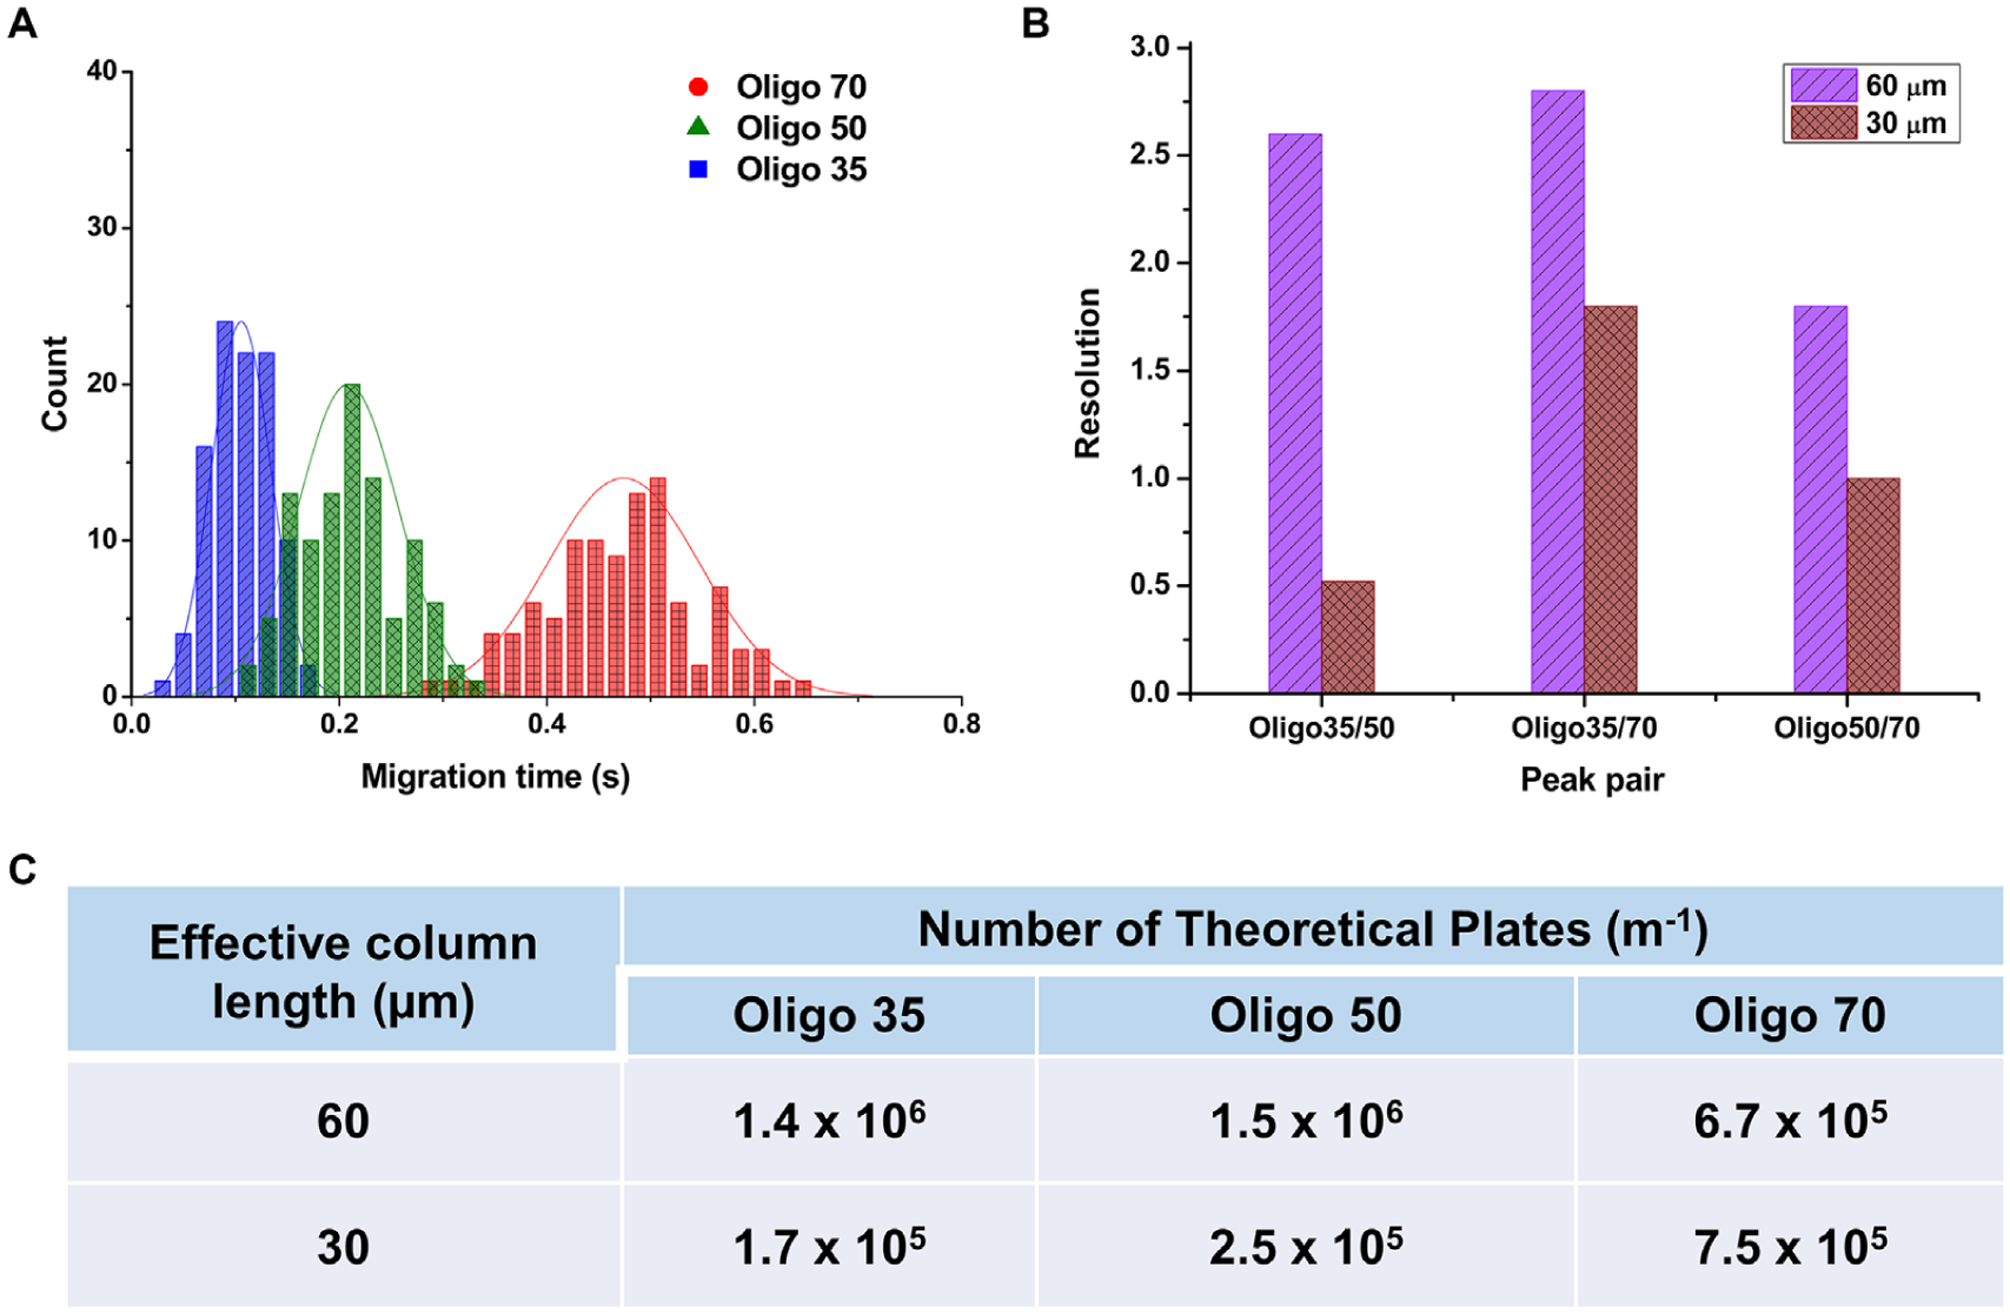
Electrophoresis or electrochromatography carried out in nanometer columns (width and depth) offers some attractive benefits compared to microscale columns. These advantages include unique separation mechanisms that are scale dependent, fast separation times, and simpler workflow due to the lack of a need for column packing and/or wall coatings to create a stationary phase. We report the use of thermoplastics, in this case PMMA, as the substrate for separating single-stranded DNAs (ssDNAs). Electrophoresis nanochannels were created in PMMA using nanoimprint lithography (NIL), which can produce devices at lower cost and in a higher production mode compared to the fabrication techniques required for glass devices. The nanochannel column in PMMA was successful in separating ssDNAs in free solution that was not possible using microchip electrophoresis in PMMA. The separation could be performed in <1 s with resolution >1.5 when carried out using at an electric field strength of 280 V/cm and an effective column length of 60 μm (100 nm × 100 nm, depth and width). The ssDNAs transport through the PMMA column was driven electrokinetically under the influence of an EOF. The results indicated that the separation was dominated by chromatographic effects using an open tubular nano-electrochromatography (OT-NEC) mode of separation. Interesting to these separations was that no column packing was required nor a wall coating to create the stationary phase; the separation was affected using the native polymer that was UV/O3 activated and an aqueous buffer mobile phase.
Keywords: DNA; Electrochromatography; Nanofluidics; Thermoplastics.
© 2020 Wiley‐VCH GmbH.
Conflict of interest statement
The authors have declared no conflict of interest.
Figures
Similar articles
-
Electrokinetic identification of ribonucleotide monophosphates (rNMPs) using thermoplastic nanochannels.J Chromatogr A. 2021 Feb 8;1638:461892. doi: 10.1016/j.chroma.2021.461892. Epub 2021 Jan 8. J Chromatogr A. 2021. PMID: 33477027 Free PMC article.
-
Metal-organic framework polymethyl methacrylate composites for open-tubular capillary electrochromatography.J Chromatogr A. 2013 Nov 5;1316:97-103. doi: 10.1016/j.chroma.2013.09.081. Epub 2013 Oct 2. J Chromatogr A. 2013. PMID: 24119756
-
Underivatized cyclic olefin copolymer as substrate material and stationary phase for capillary and microchip electrochromatography.Electrophoresis. 2008 Aug;29(15):3145-52. doi: 10.1002/elps.200800131. Electrophoresis. 2008. PMID: 18618461
-
Advances in sol-gel based columns for capillary electrochromatography: sol-gel open-tubular columns.Electrophoresis. 2002 Nov;23(22-23):3973-92. doi: 10.1002/elps.200290013. Electrophoresis. 2002. PMID: 12481288 Review.
-
Fabrication of nanofluidic biochips with nanochannels for applications in DNA analysis.Small. 2012 Sep 24;8(18):2787-801. doi: 10.1002/smll.201200240. Epub 2012 Jul 9. Small. 2012. PMID: 22778064 Review.
Cited by
-
Fluidic operation of a polymer-based nanosensor chip for analysing single molecules.Flow (Camb). 2022;2:E14. doi: 10.1017/flo.2022.8. Epub 2022 Jun 27. Flow (Camb). 2022. PMID: 35936867 Free PMC article.
-
Label-Free Identification of Single Mononucleotides by Nanoscale Electrophoresis.Small. 2021 Oct;17(42):e2102567. doi: 10.1002/smll.202102567. Epub 2021 Sep 23. Small. 2021. PMID: 34558175 Free PMC article.
-
Nanofluidic devices for the separation of biomolecules.J Chromatogr A. 2022 Nov 8;1683:463539. doi: 10.1016/j.chroma.2022.463539. Epub 2022 Sep 30. J Chromatogr A. 2022. PMID: 36223665 Free PMC article. Review.
-
Millisecond Label-Free Single Peptide Detection and Identification Using Nanoscale Electrochromatography and Resistive Pulse Sensing.Anal Chem. 2025 Jan 14;97(1):427-435. doi: 10.1021/acs.analchem.4c04542. Epub 2024 Dec 23. Anal Chem. 2025. PMID: 39713813 Free PMC article.
-
In-plane Extended Nano-coulter Counter (XnCC) for the Label-free Electrical Detection of Biological Particles.Electroanalysis. 2022 Dec;34(12):1961-1975. doi: 10.1002/elan.202200091. Epub 2022 Jun 14. Electroanalysis. 2022. PMID: 37539083 Free PMC article.
References
-
- Roda A, Michelini E, Caliceti C, Guardigli M, Mirasoli M, Simoni P, Anal. Bioanal. Chem 2018, 410, 669–677. - PubMed
-
- Sonker M, Kim D, Egatz-Gomez A, Ros A, Annu. Rev. Anal. Chem 2019, 12, 475–500. - PubMed
-
- Khandurina J, Guttman A, Curr. Opin. Chem. Biol 2003, 7, 595–602. - PubMed
-
- Mayer P, Slater GW, Drouin G, Anal. Chem 1994, 66, 1777–1780.
-
- Grossman PD, Colburn JC, Capillary Electrophoresis: Theory and Practice, Academic Press, San Diego: 1992.
Publication types
MeSH terms
Substances
Grants and funding
LinkOut - more resources
Full Text Sources
