

lncRNA MIR4435-2HG promoted clear cell renal cell carcinoma malignant progression via miR-513a-5p/KLF6 axis
- PMID: 33460239
- PMCID: PMC7520272
- DOI: 10.1111/jcmm.15609
lncRNA MIR4435-2HG promoted clear cell renal cell carcinoma malignant progression via miR-513a-5p/KLF6 axis
Abstract
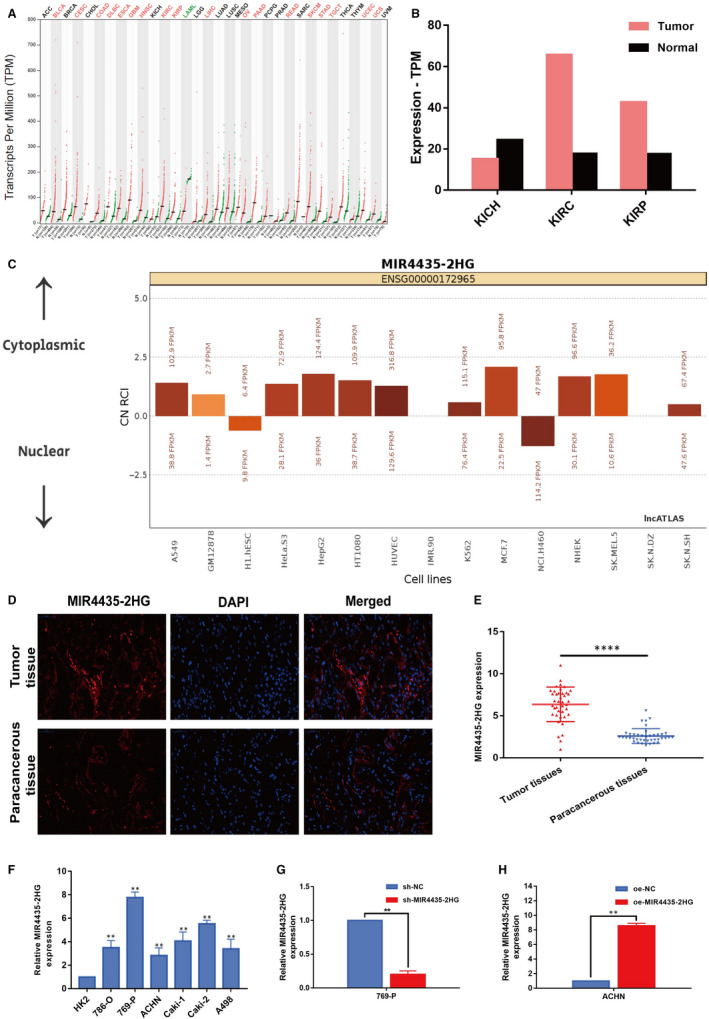
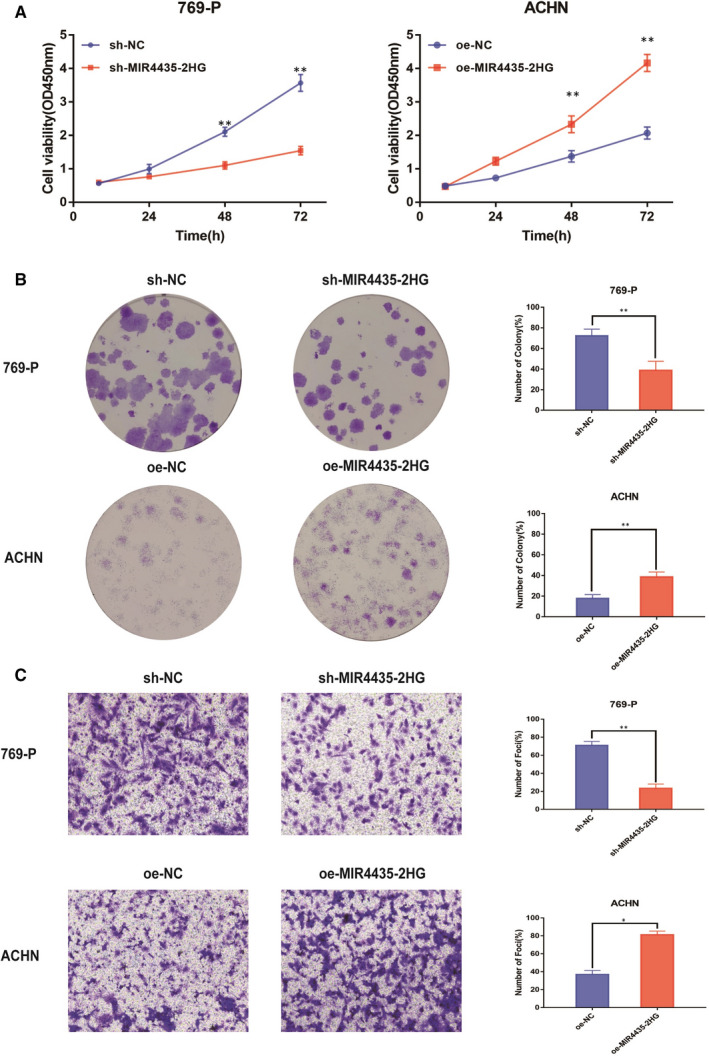
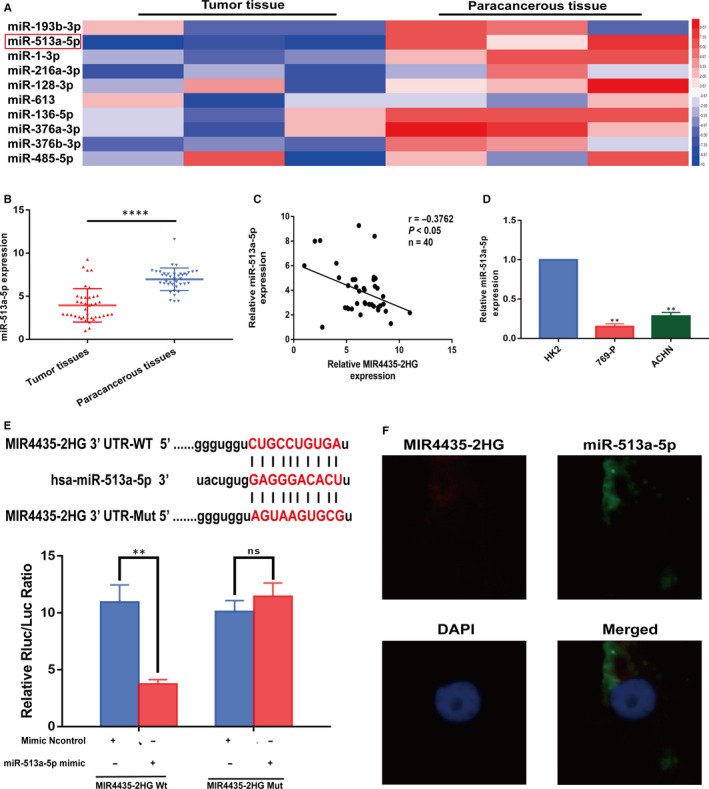
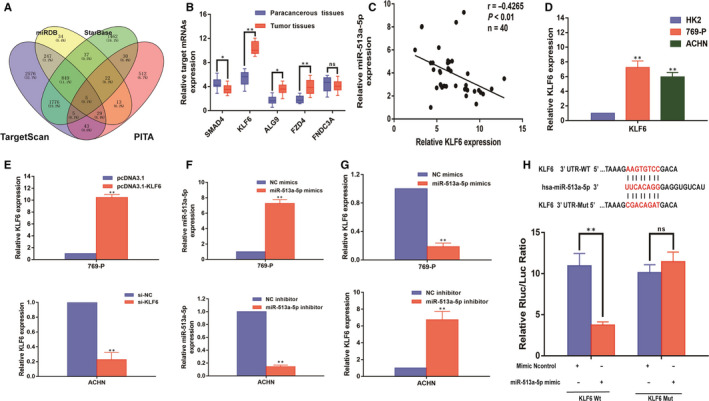
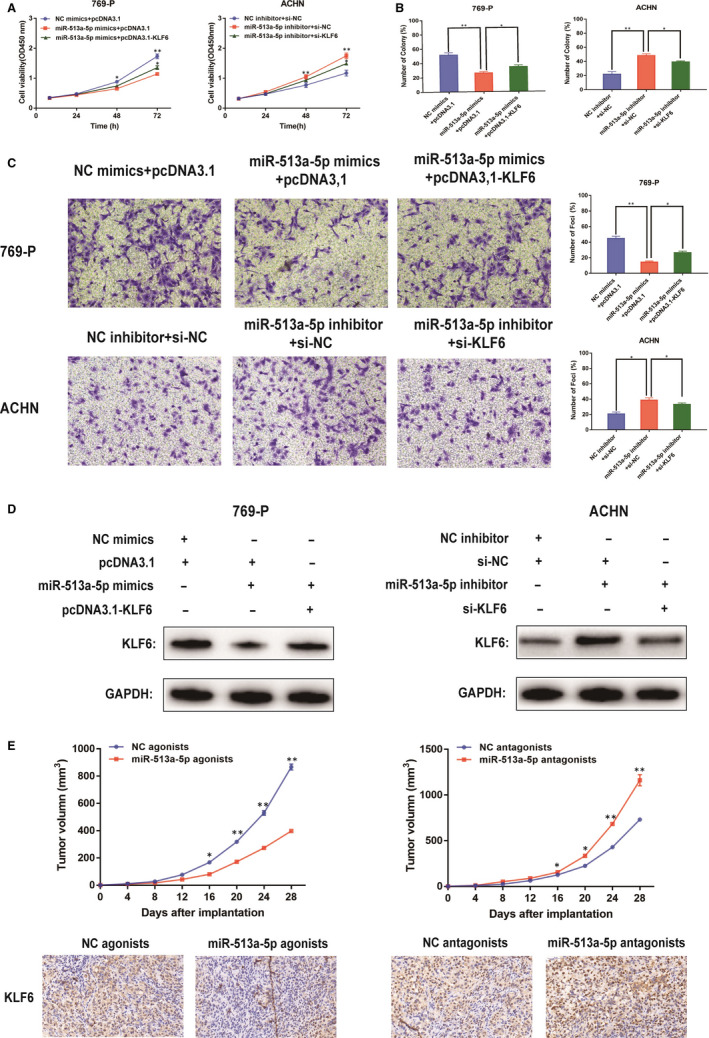
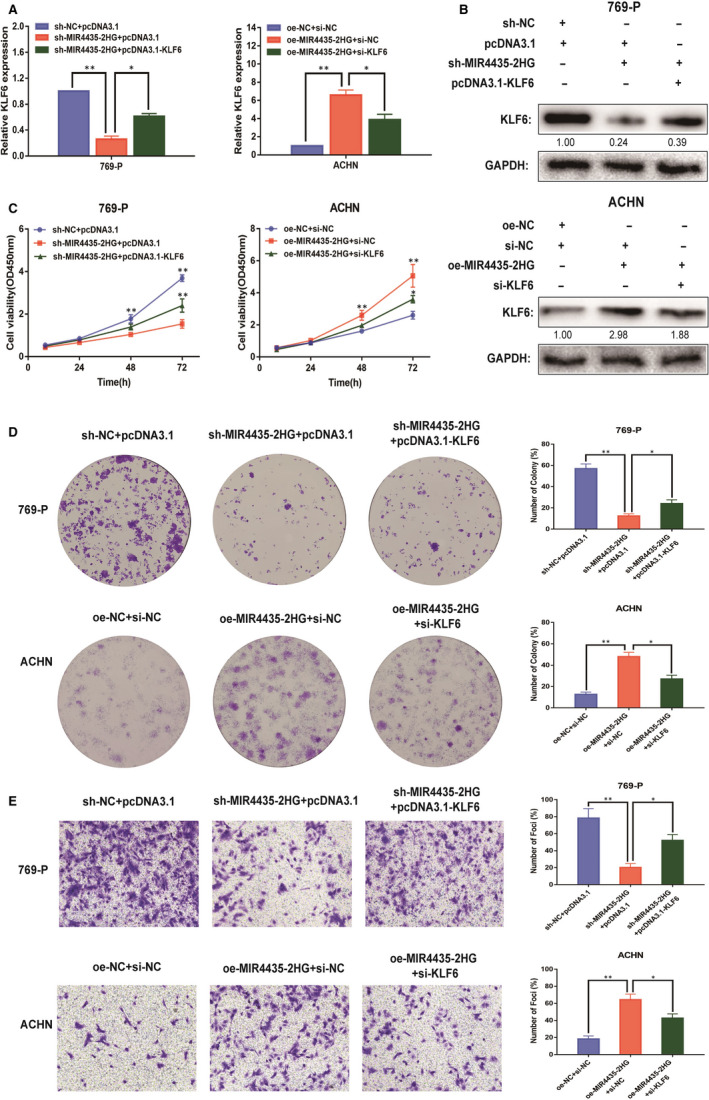
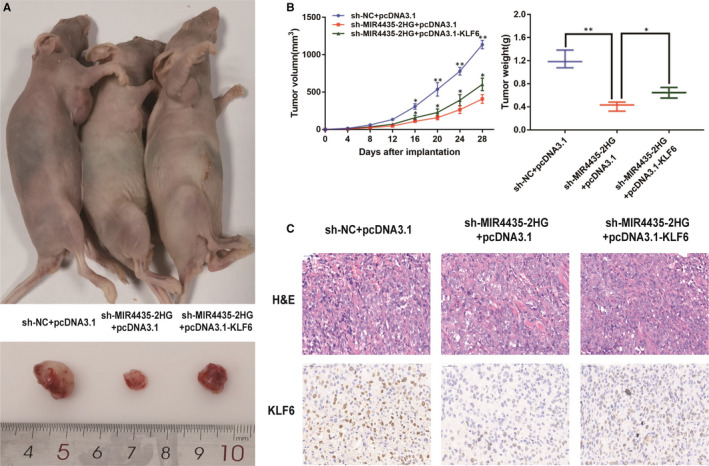
Long non-coding RNAs (lncRNAs) take various biological effects in clear cell renal cell carcinoma (ccRCC) mostly through sponging with microRNAs (miRNAs). lncRNA MIR4435-2HG is found to promote tumour progression in gastric cancer, glioblastoma and hepatocellular carcinoma. However, the role of lncRNA MIR4435-2HG in ccRCC progression remains unknown. The purpose of this research was to investigate the potential molecular mechanism of lncRNA MIR4435-2HG regarding the regulation of ccRCC initiation and progression. In this study, we found the up-regulation of MIR4435-2HG in ccRCC tissues and cell lines. Functionally, overexpression of MIR4435-2HG promoted the proliferation as well as the metastasis in ccRCC cell lines, whereas knockdown of MIR4435-2HG inhibited the above changes. Then, bioinformatic analysis and luciferase reporter assays confirmed the negative regulation effect of MIR4435-2HG on miR-513a-5p. And further investigations showed that KLF6, which collected from the intersection of databases, was the potential conjugated mRNAs of miR-513a-5p. Finally, the rescue experiments revealed the relation among MIR4435-2HG and KLF6, which showed that KLF6 could reverse the promoting effect of MIR4435-2HG on ccRCC in vitro and in vivo. Therefore, our findings provided insight into the mechanisms of MIR4435-2HG in ccRCC and revealed an alternative target for the clinical diagnosis and treatment of ccRCC.
Keywords: KLF6; MIR4435‐2HG; ccRCC; invasion; long non‐coding RNA; proliferation.
© 2020 The Authors. Journal of Cellular and Molecular Medicine published by Foundation for Cellular and Molecular Medicine and John Wiley & Sons Ltd.
Conflict of interest statement
The authors declare no conflicts of interest that pertain to this work.
Figures
Similar articles
-
LncRNA MIR4435-2HG potentiates the proliferation and invasion of glioblastoma cells via modulating miR-1224-5p/TGFBR2 axis.J Cell Mol Med. 2020 Jun;24(11):6362-6372. doi: 10.1111/jcmm.15280. Epub 2020 Apr 22. J Cell Mol Med. 2020. PMID: 32319715 Free PMC article.
-
Up-regulation of miR-181a in clear cell renal cell carcinoma is associated with lower KLF6 expression, enhanced cell proliferation, accelerated cell cycle transition, and diminished apoptosis.Urol Oncol. 2018 Mar;36(3):93.e23-93.e37. doi: 10.1016/j.urolonc.2017.09.019. Epub 2017 Oct 21. Urol Oncol. 2018. PMID: 29066014
-
Long noncoding RNA ZBED3-AS1 restrains breast cancer progression by targeting the microRNA-513a-5p/KLF6 axis.Thorac Cancer. 2021 Oct;12(20):2719-2731. doi: 10.1111/1759-7714.14111. Epub 2021 Aug 24. Thorac Cancer. 2021. PMID: 34427978 Free PMC article.
-
MIR4435-2HG: A Tumor-associated Long Non-coding RNA.Curr Pharm Des. 2022;28(25):2043-2051. doi: 10.2174/1381612828666220607100228. Curr Pharm Des. 2022. PMID: 35674305 Review.
-
MIR4435-2HG: A newly proposed lncRNA in human cancer.Biomed Pharmacother. 2022 Jun;150:112971. doi: 10.1016/j.biopha.2022.112971. Epub 2022 Apr 18. Biomed Pharmacother. 2022. PMID: 35447550 Review.
Cited by
-
Identification and Validation of a Ferroptosis-Related Long Non-Coding RNA (FRlncRNA) Signature to Predict Survival Outcomes and the Immune Microenvironment in Patients With Clear Cell Renal Cell Carcinoma.Front Genet. 2022 Mar 8;13:787884. doi: 10.3389/fgene.2022.787884. eCollection 2022. Front Genet. 2022. PMID: 35350243 Free PMC article.
-
FGF14-AS2 accelerates tumorigenesis in glioma by forming a feedback loop with miR-320a/E2F1 axis.J Cancer. 2021 Sep 3;12(21):6429-6438. doi: 10.7150/jca.62120. eCollection 2021. J Cancer. 2021. PMID: 34659533 Free PMC article.
-
HOTAIRM1 Maintained the Malignant Phenotype of tMSCs Transformed by GSCs via E2F7 by Binding to FUS.J Oncol. 2022 May 9;2022:7734413. doi: 10.1155/2022/7734413. eCollection 2022. J Oncol. 2022. PMID: 35586206 Free PMC article.
-
Excavating novel diagnostic and prognostic long non-coding RNAs (lncRNAs) for head and neck squamous cell carcinoma: an integrated bioinformatics analysis of competing endogenous RNAs (ceRNAs) and gene co-expression networks.Bioengineered. 2021 Dec;12(2):12821-12838. doi: 10.1080/21655979.2021.2003925. Bioengineered. 2021. PMID: 34898376 Free PMC article.
-
MIR4435-2HG Is a Potential Pan-Cancer Biomarker for Diagnosis and Prognosis.Front Immunol. 2022 Jun 15;13:855078. doi: 10.3389/fimmu.2022.855078. eCollection 2022. Front Immunol. 2022. PMID: 35784328 Free PMC article. Review.
References
-
- Zhai W, Sun Y, Jiang M, et al. Differential regulation of LncRNA‐SARCC suppresses VHL‐mutant RCC cell proliferation yet promotes VHL‐normal RCC cell proliferation via modulating androgen receptor/HIF‐2alpha/C‐MYC axis under hypoxia. Oncogene. 2017;36:4525. - PubMed
-
- Sonpavde G, Choueiri TK, Escudier B, et al. Sequencing of agents for metastatic renal cell carcinoma: can we customize therapy? Eur Urol. 2012;61:307‐316. - PubMed
-
- Bella L, Zona S, Nestal DMG, Lam EW. FOXM1: A key oncofoetal transcription factor in health and disease. Semin Cancer Biol. 2014;29:32‐39. - PubMed
MeSH terms
Substances
LinkOut - more resources
Full Text Sources
Medical
