. 2021 Apr 1;162(4):bqab012.
doi: 10.1210/endocr/bqab012.

The Role of Mediobasal Hypothalamic PACAP in the Control of Body Weight and Metabolism

Affiliations

The Role of Mediobasal Hypothalamic PACAP in the Control of Body Weight and Metabolism

Nadejda Bozadjieva-Kramer et al. Endocrinology. .

Abstract

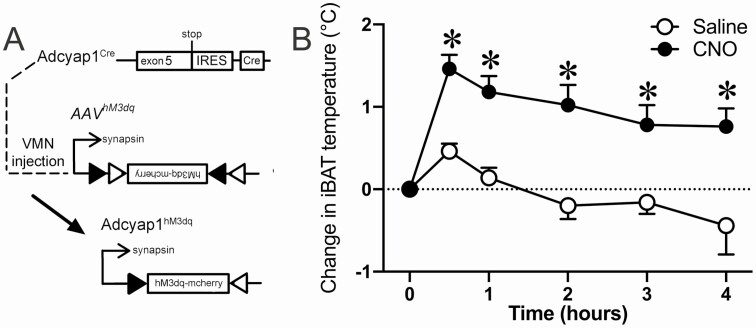
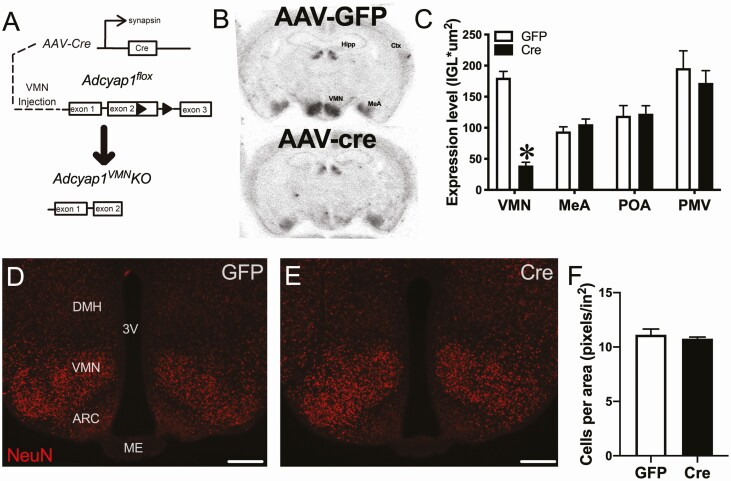
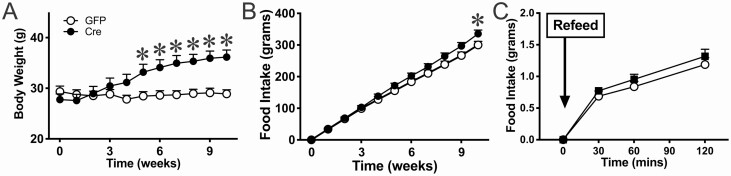
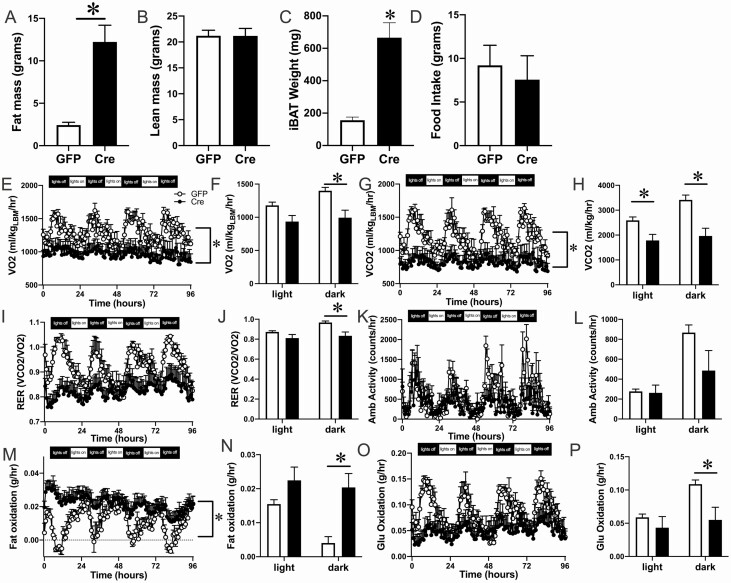
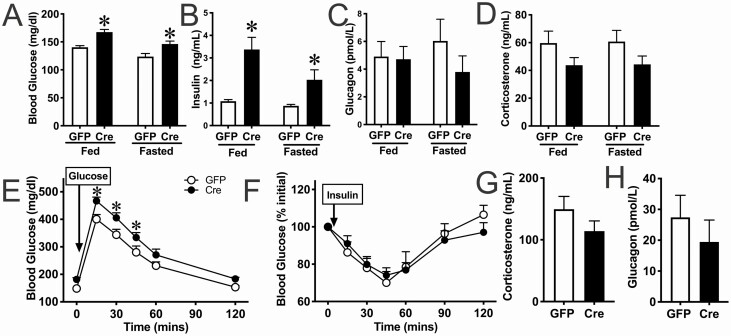
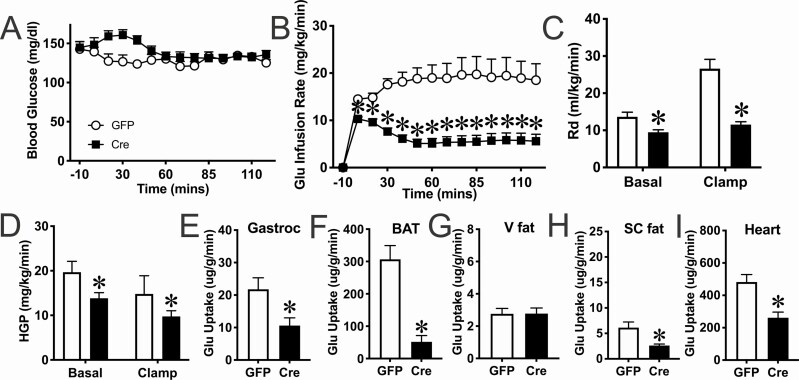
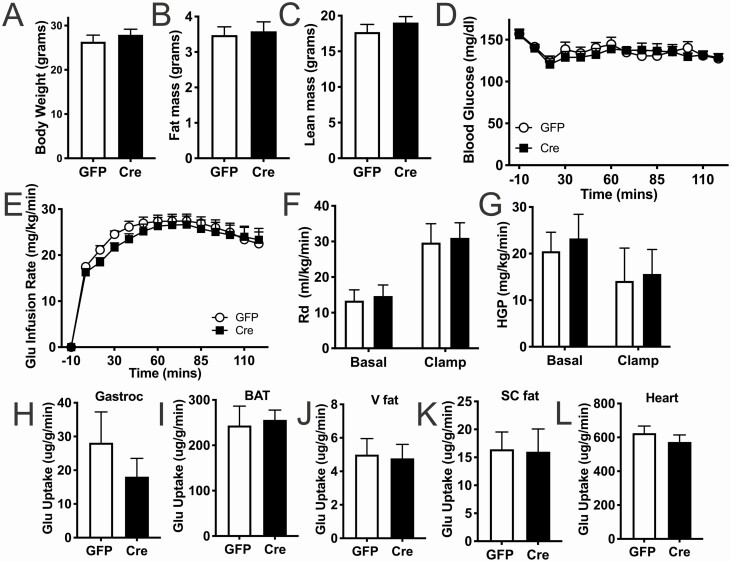
Body energy homeostasis results from balancing energy intake and energy expenditure. Central nervous system administration of pituitary adenylate cyclase activating polypeptide (PACAP) dramatically alters metabolic function, but the physiologic mechanism of this neuropeptide remains poorly defined. PACAP is expressed in the mediobasal hypothalamus (MBH), a brain area essential for energy balance. Ventromedial hypothalamic nucleus (VMN) neurons contain, by far, the largest and most dense population of PACAP in the medial hypothalamus. This region is involved in coordinating the sympathetic nervous system in response to metabolic cues in order to re-establish energy homeostasis. Additionally, the metabolic cue of leptin signaling in the VMN regulates PACAP expression. We hypothesized that PACAP may play a role in the various effector systems of energy homeostasis, and tested its role by using VMN-directed, but MBH encompassing, adeno-associated virus (AAVCre) injections to ablate Adcyap1 (gene coding for PACAP) in mice (Adcyap1MBHKO mice). Adcyap1MBHKO mice rapidly gained body weight and adiposity, becoming hyperinsulinemic and hyperglycemic. Adcyap1MBHKO mice exhibited decreased oxygen consumption (VO2), without changes in activity. These effects appear to be due at least in part to brown adipose tissue (BAT) dysfunction, and we show that PACAP-expressing cells in the MBH can stimulate BAT thermogenesis. While we observed disruption of glucose clearance during hyperinsulinemic/euglycemic clamp studies in obese Adcyap1MBHKO mice, these parameters were normal prior to the onset of obesity. Thus, MBH PACAP plays important roles in the regulation of metabolic rate and energy balance through multiple effector systems on multiple time scales, which highlight the diverse set of functions for PACAP in overall energy homeostasis.

Keywords: Energy balance; Energy expenditure; glucose homeostasis; obesity; thermogenesis; ventromedial hypothalamus.


Figures

Figure 1.
Figure 1.
Activation of VMN Adcyap1 cells increases BAT temperature. We administered an AAV that introduces hM3dq in Adcyap1 cells in the VMN (A) and measured interscapular BAT (iBAT) temperature in response to both clozapine-n-oxide (CNO) and Saline (vehicle control) (B). Data are expressed as mean ± SEM. Results were analyzed by 2-way repeated-measures ANOVA. Open circles and bars refer to Saline control and closed circles and bars refer to CNO. n = 5, *P < 0.05.
Figure 2.
Figure 2.
AAV-cre injection ablates VMN Adcyap1 expression. We administered AAV-Cre into the VMN of Adcyap1flox mice to truncate the gene and inactivate the resultant peptide (A). This floxed mutant leads to a frameshift mutation producing a truncated protein that can no longer act on the receptor. Representative images of in situ hybridization for Adcyap1 (black signal) in control AAV-GFP-injected (top panel) and AAV-cre-injected (bottom panel) mice (B). Quantification of Adcyap1 mRNA signal in the VMN, medial amygdala (MeA), preoptic area (POA), and ventral premammillary nucleus (PMV) (C). Cell counts in the VMN were quantified (F) after staining for NeuN (D-E) in mice 12 weeks post-AAV injection. Dorsomedial hypothalamus (DMH), ventromedial hypothalamic nucleus (VMN), arcuate nucleus (ARC), median eminence (ME), and third ventricle (3V) are noted in the figure. Data are expressed as mean ± SEM. Results were analyzed by Student t test. Open bars refer to GFP control and closed bars refer to Cre. n = 16 (GFP), 22 (cre) in C and n = 8 (GFP), 8 (Cre) in F, *P < 0.05.
Figure 3.
Figure 3.
Loss of Adycap1 in MBH induces obesity. Following AAV injection, we measured body weight (A) and food intake (B) for 10 weeks postinjection in male mice. We also tested the status of homeostatic feeding systems by re-feeding mice following overnight fast performed during the light cycle (C). Data are expressed as mean ± SEM. Results were analyzed by repeated-measures ANOVA with Fisher least significant difference post hoc tests in A, C, and D, and Student t test in B. Open circles refer to GFP control and closed circles refer to Cre. n = 8 (GFP), 11 (cre), *P < 0.05.
Figure 4.
Figure 4.
Adcyap1 MBH KO mice have impaired energy expenditure measured by indirect calorimetry. At 4 weeks postinjection, we measured body composition via Echo MRI (A-B). At 5 weeks, we weighed interscapular BAT (iBAT) tissue (C). Food intake was collected in the metabolic chambers (D). VO2 and VCO2 were analyzed by normalizing lean mass (E, F). Respiratory exchange ratio, ambulatory activity, fat oxidation, and glucose oxidation were also measured in the metabolic chambers (I, K, M, O). In addition to data collected every 40 minutes, average values separately by light and dark cycle are also included (F, H, J, L, N, P). Data are expressed as mean ± SEM. Results were analyzed by 2-way ANOVA with Fisher least significant difference (LSD) post hoc tests in F, H, J, L, N, P, and repeated-measures ANOVA with Fisher LSD post hoc tests in D, F, H, J, L, N. Results were measured by Student t test in A-D. Open circles and bars refer to GFP control and closed circles and bars refer to Cre. n = 5 (GFP), 7 (cre), *P < 0.05.
Figure 5.
Figure 5.
Adcyap1 MBH KO mice are hyperglycemic and hyperinsulinemic, but not insulin resistant. In addition to body weight and food intake-related measures, we determined if glycemic factors were also out of balance. We measured glucose (A), insulin (B), glucagon (C), and corticosterone (D) at both fed state and post-overnight fast. All of these tests were performed during the light cycle. We also performed glucose (2 g/kg) tolerance test (E) and insulin (0.6 U/kg) tolerance test (F). We also measured corticosterone (G) and glucagon (H) levels 30 minutes following insulin injection. Data are expressed as mean ± SEM. Results were analyzed by 2-way ANOVA with Fisher LSD post hoc tests in A-D and repeated-measures ANOVA with Fisher least significant difference post hoc tests in E-F. Results in G-H were analyzed by Student t test. Open circles and bars refer to GFP control and closed circles and bars refer to Cre. n = 16 (GFP), 22 (cre), *P < 0.05.
Figure 6.
Figure 6.
Obese Adcyap1 MBH KO mice have impaired glucose clearance. We used the hyperinsulinemic/euglycemic clamp during the light cycle to determine whether glucose clearance was impaired in male Adcyap1MBHKO mice, as suggested with preliminary analysis of glycemic parameters (Fig. 4). Glucose was clamped at 150 mg/dL (A). We measured glucose infusion rate (B), glucose disposal (C), and hepatic glucose production (D) both before and during the clamp. We also measured the uptake of radiolabeled 2-deoxy glucose in the muscle (E), brown adipose tissue (F), visceral fat (G), subcutaneous fat (H), and the heart (I). Data are expressed as mean ± SEM. Results were analyzed by repeated-measures ANOVA with Fisher least significant difference (LSD) post hoc tests in A-B, 2-way ANOVA with Fisher’s LSD post hoc tests in C-D, and Student t test in E-I. Open circles and bars refer to GFP control and closed squares and bars refer to Cre. n = 7 (GFP), 11 (cre), *P < 0.05.
Figure 7.
Figure 7.
Adcyap1 MBH KO mice do not have impaired glucose clearance prior to obesity. Before mice were obese, glucose clamps were performed during the light cycle in a cohort of male mice to determine the direct function of the peptide versus effects secondary to obesity. We measured body weight (A), fat mass (B), and lean mass (C) prior to clamp. Glucose was clamped at 150 mg/dL (D). We measured glucose infusion rate (E). In addition, we measured glucose disposal (F) and hepatic glucose production (G) both before and during the clamp. Lastly, we measured the uptake of radiolabeled 2-deoxyglucose in the muscle (H), brown adipose tissue (I), visceral fat (J), subcutaneous fat (K), and heart (L) after the clamp. Data are expressed as mean ± SEM. Results were analyzed by Student t test in A-C, H-K, repeated-measures ANOVA with Fisher least significant difference (LSD) post hoc tests in D-E, and 2-way ANOVA with Fisher LSD post hoc tests in F-G. Open circles and bars refer to GFP control and closed squares and bars refer to Cre. n = 5 (GFP), 7 (cre).

Similar articles

Cited by

References

    1. Ogden CL, Yanovski SZ, Carroll MD, Flegal KM. The epidemiology of obesity. Gastroenterology. 2007;132(6):2087-2102. - PubMed
    1. Finkelstein EA, Trogdon JG, Cohen JW, Dietz W. Annual medical spending attributable to obesity: payer-and service-specific estimates. Health Aff (Millwood). 2009;28(5):w822-w831. - PubMed
    1. Srivastava G, Apovian CM. Current pharmacotherapy for obesity. Nat Rev Endocrinol. 2018;14(1):12-24. - PubMed
    1. Comerma-Steffensen S, Grann M, Andersen CU, Rungby J, Simonsen U. Cardiovascular effects of current and future anti-obesity drugs. Curr Vasc Pharmacol. 2014;12(3):493-504. - PubMed
    1. Moreira FA, Crippa JA. The psychiatric side-effects of rimonabant. Braz J Psychiatry. 2009;31(2):145-153. - PubMed

Publication types

MeSH terms

Substances