. 2021 Jan 18:10:e62438.
doi: 10.7554/eLife.62438.

Regulatory roles of Escherichia coli 5' UTR and ORF-internal RNAs detected by 3' end mapping

Affiliations

Regulatory roles of Escherichia coli 5' UTR and ORF-internal RNAs detected by 3' end mapping

Philip P Adams et al. Elife. .

Erratum in

Abstract

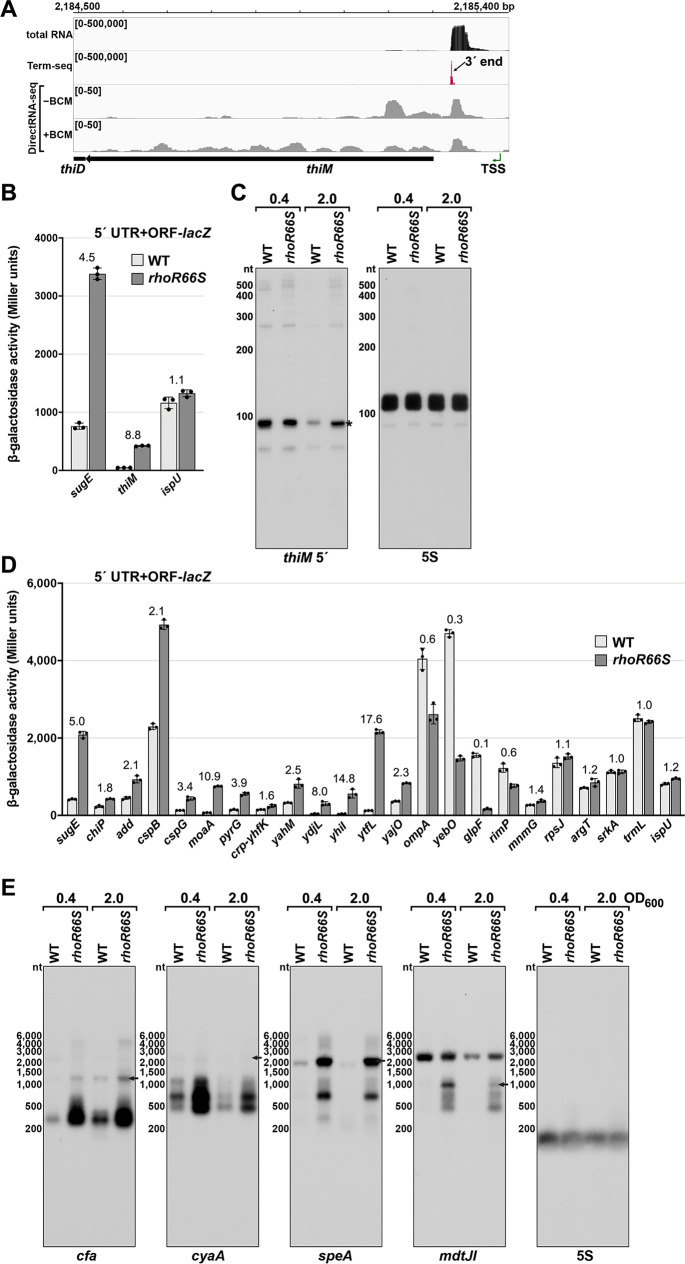
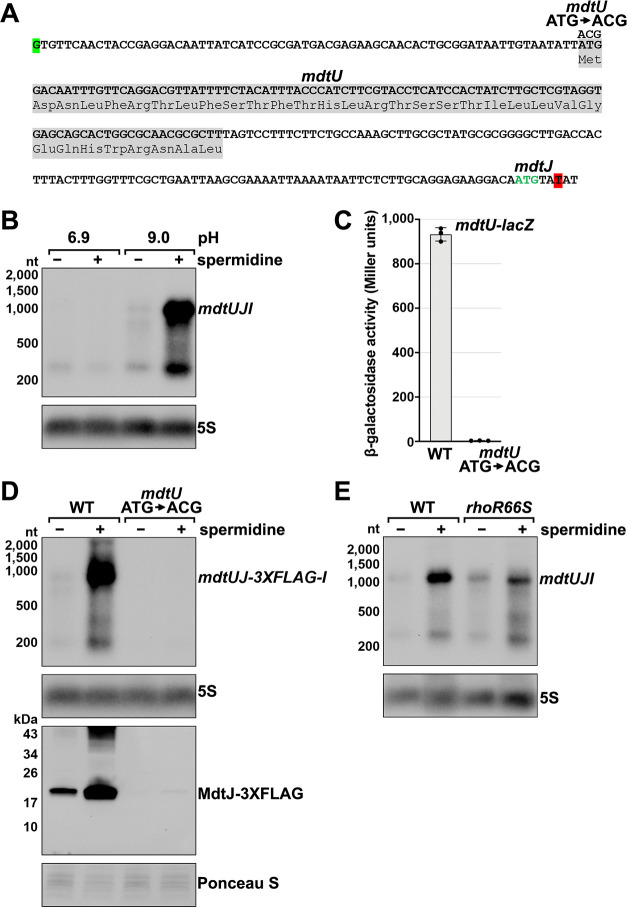
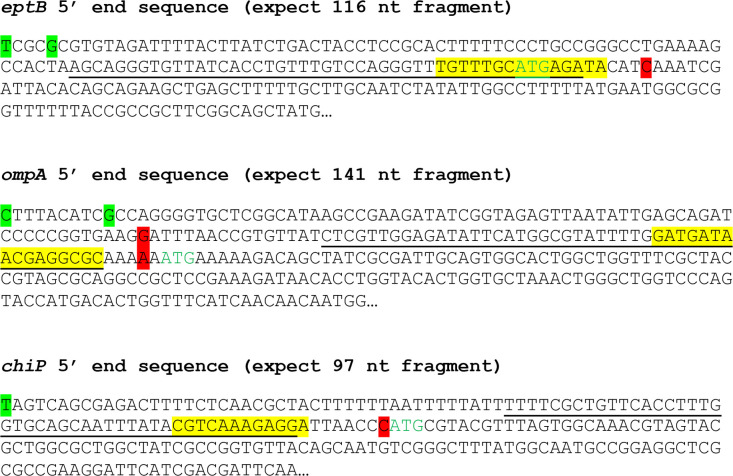
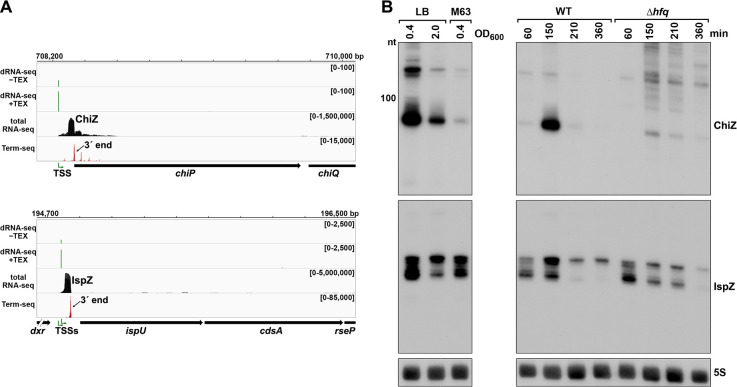
Many bacterial genes are regulated by RNA elements in their 5´ untranslated regions (UTRs). However, the full complement of these elements is not known even in the model bacterium Escherichia coli. Using complementary RNA-sequencing approaches, we detected large numbers of 3´ ends in 5´ UTRs and open reading frames (ORFs), suggesting extensive regulation by premature transcription termination. We documented regulation for multiple transcripts, including spermidine induction involving Rho and translation of an upstream ORF for an mRNA encoding a spermidine efflux pump. In addition to discovering novel sites of regulation, we detected short, stable RNA fragments derived from 5´ UTRs and sequences internal to ORFs. Characterization of three of these transcripts, including an RNA internal to an essential cell division gene, revealed that they have independent functions as sRNA sponges. Thus, these data uncover an abundance of cis- and trans-acting RNA regulators in bacterial 5´ UTRs and internal to ORFs.

Keywords: E. coli; RNA sponges; RNA-mediated regulation; RNA-seq; Rho-dependent termination; base pairing sRNAs; infectious disease; microbiology; uORF.

Plain language summary

In most organisms, specific segments of a cell’s genetic information are copied to form single-stranded molecules of various sizes and purposes. Each of these RNA molecules, as they are known, is constructed as a chain that starts at the 5´ end and terminates at the 3´ end. Certain RNAs carry the information present in a gene, which provides the instructions that a cell needs to build proteins. Some, however, are ‘non-coding’ and instead act to fine-tune the activity of other RNAs. These regulatory RNAs can be separate from the RNAs they control, or they can be embedded in the very sequences they regulate; new evidence also shows that certain regulatory RNAs can act in both ways. Many regulatory RNAs are yet to be catalogued, even in simple, well-studied species such as the bacterium Escherichia coli. Here, Adams et al. aimed to better characterize the regulatory RNAs present in E. coli by mapping out the 3´ ends of every RNA molecule in the bacterium. This revealed many new regulatory RNAs and offered insights into where these sequences are located. For instance, the results show that several of these RNAs were embedded within RNA produced from larger genes. Some were nested in coding RNAs, and were parts of a longer RNA sequence that is adjacent to the protein coding segment. Others, however, were present within the instructions that code for a protein. The work by Adams et al. reveals that regulatory RNAs can be located in unexpected places, and provides a method for identifying them. This can be applied to other types of bacteria, in particular in species with few known RNA regulators.


Conflict of interest statement

PA, GB, CE, KC, NS, MM, RD No competing interests declared, GS Senior editor, eLife, JW Reviewing editor, eLife

Figures

Figure 1.
Figure 1.. Distribution of 3´ ends and putative sites of Rho termination.
(A) Schematic of classification of Term-seq 3´ ends and Rho termination sites relative to an annotated ORF. 3´ ends and termination sites were defined as: primary (purple colored, located on the same strand within 50 bp downstream of the 3´ end of an annotated gene (mRNA ORF, tRNA, rRNA, or sRNA)), antisense (aquamarine colored, located on the opposite strand within 50 bp of a gene start and end coordinates), internal (orange colored, located on the same strand within a gene) and orphan (fuchsia colored, located in a 5´ UTR, long 3´ UTR or not falling in any of the previous classes). The black arrow represents an ORF. (B) Distribution of Term-seq 3´ ends relative to annotated genes. Some 3´ ends fit the criteria for two different categories; 99 are primary and antisense, eight are primary and internal and 13 are internal and antisense. (C) Distribution of Rho termination sites relative to annotated genes based on DirectRNA-seq after BCM treatment. Some fit the criteria for two different categories; 12 are primary and antisense and six are primary and internal, three are antisense and internal. (D) C:G ratio of sequences surrounding predicted Rho termination sites. Nucleotide proportions were calculated by scanning 600 nt upstream and downstream of Rho 3´ ends (Supplementary file 2) using 25 nt windows. Plotted values represent the average ratios for all 1078 regions (blue). Control plot (gray) represents average C:G ratios calculated in the same manner for 1078 random E. coli MG1655 genomic positions.
Figure 1—figure supplement 1.
Figure 1—figure supplement 1.. RNA-seq approaches.
Schematic of total RNA-seq (modified from the RNAtag-seq methodology, Shishkin et al., 2015), Term-seq (modified from Dar et al., 2016) and DirectRNA-seq (Ozsolak and Milos, 2011). RNA 3´ end adapter (red line), cDNA adapter (green line), and stranded sequencing (asterisks) are indicated.
Figure 1—figure supplement 2.
Figure 1—figure supplement 2.. Analysis of Term-seq and DirectRNA-seq data.
(A) Principal component analysis plot to show correlation among total RNA-seq and Term-seq replicates. Read counts at annotated ORFs for total RNA-seq or the union of 3´ ends characterized from all replicates for Term-seq were normalized by variance-stabilizing transformation and used in the principal component analysis to estimate the relationships between samples. (B) Upset plot showing numbers of 3´ ends under different conditions. Term-seq 3´ ends from each growth condition (Supplementary file 1) were compared. If 3´ ends were called within a 10 nt window on the same DNA strand between growth conditions, they were considered shared across those datasets. Number of unique or shared 3´ ends in each growth condition are indicated above the bars. Total number of 3´ ends for each condition are indicated on the right. (C) Comparison of current Term-seq data to Term-seq data from Dar and Sorek, and vice versa. Primary Term-seq 3´ ends from the LB 0.4 condition (Supplementary file 1) were compared to previously reported mRNA 3´ ends, which used E. coli BW25113 grown to exponential phase in LB (Dar and Sorek, 2018b, Table S1 column F: ‘primary 3´ end position’). Prior to the comparison, E. coli BW25113 3´ end positions were converted to corresponding E. coli MG1655 positions (see details below). (D) Comparison of current Term-seq data to re-analyzed Term-seq data from Dar and Sorek, and vice versa. 3´ ends were called from the Dar and Sorek Term-seq reads using our computational pipeline (see Materials and methods) and compared to all Term-seq 3´ ends from the LB 0.4 condition (Supplementary file 1). (E) Comparison of current Term-seq data to SEnd-seq data from Ju et al., and vice versa. All unique Term-seq 3´ ends from the LB 0.4 and 2.0 conditions (Supplementary file 1) were compared to previously reported 3´ ends, which used E. coli MG1655 grown to exponential and stationary phase in LB (Ju et al., 2019, Table S2 column B: ‘TTS_position’). (F) Comparison of current Term-seq data to SMRT-Cappable-seq data from Yan et al., and vice versa. All Term-seq 3´ ends from the LB 0.4 condition (Supplementary file 1) were compared to previously reported 3´ ends, which used E. coli MG1655 grown to exponential phase in LB (Yan et al., 2018, Supplementary Data 1, columns B or C: ‘start’ or ‘end’ dependent on DNA strand). For (C), (D), (E), and (F), if 3´ ends were called within a 10 nt window on the same DNA strand between both datasets, they were considered shared. Note that the number of overlapping positions differs depending on the direction of the analysis (indicated by the two numbers in the center of each Venn diagram), because a single position in one dataset can be within 10 nt of multiple positions in the other dataset. Numbers in the center circle align with those in the outer circle according to the order of the comparison. The statistical significance of overlaps was demonstrated using a hypergeometric test (p<2.2e−16 in all cases, for comparisons in either direction; see Materials and methods for details), with the null hypothesis being that the positions in one dataset are randomly positioned with respect to positions in another dataset. (G) Upset plot comparing Rho-dependent transcription termination in different studies using BCM treatment and RNA-seq. DirectRNA-seq Rho-dependent 3´ ends (Supplementary file 2) were compared to those previously reported by Peters et al., which used tiling microarray analysis and Total RNA-seq of E. coli MG1655 grown to exponential phase in MOPS minimal medium, 0.2% glucose ±BCM (Peters et al., 2012, Table S1, columns A or B: ‘start’ or ‘end’ dependent on DNA strand); Ju et al., which used SEndRNA-seq of E. coli MG1655 grown to exponential and stationary phase in LB ±50 μg/ml BCM (Ju et al., 2019, Table S2, column B and R: ‘TTS_position’ and ‘TTS_type_rho_dependent’); Dar and Sorek, which used Total RNA-seq and Term-seq of E. coli BW25113 grown to exponential phase in LB ±BCM (Dar and Sorek, 2018b, Table S2, column D and L: ‘primary 3´ end position’ and ‘termination mechanism’). If 3´ ends were called within a 500 nt window on the same DNA strand between both datasets, they were considered shared. The number of unique or shared Rho-dependent termini in each study are indicated above the bars, with the total number indicated on the right. For panels (C–G), all datasets were converted to the corresponding E. coli MG1655 (NC_000913.3) positions. To do this, sequences 60 nt upstream of the reported sites in the original genome assembly in each of the respective datasets, were converted to the corresponding E. coli MG1655 (NC_000913.3) positions if there was a single perfect match. (H) Comparison of current Term-seq data to DirectRNA-seq data, and vice versa. All Term-seq 3´ ends from the LB 0.4 condition (Supplementary file 1) were compared to DirectRNA-seq Rho-dependent 3´ ends (Supplementary file 2). If 3´ ends were called within a 500 nt window on the same DNA strand between both datasets, they were considered shared. Numbers in the center circle align with the outer circle value according to the order of the comparison. A hypergeometric test was performed and indicated the overlap between datasets is significant (p<2.2e−16 for comparisons in either direction), with the null hypothesis being that the positions in one dataset are randomly positioned with respect to positions in the other dataset.
Figure 2.
Figure 2.. Experimental validation of premature Rho termination.
(A) RNA-seq screenshot of the sugE (gdx) locus displaying sequencing reads from LB 0.4 total RNA-seq, LB 0.4 Term-seq and DirectRNA-seq ±BCM treatment. Total and Term-seq tracks represent an overlay of two biological replicates. Read count ranges are shown in the top of each frame. The chromosome nucleotide coordinates, relative orientation of the sugE and blc ORFs (wide black arrows), dominant 3´ end in the sugE 5´ UTR from Supplementary file 3 (small black arrow labeled 3´ end), and sugE TSS (Thomason et al., 2015) (bent green arrow) are indicated. (B) RNA-seq screenshot of the mdtJI locus, labeled as in (A). (C) RNA-seq screenshot of the ispU (uppS) locus, labeled as in (A). (D) β-galactosidase activity for sugE, cfa, cyaA, mdtJ, eptB and ispU 5´ UTR + ORF transcriptional fusions to lacZ in WT (AMD054) and rhoR66S mutant (GB4). All gene-reporter fusions initiate from the same high expression promoter and were assayed at OD600 ~0.4–0.6 (see Materials and methods for details). Values represent the mean of at least three independent replicates (indicated by black dots). Error bars represent one standard deviation from the mean. The rhoR66S vs WT fold change is reported above the values for each 5´ UTR. A speA 5´ UTR + ORF-lacZ could not be assayed because cells did not grow, likely because of toxicity associated with overexpression of the full-length gene product. (E) β-galactosidase activity for sugE, cfa, cyaA, speA, mdtJ, eptB, and ispU 5´ UTR transcriptional fusions to lacZ in WT (AMD054) and rhoR66S mutant (GB4). Experiments were performed and data analyzed as in (D). DirectRNA-seq Rho scores for the dominant 3´ end in the 5´ UTR (from Supplementary file 3) of these loci are: 3.7 for sugE, 2.6 for cfa, 2.0 and 2.6 for cyaA (there are two 3´ ends), 3.1 for speA, 2.3 for mdtJ, 2.3 for eptB and 0.7 for ispU. Rho termination regions were also identified in these genes, or neighboring genes, for all loci except ispU (Supplementary file 2). See Supplementary file 4 for oligonucleotides used in cloning to delineate regions in each lacZ fusion. (F) Northern analysis for sugE, cfa, cyaA, speA, mdtJ, eptB and ispU 5´ UTRs in WT (GSO989) and rhoR66S mutant (GSO990) cells. Cells were grown to OD600 ~0.4 or 2.0 after a dilution of the overnight culture and lysed. Total RNA was extracted, separated on an acrylamide gel, transferred to a membrane and probed for the indicated RNAs (RNAs were probed sequentially on the same membrane). Blot was also probed for 5S (Figure 2—figure supplement 1C). Size markers are indicated for all RNAs. Asterisks signify the transcript predicted to correlate to the 3´ end in Supplementary file 3. Arrow points to expected full-length sugE transcript.
Figure 2—figure supplement 1.
Figure 2—figure supplement 1.. Test of Rho-dependent termination in several genes.
(A) RNA-seq screenshot of the thiM locus displaying sequencing reads from LB 0.4 total RNA-seq, LB 0.4 Term-seq and DirectRNA-seq ± BCM treatment. Total and Term-seq tracks represent an overlay of two biological replicates. Read count ranges are shown in the top of each frame. The chromosome nucleotide coordinates, relative orientation of the thiM ORF (wide black arrow), dominant 3´ end in the 5´ UTR from Supplementary file 3 (small black arrow), and thiM TSS (Thomason et al., 2015 (green arrow) are indicated). (B) β-galactosidase activity for sugE, thiM, and ispU 5´ UTR + ORF-lacZ fusions in WT (AMD054) and rhoR66S mutant (GB4). Cells were grown to OD600 ~0.4–0.6 after a 1:100 dilution of the overnight culture prior to lysis and analysis. Data are presented as the mean β-galactosidase activity ± standard deviation for biological triplicate samples. The rhoR66S versus WT fold change is listed above each gene. DirectRNA-seq Rho scores for the dominant 3´ end in the 5´ UTR (from Supplementary file 3) of these loci are: 3.7 for sugE, 1.7 for thiM, and 0.7 for ispU. (C) Northern analysis for thiM 5´ UTR and 5S RNA in WT (GSO989) and rhoR66S mutant (GSO990) cells. Cells were grown to OD600 ~0.4 or 2.0 after a dilution of the overnight culture and lysed. Total RNA was extracted, separated on an acrylamide gel, transferred to a membrane and probed for the indicated RNAs (RNAs were probed sequentially on the same membrane). This is the same blot as depicted in Figure 2F. Size markers are indicated for all RNAs. An asterisk signifies the transcript predicted to correlate to the thiM 3´ end in Supplementary file 3. (D) β-galactosidase activity for additional 5´ UTR + ORF-lacZ fusions in WT (AMD054) and rhoR66S mutant (GB4). The assay was carried out and data displayed as described for (B). With the exception of ispU, ompA, and glpF, all loci were associated with significant Rho termination regions (Supplementary file 2), but some loci had no detectable 3´ end in the Term-seq LB 0.4 dataset (add, cspG, ydjL, ytfL, rimP, mnmG, and srkA). (E) Northern analysis for cfa, cyaA, speA, and mdtJ mRNAs in WT (GSO989) and rhoR66S mutant (GSO990) cells. Total RNA samples in (C) were separated on an agarose gel, transferred to a membrane, and probed for the indicated RNAs (RNAs were probed sequentially on the same membrane). Size markers are indicated for all RNAs. Arrows point to expected full-length transcripts. The speA probe likely detects a yqgG-yqgB-speAB transcript and the mdtJ probe detects a mdtUJI transcript (see Figure 3). We do not know the identity of the ~2500 nt band on the mdtJ northern blot for which we used a different probe than in Figure 3.
Figure 3.
Figure 3.. Effect of spermidine on mdtUJI expression.
(A) Sequence of the mdtJI 5´ UTR. The transcription start site (green shaded nucleotide) determined by dRNA-seq (Thomason et al., 2015) and 3´ end (red shaded nucleotide) determined by Term-seq (current study) are indicated. Sequence encoding the mdtU uORF is highlighted in gray. Start codon of the mdtJ ORF is indicated with green text. (B) Northern analysis of effects of spermidine on mdtUJI mRNA levels. WT (GSO989) cells were grown for 150 min after a dilution of the overnight culture, ±10 mM spermidine in either LB pH 6.9 or LB pH 9.0. Total RNA was extracted, separated on an agarose gel, transferred to a membrane and sequentially probed for the mdtJI 5´ UTR and 5S. (C) β-galactosidase activity of a mdtU translational lacZ fusion. WT mdtU (pASW1) and start codon (ATG→ACG) mutant (pGB337) were assayed and analyzed as in Figure 2D. Constructs included the native mdtUJI TSS and full-length mdtU ORF. (D) Northern and western analyses of the effect of the mdtU uORF mutant on mdtJ-3XFLAG-mdtI mRNA and MdtJ-3XFLAG levels. WT mdtU (GSO991) and start codon (ATG→ACG) mutant (GSO992) cells harboring an mdtUJ-3XFLAG-I were grown for 150 min after a dilution of the overnight culture, ±10 mM spermidine in LB pH 9.0. Total RNA was analyzed as in (B). Protein extracts were separated on a Tris-Glycine gel, transferred to a membrane, stained using Ponceau S stain, and probed using ɑ-FLAG antibodies. We do not know the identity of the higher molecular weight bands observed for the WT sample in the western analysis. They could be due to multimeric MdtJ or MdtJ association with the membrane. (E) Northern analysis of Rho effect on mdtUJI mRNA levels in the presence of spermidine. WT (GSO989) and rhoR66S mutant (GSO990) cells were grown for 150 min after a dilution of the overnight culture, ±10 mM spermidine in LB pH 9.0. Total RNA was analyzed as in (B).
Figure 3—figure supplement 1.
Figure 3—figure supplement 1.. Amino acid conservation of mdtU uORF in selected gammaproteobacterial species.
Unannotated uORF (mdtU) sequences were selected by searching for short (20–40 amino acid) ORFs with <300 nt distance from the start of an mdtJ ortholog in 1742 sequenced gammaproteobacterial genomes. A list of 89 unique uORF sequences from 68 different species (17 genera) with significant similarity to E. coli (BLAST score ≥20.0) was used for a subsequent Clustal alignment. E. coli K12 MG1655 (GCF_000005845.2) strain was used as a reference and represents the genus Escherichia. For others, a single species of each genus was selected randomly. Representative species shown in this figure: Shigella flexneri (GCF_000006925.2), Salmonella enterica (GCF_002208255.1), Citrobacter werkmanii (GCF_002386385.1), Kluyvera intermedia (GCF_001022135.1), Leclercia adecarboxylata (GCF_001518835.1), Enterobacter cloacae (GCF_900050915.1), Lelliottia sp. PFL01 (GCF_002271215.1), Klebsiella quasipneumoniae (GCF_001596075.2), Raoultella ornithinolytica (GCF_000829965.1), Cedecea neteri (GCF_000757825.1), Kosakonia oryzae (GCF_900168185.1), Cronobacter muytjensii (GCF_001277195.1), Pluralibacter gergoviae (GCF_000757785.1), Erwinia amylovora (GCF_000027205.1), Pantoea vagans (GCF_000148935.1), Buttiauxella agrestis (GCF_000735355.1). BoxShade residue colors highlight amino acids that are fully conserved (black), amino acids of similar properties (gray), or not conserved (white). The length of each mdtU sequence is indicated on the right.
Figure 4.
Figure 4.. Effect of sRNA deletions on eptB, ompA, and chiP fragments.
(A) Sequence of documented region of sRNA-mRNA pairing. 3´ end determined by Term-seq is highlighted in red. Start codon of the corresponding ORF is indicated with green text. (B) Northern analysis of eptB, ompA, and chiPQ mRNAs. WT (GSO982) without and with indicated plasmids and ΔmgrR (GSO993), ΔmicA (GSO994), and ΔchiX (GSO995) cells were grown for 150 min after a dilution of the overnight culture. Total RNA was extracted, separated on an agarose gel, transferred to a membrane and sequentially probed for specific mRNAs and 5S. Size markers are indicated for all RNAs. (C) Northern analysis of eptB, ompA, and chiP 5´ UTR fragments. The same RNA as in (B) was separated on an acrylamide gel, transferred to a membrane and probed for specific 5´ UTR fragments and 5S. Size markers are indicated for all RNAs.
Figure 4—figure supplement 1.
Figure 4—figure supplement 1.. Sequences of eptB, ompA and chiP 5´ UTRs.
Transcription start sites (nucleotide shaded green) determined by dRNA-seq (Thomason et al., 2015) and 3´ ends (nucleotide shaded red) determined by Term-seq (current study) are indicated. Start codons are in green font, and sequences shown to base pair with sRNAs binding (eptB-MgrR or ompA-MicA or chiP-ChiX) are highlighted in yellow. Sequences complementary to northern probes used for Figure 4C are underlined.
Figure 5.
Figure 5.. 5´ UTR-derived sRNAs ChiZ and IspZ.
(A) RNA-seq screenshot of the ChiZ and IspZ loci displaying sequencing reads from the LB 0.4 growth condition from dRNA-seq (Thomason et al., 2015, HS2 samples), total RNA-seq and Term-seq. Total and Term-seq tracks represent an overlay of two biological replicates. Read count ranges are shown in the top of each frame. The chromosome nucleotide coordinates, relative orientation of the ORF (wide black arrow), dominant 3´ end from Supplementary file 3 (small black arrow) and TSS (green bent arrow) as determined by the ratio of reads between ±TEX tracks, are indicated. (B) Northern analysis of ChiZ and IspZ. Left: the same WT (GSO988) RNA samples used for total RNA-seq and Term-seq in (A). Right: RNA was extracted from WT (GSO982) and Δhfq (GSO954) cells at specific times after dilution of the overnight culture, (60, 150, 210, and 360 min) corresponding to early, middle, and late exponential and stationary phase. The Δhfq strain reaches a lower final OD600, yet exhibits a similar pattern of growth (Melamed et al., 2020). Total RNA was separated on an acrylamide gel, transferred to a membrane and probed for the indicated RNAs (RNAs were probed sequentially on the same membrane). The position of the 100 nt size marker is indicated for ChiZ (the region of the northern below 100 nt is shown for IspZ).
Figure 5—figure supplement 1.
Figure 5—figure supplement 1.. Predicted secondary structures and levels of 5´ derived ChiZ and IspZ sRNAs expressed from plasmids.
Secondary structures of ChiZ (A) and IspZ (B) predicted by sfold (http://sfold.wadsworth.org/cgi-bin/srna.pl; Ding et al., 2004). The base-pairing regions are highlighted in yellow, and predicted Hfq-binding sites (reviewed in Hör et al., 2020) are highlighted in blue. (C) ChiZ levels when expressed from pBR-lacI. RNA was extracted from WT (GSO982) and Δhfq (GSO955) cells harboring either the pBR-lacI or pBR-lacI-ChiZ plasmids at 150 min after dilution of the overnight culture. Total RNA was separated on an acrylamide gel, transferred to a membrane and probed for ChiZ. This is an expanded image from the northern blot depicted in Figure 6B. (D) IspZ levels when expressed from pBR. RNA was extracted from WT (GSO982) and Δhfq (GSO955) cells harboring either the pBR or pBR-IspZ plasmids at 150 min after dilution of the overnight culture and 20 min after addition of 0.2 mM H2O2. Total RNA was separated on an acrylamide gel, transferred to a membrane and probed for IspZ. This is an expanded image from the northern blot depicted in Figure 6E (for +H2O2 lanes). Size markers are indicated for all RNAs.
Figure 6.
Figure 6.. 5´ UTR-derived sRNAs ChiZ and IspZ act as sRNA sponges.
(A) Northern analysis for ChiZ in WT (GSO989) and rhoR66S mutant (GSO990) cells. Cells were grown to OD600 ~0.4 or 2.0 after a dilution of the overnight culture. Total RNA was extracted, separated on an acrylamide gel, transferred to a membrane and probed for ChiZ and 5S. This is the same blot depicted in Figure 2F and Figure 2—figure supplement 1C. (B) Northern analysis of ChiZ effect on chiP mRNA. RNA was extracted from WT (GSO982) and Δhfq (GSO955) cells at 150 min after dilution of the overnight culture. Total RNA was separated on an acrylamide or agarose gel, transferred to a membrane and probed for the indicated RNAs (RNAs were probed sequentially on the same membrane). (C) β-galactosidase activity for chiP translational fusions to lacZ in WT (DJS2979) and ΔchiX (DJS2991) strains. Cells were grown and assayed 150 min after dilution of the overnight culture (see Materials and methods for details). Values represent the mean of three independent replicates (indicated by black dots). Error bars represent one standard deviation from the mean. (D) Model of ChiZ effects on ChiX, with indirect effects on the chiP mRNA. ChiZ (derived from the 5´ end of chiP) is blue and ChiX is red. (E) Northern analysis of IspZ effect on OxyS upon oxidative stress. WT (GSO982) and Δhfq (GSO955) cells were grown for 150 min after dilution of the overnight culture, and WT (-H2O2) samples were collected. To induce OxyS, 0.2 mM H2O2 was spiked into the cultures for 20 min, and WT and Δhfq samples were collected. Total RNA was extracted and separated on an acrylamide gel, transferred to a membrane and probed for the indicated RNAs (RNAs were probed sequentially on the same membrane). (F) Predicted base pairing between IspZ and OxyS with mutations assayed. (G) Test of direct interaction between IspZ and OxyS. RNA was extracted from WT (GSO982) and oxyS-M1 (GSO996) cells transformed with the pBR plasmids at 150 min after dilution of the overnight culture and 20 min incubation with 0.2 mM H2O2. Northern analysis was performed on total RNA as in (E). A smaller processed product was detected for the chromosomal OxyS-M1mutant, possibly due to secondary structural changes brought about by the M1 mutation.
Figure 7.
Figure 7.. Detection of ORF-internal sRNAs.
(A) RNA-seq screenshots of the ftsI, aceK, rlmD, mglC, and ampG mRNAs containing putative internal (int) sRNAs. Sequencing reads from the LB 0.4 dRNA-seq (Thomason et al., 2015, HS2 samples), total RNA-seq and Term-seq are displayed. Total RNA-seq and Term-seq tracks represent an overlay of two biological replicates. Read count ranges are shown in the top of each frame. The chromosome nucleotide coordinates, relative orientation of ORFs (wide black arrows), dominant 3´ end from Supplementary file 3 (small black arrows labeled 3´ ends), and TSS (green bent arrows) or 5´ processed end (small black arrow labeled 5´ ends) as determined by the ratio of reads between ±TEX tracks, are indicated. (B) Northern analysis of ORF-internal sRNAs. Left: the same WT (GSO988) RNA samples used for total RNA-seq and Term-seq in (A); this is the same blot as depicted in Figure 5B. Right: the same WT (GSO982) and Δhfq (GSO954) RNA samples collected from cells at specific times after dilution of the overnight culture, (60, 150, 210, and 360 min) corresponding to early, middle, and late exponential and stationary phase as in Figure 5B (same blot with RNAs probed sequentially on the same membrane). Size markers are indicated for all RNAs (the region of the northern below 100 nt is shown for ampG int).
Figure 8.
Figure 8.. ORF-internal sRNA FtsO acts as a sponge of the RybB sRNA.
(A) RIL-seq screenshot showing RybB chimeras at the ftsO locus. Data are from Hfq-FLAG LB RIL-seq performed 150 min after a dilution of the overnight culture, (Melamed et al., 2020, RIL-seq experiment 2). Top: signals for total RNA (dark gray) and Hfq RIL-seq single fragments with two biological repeats overlaid (light gray). Read count ranges are shown in the upper left of each frame. Bottom: chimeras with FtsO, blue lines indicate FtsO is the second RNA in the chimera. (B) RybB and CpxQ levels decrease in the presence of FtsO. RNA was extracted from WT (GSO982) and Δhfq (GSO954) cells transformed with the indicated pBR plasmids at 150 and 360 min after dilution of the overnight culture. Total RNA was separated on an acrylamide gel, transferred to a membrane and probed for the indicated RNAs (RNAs were probed sequentially on the same membrane). (C) Predicted base pairing between FtsO and RybB with mutations assayed. (D) Test of direct interaction between FtsO and RybB. RNA was extracted from WT (GSO982) and rybB-M3 (GSO997) cells transformed with the indicated pBR plasmids at 360 min after dilution of the overnight culture. Northern analysis was performed on total RNA as in (B). (E) Chromosomally-encoded FtsO mutant dysregulates RybB levels under membrane stress. WT tetR (GSO998) and ftsO-M3 tetR (GSO999) cells were grown for 120 min after dilution of the overnight culture prior to the addition of EtOH to a final concentration of 5%. Cells were collected and extracted for RNA at the indicated time points after addition of EtOH. Northern analysis was performed on total RNA separated on either acrylamide or agarose gels as in Figure 4B and C. (F) Model showing how same DNA sequence can encode two different gene products. The ftsI mRNA encodes the essential FtsI protein, found in the inner membrane (IM). This transcript also encodes the FtsO sRNA (blue), which blocks the activity of the RybB sRNA (red), induced by cell envelope stress, to down-regulate the synthesis of outer membrane (OM) porins such as OmpC.
Figure 8—figure supplement 1.
Figure 8—figure supplement 1.. FtsO and RbsZ sponging induces ompC levels and RybB reciprocally affects FtsO.
(A) Northern analysis showing reciprocal effect of RybB on FtsO. RNA was extracted from WT (GSO982) cells harboring either the pBR or pBR-RybB at 150 and 360 min after dilution of the overnight culture. (B) Northern analysis examining RybB RNA, ompC mRNA and OmpC protein levels upon FtsO or RbsZ overexpression. RNA was extracted from WT (GSO982) cells harboring either the pBR, pBR-FtsO, or pBR-RbsZ plasmids at 360 min after dilution of the overnight culture. (C) Chromosomally encoded FtsO mutant dysregulates RybB levels under membrane stress. WT tetR (GSO998) and ftsO-M3 tetR (GSO999) cells were grown for 120 min after dilution of the overnight culture prior to the addition of EtOH to a final concentration of 5%. Cells were collected and extracted for RNA at the indicated time points after addition of EtOH. For all panels, Northern analysis was performed on total RNA separated on either acrylamide or agarose gels, transferred to a membrane and probed for the indicated RNAs (RNAs were probed sequentially on the same membrane).
Figure 8—figure supplement 2.
Figure 8—figure supplement 2.. Co-conservation of ftsO and RybB.
(A) Histogram of percent nucleotide sequence identity at wobble positions across the ftsI gene. Clustal (Madeira et al., 2019) was used to align the following species against the E. coli K12 MG1655 (GCF_002058765.1) reference strain: Shigella sp. PAMC 28760 (GCF_001596115.1), Salmonella enterica (GCF_000007545.1), Citrobacter freundii (GCF_002211705.1), Kluyvera ascorbata (GCF_000735365.1), Leclercia adecarboxylata (GCF_001518835.1), Enterobacter cloacae (GCF_001922365.1), Lelliottia sp. PFL01 (GCF_002271215.1), Klebsiella pneumoniae (GCF_000240185.1), Raoultella ornithinolytica (GCF_002214825.1), Cedecea neteri (GCF_000758325.1), Kosakonia oryzae (GCF_900168185.1), Cronobacter malonaticus (GCF_000504545.1), Pluralibacter gergoviae (GCF_000757785.1), Edwardsiella ictaluri (GCF_003054425.1), Gibbsiella quercinecans (GCF_002291425.1), Buttiauxella agrestis (GCF_000735355.1) and Yersinia pestis (GCF_000970105.1). Percent nucleotide sequence identity was calculated by comparing each wobble position of the E. coli sequence to aligned positions in sequences from other species. Gray bars indicate positions corresponding to the ftsI open reading frame from E. coli with overlaid black bars marking the position of ftsO. (B) Conservation of base pairing between RybB and FtsO for same species as in (A). Region of predicted base pairing was extracted from each sequence and aligned by eye. Nucleotides that are predicted to pair are underlined, and nucleotides that differ are in red font. The sequence for Escherichia coli is found for nine other species (Shigella sp. PAMC 28760, Salmonella enterica, Citrobacter freundii, Kluyvera ascorbata, Leclercia adecarboxylata, Enterobacter cloacae, Klebsiella pneumoniae, Raoultella ornithinolytica and Pluralibacter gergoviae). The sequence found in Gibbsiella quercinecans is also found in Yersinia pestis, and the sequence found in Buttiauxella agrestis is also found in Cronobacter malonaticus. (C) Secondary structure of FtsO predicted by sfold (http://sfold.wadsworth.org/cgi-bin/srna.pl; Ding et al., 2004). The base-pairing region is highlighted in yellow and a predicted Hfq-binding site (reviewed in Hör et al., 2020) is highlighted in blue.
Author response image 1.

Similar articles

Cited by

References

    1. Adams PP, Flores Avile C, Popitsch N, Bilusic I, Schroeder R, Lybecker M, Jewett MW. In vivo expression technology and 5' end mapping of the Borrelia burgdorferi transcriptome identify novel RNAs expressed during mammalian infection. Nucleic Acids Research. 2017;45:775–792. doi: 10.1093/nar/gkw1180. - DOI - PMC - PubMed
    1. Adams PP. termseq-peaks. swh:1:dir:1b9837a92dc90b4ea5d388fff43f5467a21c3b6eSoftware Heritage. 2020 https://archive.softwareheritage.org/swh:1:dir:1b9837a92dc90b4ea5d388fff...
    1. Adams PP, Storz G. Prevalence of small base-pairing RNAs derived from diverse genomic loci. Biochimica Et Biophysica Acta (BBA) - Gene Regulatory Mechanisms. 2020;1863:194524. doi: 10.1016/j.bbagrm.2020.194524. - DOI - PMC - PubMed
    1. Altuvia S, Weinstein-Fischer D, Zhang A, Postow L, Storz G. A small, stable RNA induced by oxidative stress: role as a pleiotropic regulator and antimutator. Cell. 1997;90:43–53. doi: 10.1016/S0092-8674(00)80312-8. - DOI - PubMed
    1. Apfel CM, Takács B, Fountoulakis M, Stieger M, Keck W. Use of genomics to identify bacterial undecaprenyl pyrophosphate synthetase: cloning, expression, and characterization of the essential uppS gene. Journal of Bacteriology. 1999;181:483–492. doi: 10.1128/JB.181.2.483-492.1999. - DOI - PMC - PubMed

Publication types

MeSH terms

LinkOut - more resources