

Characterisation of the first 250,000 hospital admissions for COVID-19 in Brazil: a retrospective analysis of nationwide data
- PMID: 33460571
- PMCID: PMC7834889
- DOI: 10.1016/S2213-2600(20)30560-9
Characterisation of the first 250,000 hospital admissions for COVID-19 in Brazil: a retrospective analysis of nationwide data
Abstract
Background: Most low-income and middle-income countries (LMICs) have little or no data integrated into a national surveillance system to identify characteristics or outcomes of COVID-19 hospital admissions and the impact of the COVID-19 pandemic on their national health systems. We aimed to analyse characteristics of patients admitted to hospital with COVID-19 in Brazil, and to examine the impact of COVID-19 on health-care resources and in-hospital mortality.
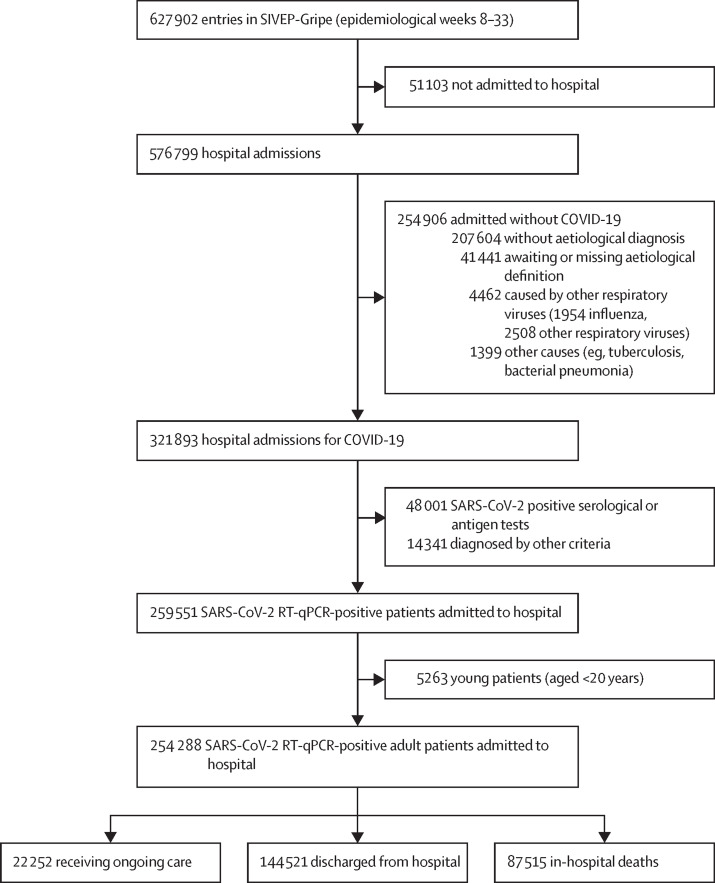
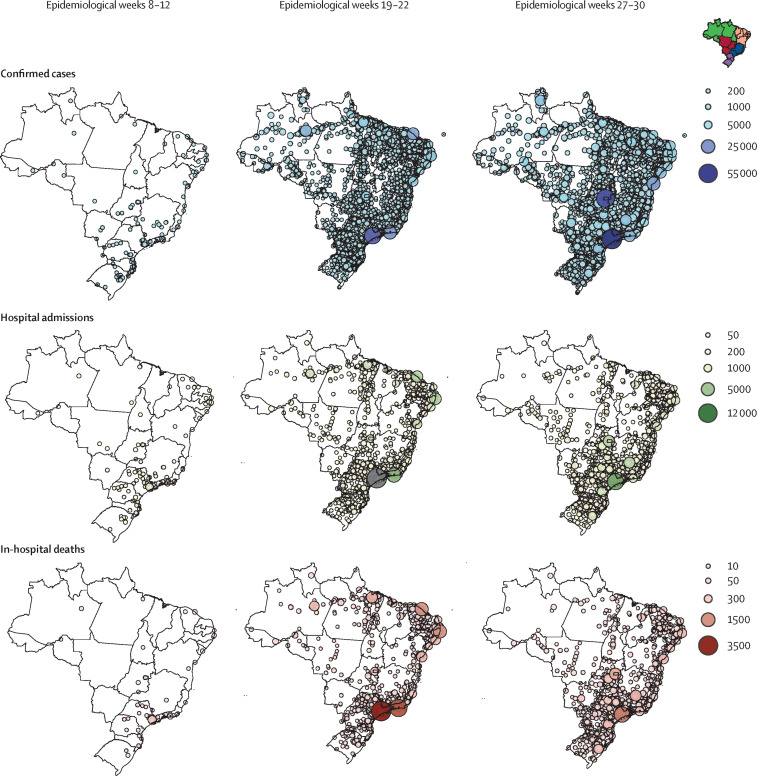
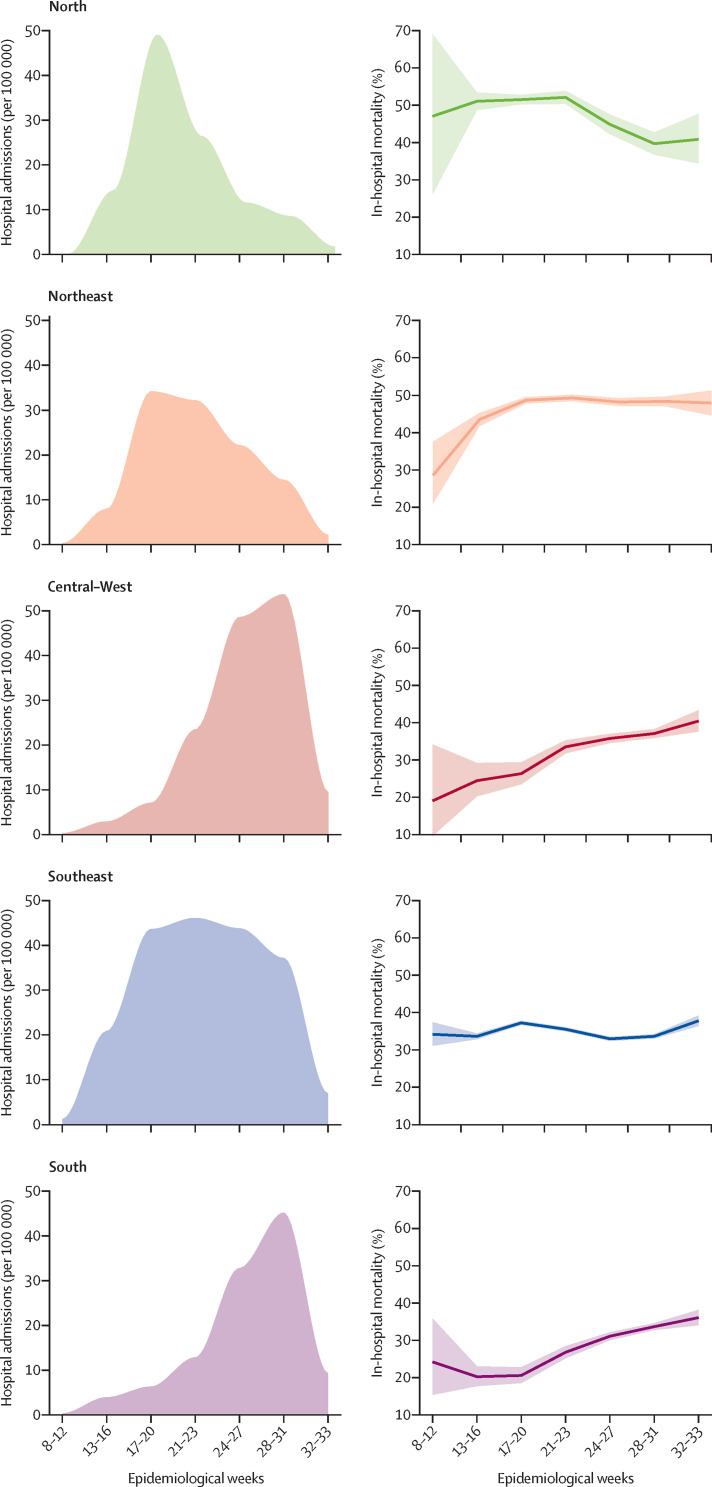
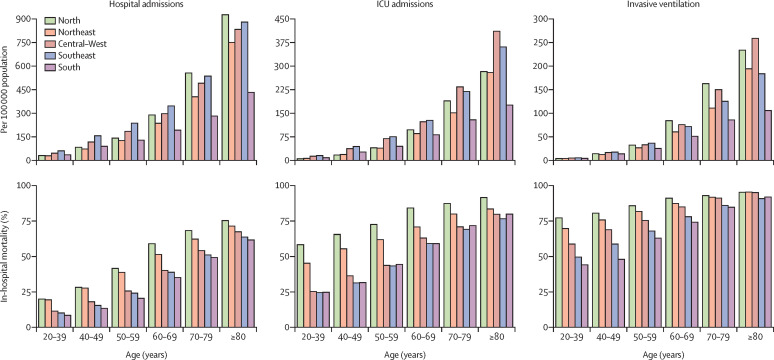
Methods: We did a retrospective analysis of all patients aged 20 years or older with quantitative RT-PCR (RT-qPCR)-confirmed COVID-19 who were admitted to hospital and registered in SIVEP-Gripe, a nationwide surveillance database in Brazil, between Feb 16 and Aug 15, 2020 (epidemiological weeks 8-33). We also examined the progression of the COVID-19 pandemic across three 4-week periods within this timeframe (epidemiological weeks 8-12, 19-22, and 27-30). The primary outcome was in-hospital mortality. We compared the regional burden of hospital admissions stratified by age, intensive care unit (ICU) admission, and respiratory support. We analysed data from the whole country and its five regions: North, Northeast, Central-West, Southeast, and South.
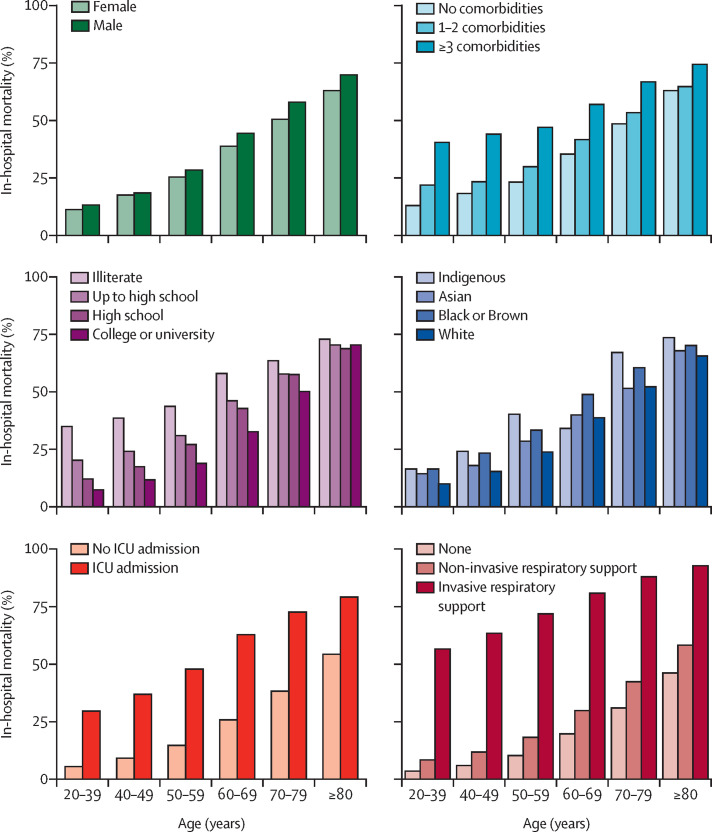
Findings: Between Feb 16 and Aug 15, 2020, 254 288 patients with RT-qPCR-confirmed COVID-19 were admitted to hospital and registered in SIVEP-Gripe. The mean age of patients was 60 (SD 17) years, 119 657 (47%) of 254 288 were aged younger than 60 years, 143 521 (56%) of 254 243 were male, and 14 979 (16%) of 90 829 had no comorbidities. Case numbers increased across the three 4-week periods studied: by epidemiological weeks 19-22, cases were concentrated in the North, Northeast, and Southeast; by weeks 27-30, cases had spread to the Central-West and South regions. 232 036 (91%) of 254 288 patients had a defined hospital outcome when the data were exported; in-hospital mortality was 38% (87 515 of 232 036 patients) overall, 59% (47 002 of 79 687) among patients admitted to the ICU, and 80% (36 046 of 45 205) among those who were mechanically ventilated. The overall burden of ICU admissions per ICU beds was more pronounced in the North, Southeast, and Northeast, than in the Central-West and South. In the Northeast, 1545 (16%) of 9960 patients received invasive mechanical ventilation outside the ICU compared with 431 (8%) of 5388 in the South. In-hospital mortality among patients younger than 60 years was 31% (4204 of 13 468) in the Northeast versus 15% (1694 of 11 196) in the South.
Interpretation: We observed a widespread distribution of COVID-19 across all regions in Brazil, resulting in a high overall disease burden. In-hospital mortality was high, even in patients younger than 60 years, and worsened by existing regional disparities within the health system. The COVID-19 pandemic highlights the need to improve access to high-quality care for critically ill patients admitted to hospital with COVID-19, particularly in LMICs.
Funding: National Council for Scientific and Technological Development (CNPq), Coordinating Agency for Advanced Training of Graduate Personnel (CAPES), Carlos Chagas Filho Foundation for Research Support of the State of Rio de Janeiro (FAPERJ), and Instituto de Salud Carlos III.
Copyright © 2021 Elsevier Ltd. All rights reserved.
Figures
Comment in
-
Trends in COVID-19-related in-hospital mortality: lessons learned from nationwide samples.Lancet Respir Med. 2021 Apr;9(4):322-324. doi: 10.1016/S2213-2600(21)00080-1. Epub 2021 Feb 15. Lancet Respir Med. 2021. PMID: 33600776 Free PMC article. No abstract available.
References
Publication types
MeSH terms
LinkOut - more resources
Full Text Sources
Other Literature Sources
Medical
