

Retrospective motion artifact correction of structural MRI images using deep learning improves the quality of cortical surface reconstructions
- PMID: 33460797
- PMCID: PMC8044025
- DOI: 10.1016/j.neuroimage.2021.117756
Retrospective motion artifact correction of structural MRI images using deep learning improves the quality of cortical surface reconstructions
Abstract
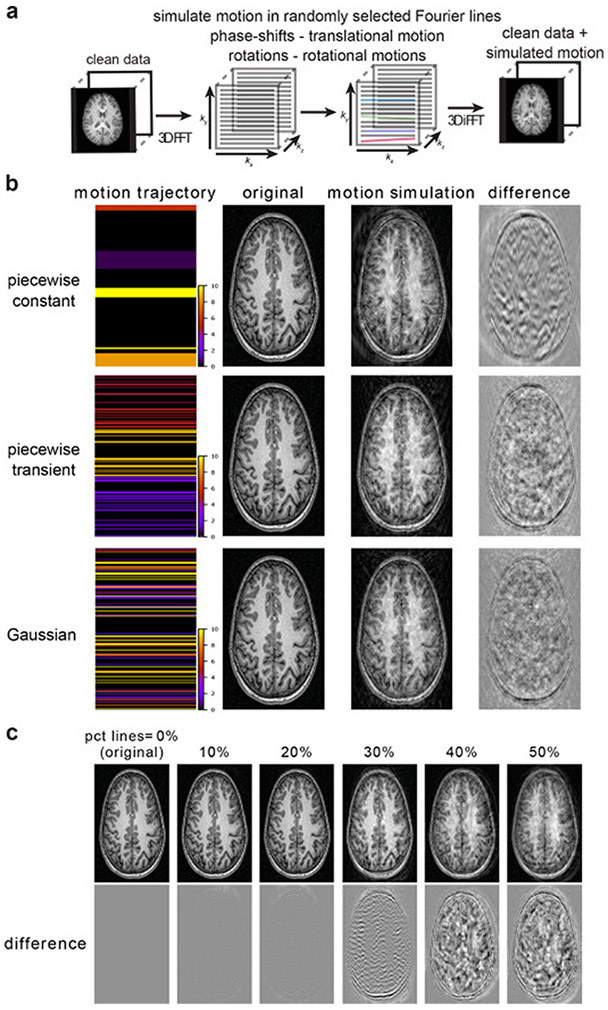
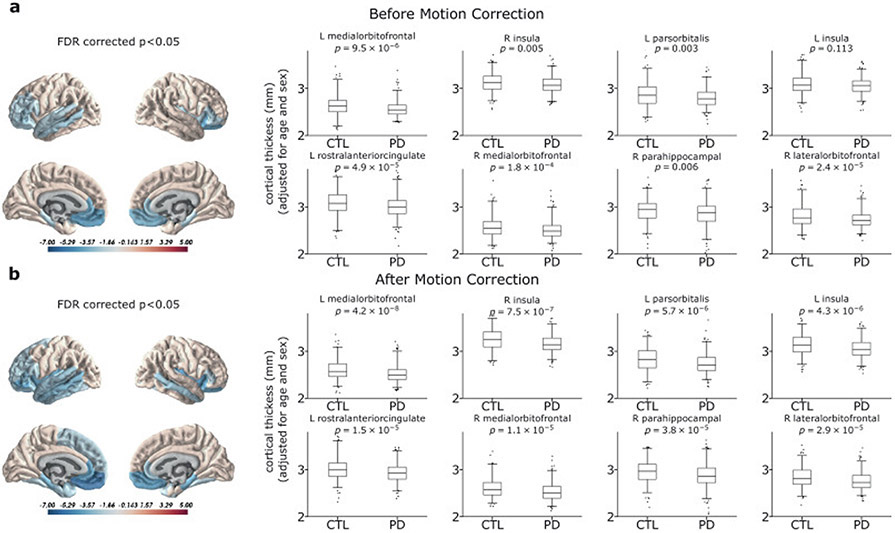
Head motion during MRI acquisition presents significant challenges for neuroimaging analyses. In this work, we present a retrospective motion correction framework built on a Fourier domain motion simulation model combined with established 3D convolutional neural network (CNN) architectures. Quantitative evaluation metrics were used to validate the method on three separate multi-site datasets. The 3D CNN was trained using motion-free images that were corrupted using simulated artifacts. CNN based correction successfully diminished the severity of artifacts on real motion affected data on a separate test dataset as measured by significant improvements in image quality metrics compared to a minimal motion reference image. On the test set of 13 image pairs, the mean peak signal-to-noise-ratio was improved from 31.7 to 33.3 dB. Furthermore, improvements in cortical surface reconstruction quality were demonstrated using a blinded manual quality assessment on the Parkinson's Progression Markers Initiative (PPMI) dataset. Upon applying the correction algorithm, out of a total of 617 images, the number of quality control failures was reduced from 61 to 38. On this same dataset, we investigated whether motion correction resulted in a more statistically significant relationship between cortical thickness and Parkinson's disease. Before correction, significant cortical thinning was found to be restricted to limited regions within the temporal and frontal lobes. After correction, there was found to be more widespread and significant cortical thinning bilaterally across the temporal lobes and frontal cortex. Our results highlight the utility of image domain motion correction for use in studies with a high prevalence of motion artifacts, such as studies of movement disorders as well as infant and pediatric subjects.
Keywords: Cortical surface; Cortical thickness; Image quality; Motion artifact; Parkinson's disease; T1.
Copyright © 2021. Published by Elsevier Inc.
Figures


Similar articles
-
MRI motion artifact reduction using a conditional diffusion probabilistic model (MAR-CDPM).Med Phys. 2024 Apr;51(4):2598-2610. doi: 10.1002/mp.16844. Epub 2023 Nov 27. Med Phys. 2024. PMID: 38009583
-
Unsupervised motion artifact correction of turbo spin-echo MRI using deep image prior.Magn Reson Med. 2024 Jul;92(1):28-42. doi: 10.1002/mrm.30026. Epub 2024 Jan 28. Magn Reson Med. 2024. PMID: 38282279
-
Automatic MR image quality evaluation using a Deep CNN: A reference-free method to rate motion artifacts in neuroimaging.Comput Med Imaging Graph. 2021 Jun;90:101897. doi: 10.1016/j.compmedimag.2021.101897. Epub 2021 Mar 11. Comput Med Imaging Graph. 2021. PMID: 33770561
-
Deep learning methods for 3D magnetic resonance image denoising, bias field and motion artifact correction: a comprehensive review.Phys Med Biol. 2024 Nov 28;69(23). doi: 10.1088/1361-6560/ad94c7. Phys Med Biol. 2024. PMID: 39569887 Review.
-
CT artifact correction for sparse and truncated projection data using generative adversarial networks.Med Phys. 2021 Feb;48(2):615-626. doi: 10.1002/mp.14504. Epub 2020 Dec 30. Med Phys. 2021. PMID: 32996149 Review.
Cited by
-
A Hierarchical Graph Learning Model for Brain Network Regression Analysis.Front Neurosci. 2022 Jul 12;16:963082. doi: 10.3389/fnins.2022.963082. eCollection 2022. Front Neurosci. 2022. PMID: 35903810 Free PMC article.
-
Simulating rigid head motion artifacts on brain magnitude MRI data-Outcome on image quality and segmentation of the cerebral cortex.PLoS One. 2024 Apr 16;19(4):e0301132. doi: 10.1371/journal.pone.0301132. eCollection 2024. PLoS One. 2024. PMID: 38626138 Free PMC article.
-
The Future of Artificial Intelligence in Clinical Radiology: Savior or False Hope?AJNR Am J Neuroradiol. 2024 Dec 9;45(12):1838-1844. doi: 10.3174/ajnr.A8550. AJNR Am J Neuroradiol. 2024. PMID: 39653448 No abstract available.
-
MRI motion correction via efficient residual-guided denoising diffusion probabilistic models.ArXiv [Preprint]. 2025 May 6:arXiv:2505.03498v1. ArXiv. 2025. PMID: 40386577 Free PMC article. Preprint.
-
Swin Transformer and the Unet Architecture to Correct Motion Artifacts in Magnetic Resonance Image Reconstruction.Int J Biomed Imaging. 2024 May 2;2024:8972980. doi: 10.1155/2024/8972980. eCollection 2024. Int J Biomed Imaging. 2024. PMID: 38725808 Free PMC article.
References
-
- Abadi M, Agarwal A, Barham P, Brevdo E, Chen Z, Citro C, Corrado GS, Davis A, Dean J, Devin M, Ghemawat S, Goodfellow I, Harp A, Irving G, Isard M, Jia Y, Jozefowicz R, Kaiser L, Kudlur M, Levenberg J, Mane D, Monga R, Moore S, Murray D, Olah C, Schuster M, Shlens J, Steiner B, Sutskever I, Talwar K, Tucker P, Vanhoucke V, Vasudevan V, Viegas F, Vinyals O, Warden P, Wattenberg M, Wicke M, Yu Y, Zheng X 2016. TensorFlow: Large-Scale Machine Learning on Heterogeneous Distributed Systems.
-
- Atkinson D, Hill DLG, Stoyle PNR, Summers PE, Keevil SF 1997. Automatic correction of motion artifacts in magnetic resonance images using an entropy focus criterion. IEEE Transactions on Medical Imaging, 16(6), 903–910. - PubMed
-
- Barnett AH, Magland JF, Klinteberg L.a. 2018. A parallel non-uniform fast Fourier transform library based on an" exponential of semicircle" kernel. arXivpreprint arXiv: 1808.06736.
-
- Çiçek Ö, Abdulkadir A, Lienkamp SS, Brox T, Ronneberger O 2016. 3D U-Net: learning dense volumetric segmentation from sparse annotation. International conference on medical image computing and computer-assisted intervention. Springer, pp. 424–432.
Publication types
MeSH terms
Grants and funding
LinkOut - more resources
Full Text Sources
Other Literature Sources
Medical
Miscellaneous
