

Age and gender-specific hepatitis C continuum of care and predictors of direct acting antiviral treatment among persons who inject drugs in Seattle, Washington
- PMID: 33461152
- PMCID: PMC7938869
- DOI: 10.1016/j.drugalcdep.2021.108525
Age and gender-specific hepatitis C continuum of care and predictors of direct acting antiviral treatment among persons who inject drugs in Seattle, Washington
Abstract
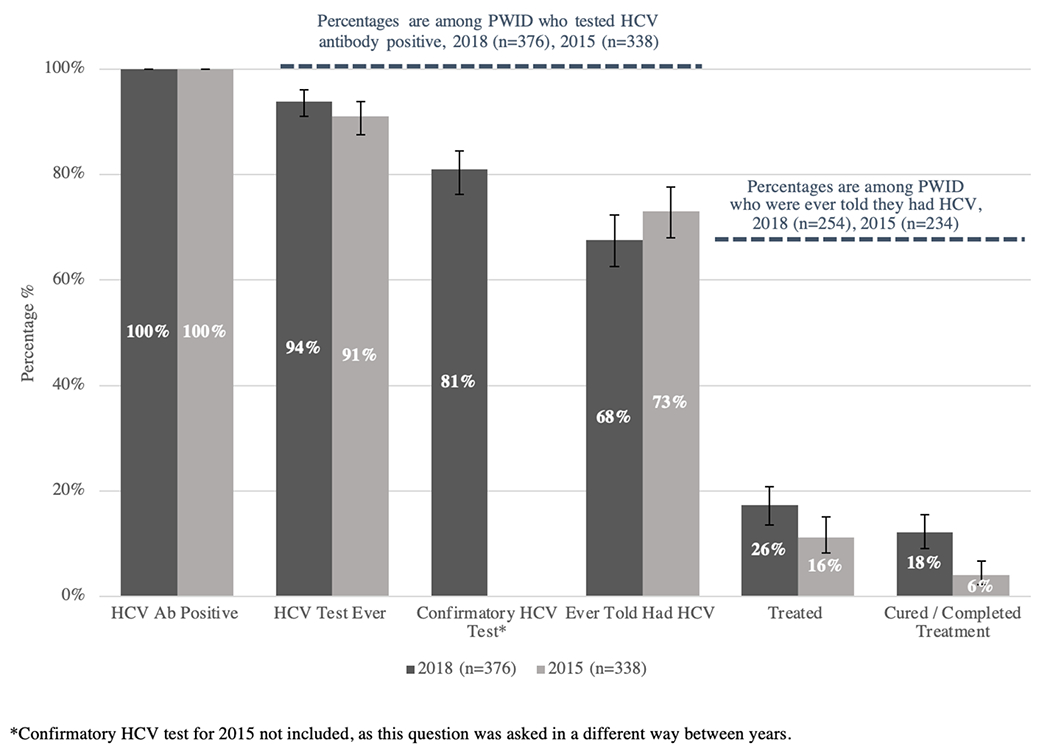
Background: Direct acting antivirals (DAAs) have revolutionized management of hepatitis C virus (HCV), but treatment uptake remains low among persons who inject drugs (PWID). We report the continuum of care for HCV and describe predictors of treatment with DAAs among PWID in Seattle.
Methods: We analyzed data from the 2018 Seattle area National HIV Behavioral Surveillance (NHBS) survey of PWID. Persons ≥18 years of age who injected drugs in the past year and completed the core NHBS survey, a local survey supplement, and rapid HCV antibody testing were included. Among those who screened HCV antibody positive, we calculated proportions and 95 % confidence intervals for self-reported steps along the HCV care continuum. Multivariable logistic regression was used to calculate the adjusted odds (AOR) of having received DAA therapy.
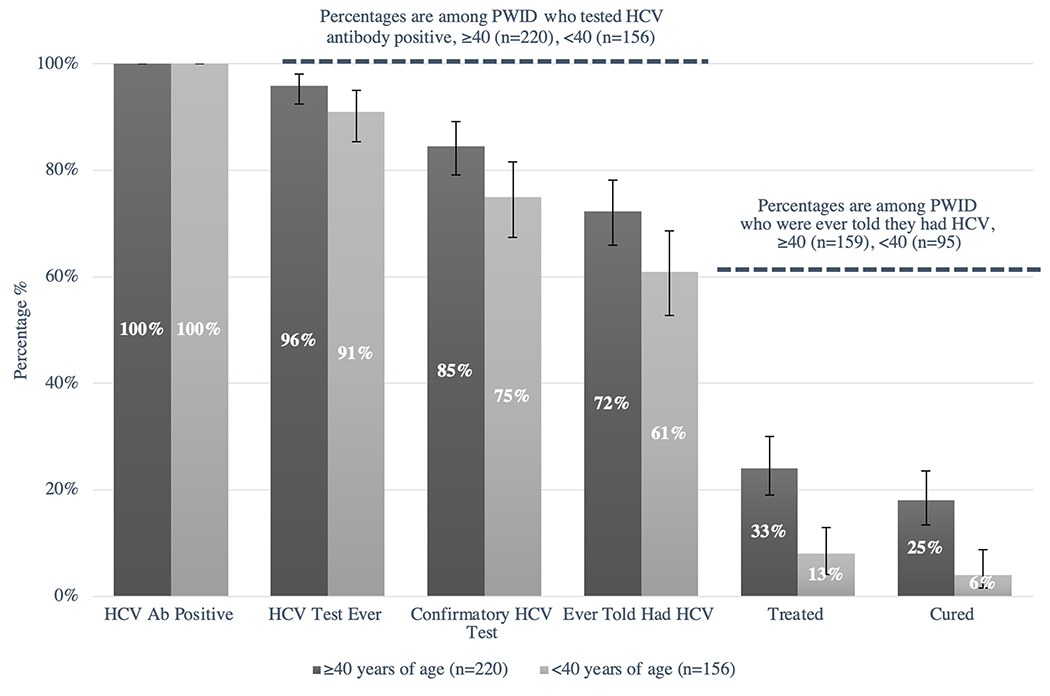
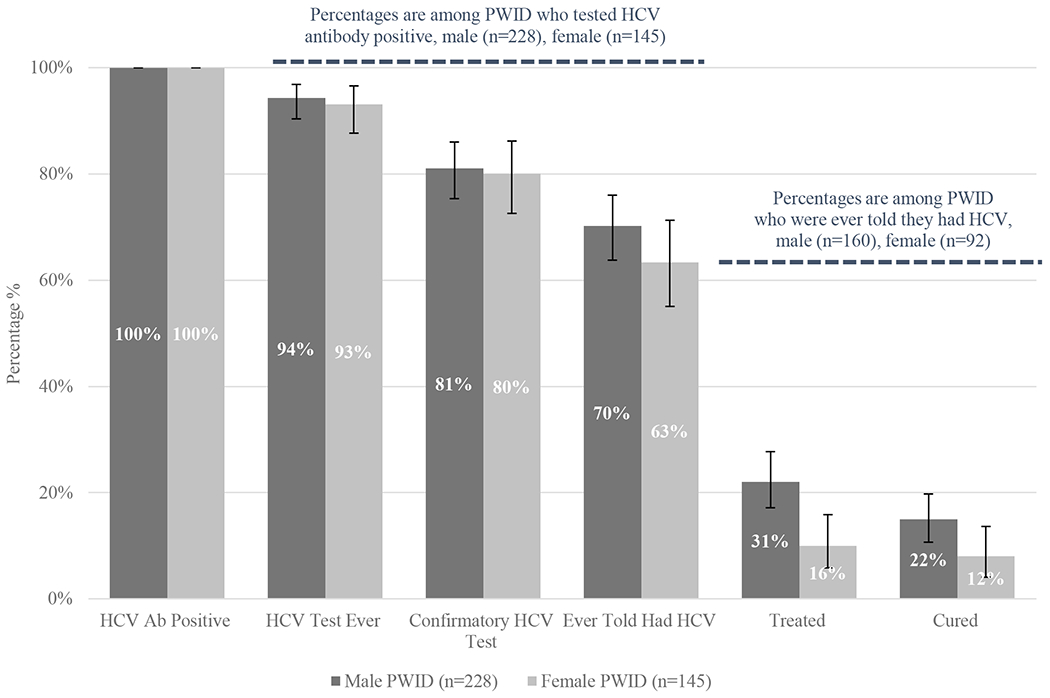
Results: The sample included 533 PWID, 376 (71 %) of whom tested positive for antibodies to HCV. Among those who were HCV antibody positive, 94 % reported any prior HCV test, 81 % reported a prior confirmatory test, and 68 % reported a prior HCV diagnosis. Of those diagnosed, 26 % had undergone treatment and 18 % had been cured. In a multivariate model, being one year older (AOR 1.05 per year, 1.01-1.08) was predictive of DAA treatment, while homelessness (AOR 0.39, 0.19-0.80) and female gender (AOR 0.36, 0.16-0.78) were associated with a lower odds of DAA therapy.
Conclusions: Despite widespread HCV testing among PWID in Seattle, treatment uptake remains low in the DAA era. In particular, treatment of women, younger adults and persons living homeless is lagging behind.
Keywords: Continuum of care; DAA therapy; Hepatitis c; People who inject drugs.
Copyright © 2021 Elsevier B.V. All rights reserved.
Figures
Similar articles
-
Hepatitis C continuum of care and utilization of healthcare and harm reduction services among persons who inject drugs in Seattle.Drug Alcohol Depend. 2019 Feb 1;195:114-120. doi: 10.1016/j.drugalcdep.2018.11.026. Epub 2018 Dec 26. Drug Alcohol Depend. 2019. PMID: 30611979 Free PMC article.
-
'Treat my whole person, not just my condition': qualitative explorations of hepatitis C care delivery preferences among people who inject drugs.Addict Sci Clin Pract. 2021 Aug 12;16(1):52. doi: 10.1186/s13722-021-00260-8. Addict Sci Clin Pract. 2021. PMID: 34384494 Free PMC article.
-
Disparities in uptake of direct-acting antiviral therapy for hepatitis C among people who inject drugs in a Canadian setting.Liver Int. 2019 Aug;39(8):1400-1407. doi: 10.1111/liv.14043. Epub 2019 Feb 24. Liver Int. 2019. PMID: 30653809 Free PMC article.
-
Management of hepatitis C virus/HIV coinfection among people who use drugs in the era of direct-acting antiviral-based therapy.Clin Infect Dis. 2013 Aug;57 Suppl 2(Suppl 2):S118-24. doi: 10.1093/cid/cit326. Clin Infect Dis. 2013. PMID: 23884059 Free PMC article. Review.
-
Integrated models of care for people who inject drugs and live with hepatitis C virus: A systematic review.Int J Drug Policy. 2019 Oct;72:146-159. doi: 10.1016/j.drugpo.2019.05.023. Epub 2019 May 27. Int J Drug Policy. 2019. PMID: 31147142
Cited by
-
Hepatitis C Cascades: Data to Inform Hepatitis C Elimination in the United States.Public Health Rep. 2023 Sep 5:333549231193508. doi: 10.1177/00333549231193508. Online ahead of print. Public Health Rep. 2023. PMID: 37667621 Free PMC article. Review.
-
Hepatitis C treatment outcomes among people who inject drugs experiencing unstable versus stable housing: Systematic review and meta-analysis.PLoS One. 2024 Apr 26;19(4):e0302471. doi: 10.1371/journal.pone.0302471. eCollection 2024. PLoS One. 2024. PMID: 38669250 Free PMC article.
-
Can Telemedicine Optimize the HCV Care Cascade in People Who Use Drugs? Features of an Innovative Decentralization Model and Comparison with Other Micro-Elimination Strategies.Biology (Basel). 2022 May 24;11(6):805. doi: 10.3390/biology11060805. Biology (Basel). 2022. PMID: 35741326 Free PMC article. Review.
-
Timing of hepatitis C treatment initiation and retention in office-based opioid treatment with buprenorphine: a retrospective cohort study.Addict Sci Clin Pract. 2023 May 25;18(1):33. doi: 10.1186/s13722-023-00389-8. Addict Sci Clin Pract. 2023. PMID: 37231486 Free PMC article.
-
Has the HCV cascade of care changed among people who inject drugs in England since the introduction of direct-acting antivirals?Int J Drug Policy. 2024 Jan 12;144(Pt 1):104324. doi: 10.1016/j.drugpo.2024.104324. Online ahead of print. Int J Drug Policy. 2024. PMID: 38218700
References
-
- Afdhal N, Zeuzem S, Kwo P, Chojkier M, Gitlin N, Puoti M, Romero-Gomez M, Zarski JP, Agarwal K, Buggisch P, Foster GR, Bräu N, Buti M, Jacobson IM, Subramanian GM, Ding X, Mo H, Yang JC, Pang PS, Symonds WT, McHutchison JG, Muir AJ, Mangia A, Marcellin P, Investigators, ION-I Investigators, 2014. Ledipasvir and sofosbuvir for untreated HCV genotype 1 infection. N Engl J Med 370, 1889–1898. - PubMed
-
- American Association for the Study of Liver Disease (AASLD), 2019. Infectious Diseases Society of America (IDSA). HCV Guidance: Recommendations for Testing, Managing, and Treating Hepatitis C. https://www.hcvguidelines.org/. (Accessed July 3 2020).
-
- Asselah T, Kowdley KV, Zadeikis N, Wang S, Hassanein T, Horsmans Y, Colombo M, Calinas F, Aguilar H, de Ledinghen V, Mantry PS, Hezode C, Marinho RT, Agarwal K, Nevens F, Elkhashab M, Kort J, Liu R, Ng TI, Krishnan P, Lin CW, Mensa FJ, 2018. Efficacy of Glecaprevir/Pibrentasvir for 8 or 12 Weeks in Patients With Hepatitis C Virus Genotype 2, 4, 5, or 6 Infection Without Cirrhosis. Clin Gastroenterol Hepatol 16, 417–426. - PubMed
Publication types
MeSH terms
Substances
Grants and funding
LinkOut - more resources
Full Text Sources
Other Literature Sources
Medical
Miscellaneous
