

Key microRNAs and hub genes associated with poor prognosis in lung adenocarcinoma
- PMID: 33461176
- PMCID: PMC7906143
- DOI: 10.18632/aging.202337
Key microRNAs and hub genes associated with poor prognosis in lung adenocarcinoma
Abstract
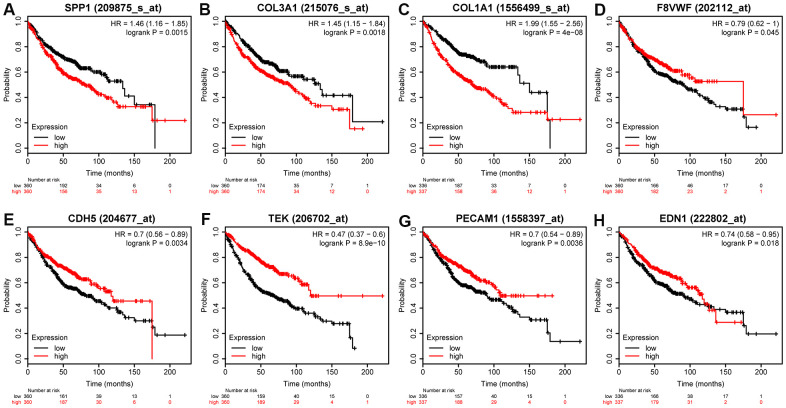
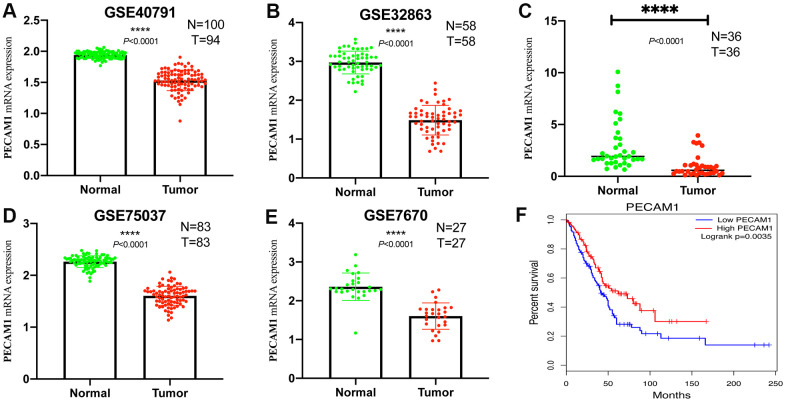
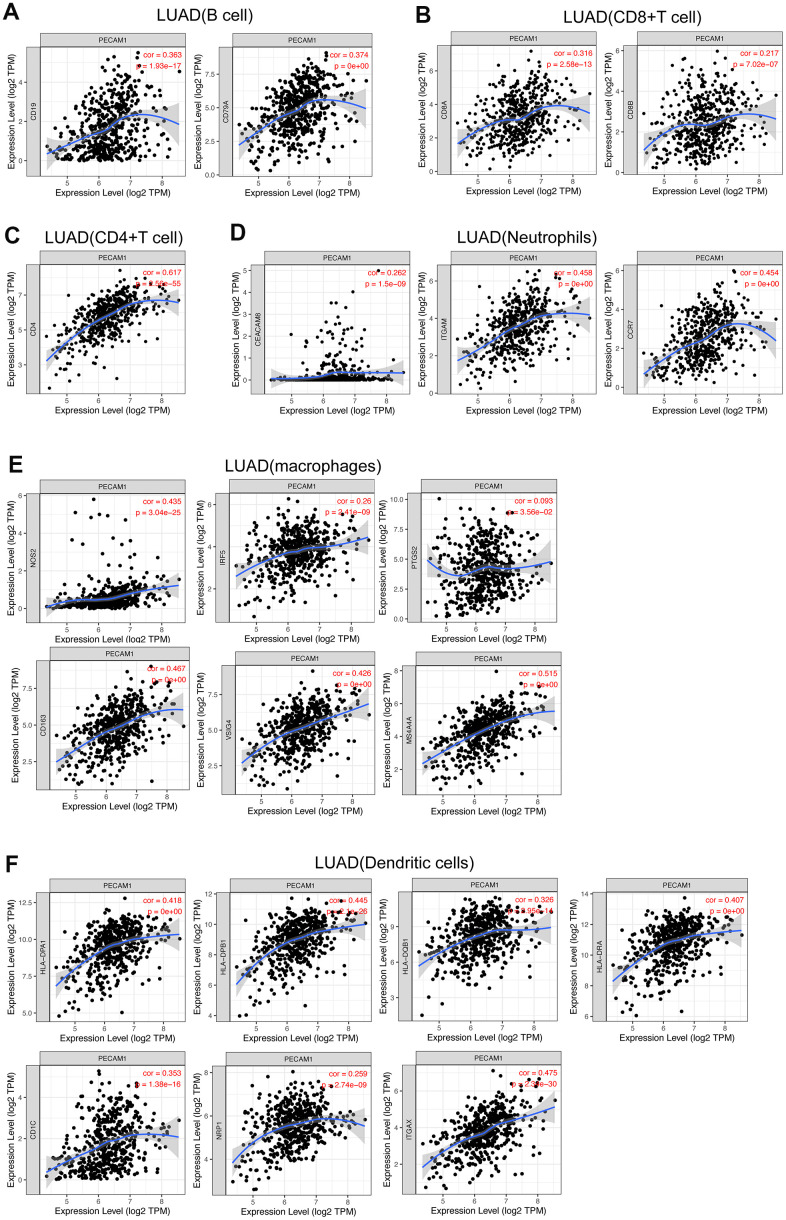
In the study, we obtained 36 pairs of lung adenocarcinoma (LUAD) tissues and adjacent non-tumorous tissues. Then, we chose a specific hub-target gene of miRNA and used qRT-PCR to evaluate the expression of PECAM1. We found that the expression level of PECAM1 mRNA in LUAD was significantly lower than that in adjacent nontumor tissues (P<0.0001). Univariate and multivariate analyses were conducted on 481 LUAD patients from The Cancer Genome Atlas (TCGA) according to the Cox proportional hazard regression model to evaluate the impact of PECAM1 expression and other clinicopathological factors on survival. The results showed that the low expression of PECAM1 was an important independent predictor of poor overall survival (HR, 0.704; 95% CI, 0.518-0.957; P = 0.025). Based on the Tumor Immune Estimation Resource (TIMER) database, the relationship between PECAM1 expression and B cell, CD8+ T cell, CD4+ T cell, macrophage, neutrophil, and dendritic cell infiltration was weak in LUAD (P<0.01). In particular, a more significant positive correlation between PECAM1 expression and HLA-complex members, CD1C, NRP1, and ITGAX expression in dendritic cell was detected in LUAD. The mechanism which PECAM1 involved in the development of LUAD may be closely related to changes in the immune microenvironment.
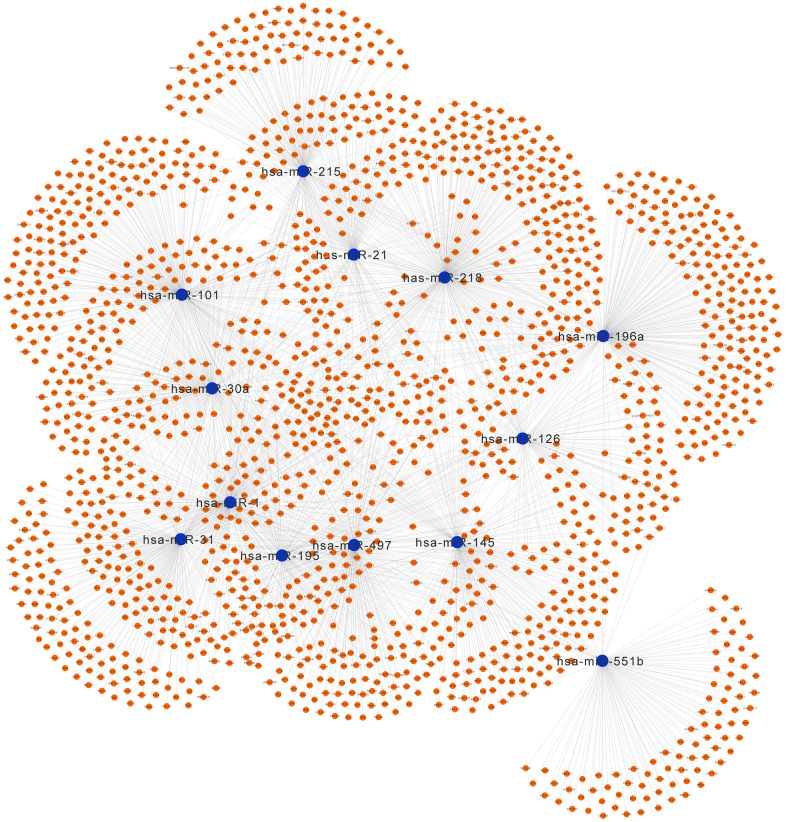
Keywords: PECAM1; differentially expressed genes; differentially expressed miRNAs; lung adenocarcinoma; miRNA-mRNA regulatory network.
Conflict of interest statement
Figures


Similar articles
-
Predictions of the dysregulated competing endogenous RNA signature involved in the progression of human lung adenocarcinoma.Cancer Biomark. 2020;29(3):399-416. doi: 10.3233/CBM-200133. Cancer Biomark. 2020. PMID: 32741804
-
Comprehensive analysis of prognostic biomarkers in lung adenocarcinoma based on aberrant lncRNA-miRNA-mRNA networks and Cox regression models.Biosci Rep. 2020 Jan 31;40(1):BSR20191554. doi: 10.1042/BSR20191554. Biosci Rep. 2020. PMID: 31950990 Free PMC article.
-
Prognostic value and immune infiltration of a novel stromal/immune score-related P2RY12 in lung adenocarcinoma microenvironment.Int Immunopharmacol. 2021 Sep;98:107734. doi: 10.1016/j.intimp.2021.107734. Epub 2021 Jun 25. Int Immunopharmacol. 2021. PMID: 34175738
-
Potential Prognostic Biomarkers of Lung Adenocarcinoma Based on Bioinformatic Analysis.Biomed Res Int. 2021 Jan 14;2021:8859996. doi: 10.1155/2021/8859996. eCollection 2021. Biomed Res Int. 2021. PMID: 33511215 Free PMC article.
-
MiRNAs in Lung Adenocarcinoma: Role, Diagnosis, Prognosis, and Therapy.Int J Mol Sci. 2023 Aug 27;24(17):13302. doi: 10.3390/ijms241713302. Int J Mol Sci. 2023. PMID: 37686110 Free PMC article. Review.
Cited by
-
LINC02126 is a potential diagnostic, prognostic and immunotherapeutic target for lung adenocarcinoma.BMC Pulm Med. 2022 Nov 10;22(1):412. doi: 10.1186/s12890-022-02215-4. BMC Pulm Med. 2022. PMID: 36357869 Free PMC article.
-
Taxifolin Inhibits the Growth of Non-Small-Cell Lung Cancer via Downregulating Genes Displaying Novel and Robust Associations with Immune Evasion Factors.Cancers (Basel). 2023 Sep 30;15(19):4818. doi: 10.3390/cancers15194818. Cancers (Basel). 2023. PMID: 37835514 Free PMC article.
-
The Inflamm-Aging Model Identifies Key Risk Factors in Atherosclerosis.Front Genet. 2022 May 30;13:865827. doi: 10.3389/fgene.2022.865827. eCollection 2022. Front Genet. 2022. PMID: 35706446 Free PMC article.
-
Epigenetic Alterations of DNA Methylation and miRNA Contribution to Lung Adenocarcinoma.Front Genet. 2022 May 31;13:817552. doi: 10.3389/fgene.2022.817552. eCollection 2022. Front Genet. 2022. PMID: 35711943 Free PMC article.
-
Construction of a prognostic signature of autophagy-related lncRNAs in non-small-cell lung cancer.BMC Cancer. 2021 Aug 14;21(1):921. doi: 10.1186/s12885-021-08654-2. BMC Cancer. 2021. PMID: 34391383 Free PMC article.
References
-
- Du R, Shen W, Liu Y, Gao W, Zhou W, Li J, Zhao S, Chen C, Chen Y, Liu Y, Sun P, Xiang R, Shi Y, Luo Y. TGIF2 promotes the progression of lung adenocarcinoma by bridging EGFR/RAS/ERK signaling to cancer cell stemness. Signal Transduct Target Ther. 2019; 4:60. 10.1038/s41392-019-0098-x - DOI - PMC - PubMed
-
- Alshamsan A, Khan S, Imran A, Aljuffali IA, Alsaleh K. Prediction of Chlamydia pneumoniae protein localization in host mitochondria and cytoplasm and possible involvements in lung cancer etiology: a computational approach. Saudi Pharm J. 2017; 25:1151–57. 10.1016/j.jsps.2017.05.007 - DOI - PMC - PubMed
Publication types
MeSH terms
Substances
LinkOut - more resources
Full Text Sources
Other Literature Sources
Medical
Research Materials
Miscellaneous
