. 2021 Feb;590(7845):284-289.
doi: 10.1038/s41586-021-03198-8. Epub 2021 Jan 18.

Giant lungfish genome elucidates the conquest of land by vertebrates

Affiliations

Giant lungfish genome elucidates the conquest of land by vertebrates

Axel Meyer et al. Nature. 2021 Feb.

Abstract

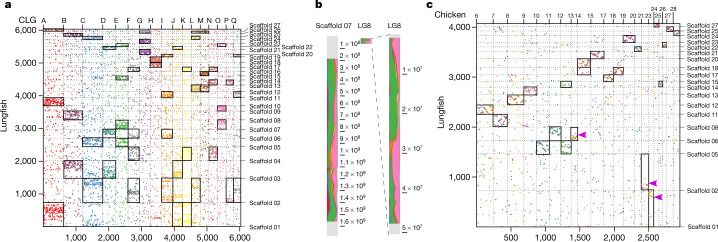
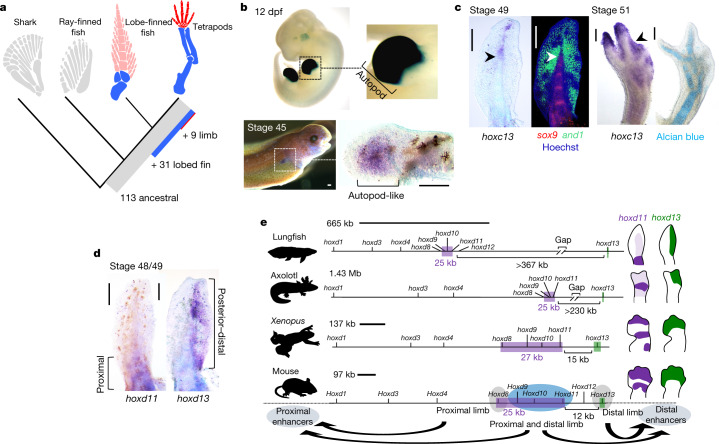
Lungfishes belong to lobe-fined fish (Sarcopterygii) that, in the Devonian period, 'conquered' the land and ultimately gave rise to all land vertebrates, including humans1-3. Here we determine the chromosome-quality genome of the Australian lungfish (Neoceratodus forsteri), which is known to have the largest genome of any animal. The vast size of this genome, which is about 14× larger than that of humans, is attributable mostly to huge intergenic regions and introns with high repeat content (around 90%), the components of which resemble those of tetrapods (comprising mainly long interspersed nuclear elements) more than they do those of ray-finned fish. The lungfish genome continues to expand independently (its transposable elements are still active), through mechanisms different to those of the enormous genomes of salamanders. The 17 fully assembled lungfish macrochromosomes maintain synteny to other vertebrate chromosomes, and all microchromosomes maintain conserved ancient homology with the ancestral vertebrate karyotype. Our phylogenomic analyses confirm previous reports that lungfish occupy a key evolutionary position as the closest living relatives to tetrapods4,5, underscoring the importance of lungfish for understanding innovations associated with terrestrialization. Lungfish preadaptations to living on land include the gain of limb-like expression in developmental genes such as hoxc13 and sall1 in their lobed fins. Increased rates of evolution and the duplication of genes associated with obligate air-breathing, such as lung surfactants and the expansion of odorant receptor gene families (which encode proteins involved in detecting airborne odours), contribute to the tetrapod-like biology of lungfishes. These findings advance our understanding of this major transition during vertebrate evolution.


Conflict of interest statement

The authors declare no competing interests.

Figures

Fig. 1
Fig. 1. Bayesian phylogeny based on 697 one-to-one orthologues.
This analysis used the CAT-GTR model in PhyloBayes MPI. All branches were supported by posterior probabilities of 1. The protein and a noncoding conserved genomic element datasets (Extended Data Fig. 3a) recovered identical and highly supported vertebrate relationships (posterior probability = 1.0 and 100% bootstrap for all branches). Scale bar is expected amino acid replacements per site.
Fig. 2
Fig. 2. Conserved synteny and chromosomal expansion in lungfish.
a, Mapping of CLGs onto lungfish chromosomes. Orthologous gene family numbers are shown. Each dot represents an orthologous gene family, CLGs are as previously defined. Scaffolds 01–17 represent lungfish macrochromosomes, and scaffolds 18–27 represent microchromosomes. Significantly enriched CLGs on lungfish chromosomes indicated by rectangles (for raw data, see Extended Data Fig. 4f). b, Expansion of homologous chromosomes in lungfish (left), compared to spotted gar (right) (here only LG8 is shown; the other chromosomes are in Extended Data Fig. 4a). Chromosomes are partitioned into bins and CLG content is profiled; chromosomal position is plotted next to each chromosome. LG8 in gar has a prominent jawed-vertebrate-specific fusion of the CLGs E and O, which is retained throughout the whole chromosome in lungfish (despite the latter being >30-fold larger). The small box in the middle is the unexpanded LG8 of spotted gar. c, Preservation of microchromosomes. Chicken microchromosomes are plotted (for gar, see Extended Data Fig. 4d) along with their lungfish homologues with >50 orthologues. Scaffolds 01–17 represent lungfish macrochromosomes, and scaffolds 18–27 represent microchromosomes. For chicken, only microchromosomes are shown. Significantly enriched chicken microchromosomes on lungfish chromosomes indicated by rectangles (for raw data, see Fig. 4e). Most chicken microchromosomes are in one-to-one correspondence with lungfish, but some lungfish microchromosomes have recently been incorporated into macrochromosomes. These lungfish macrochromosomes (for example, scaffold 01 or scaffold 02) have significant association with both chicken macro- and microchromosomes. However, those fusions are recent in lungfish, because the positions of chicken orthologues are restricted to specific areas of the lungfish chromosomes, as is evident from the sharp syntenic boundaries (indicated by pink arrows on scaffold 01, scaffold 02 and scaffold 06). Silhouettes are from a previous publication. Significances were determined by Fischer’s exact test, P value ≤ 0.01.
Fig. 3
Fig. 3. Composition of repetitive elements in the lungfish genome.
a, The pie charts show overall composition of repetitive elements from unmasked assembly (first transposable element annotation) (left), together with the annotation from the hard masked genome (second transposable element annotation) (right). The bar chart shows the landscape of major classes of transposable elements. Kimura substitution level (%) for each copy against its consensus sequence used as proxy for expansion history of the transposable elements. Older copies (old expansion) accumulated more mutations and show higher divergence from the consensus sequences. RC, rolling-circle transposons; SINE, short interspersed nuclear element; TE, transposable element. b, Principal component (PC) analysis of composition of repetitive elements (LTR, LINE, SINE, DNA and unknown, filtered by 80/80 rule) of vertebrates.
Fig. 4
Fig. 4. Regulatory preadaptation of lobed fin and hoxd gene regulation.
a, Analysis of 330 validated mouse and human limb enhancers shows deep evolutionary origin of the limb regulatory program; 31 enhancers are associated with the emergence of the lobed fin. b, The hs72 enhancer located near the Sall1, gene drives strong LacZ in mouse autopods (n = 3 out of 3 embryos, LacZ-stained embryos courtesy of VISTA enhancer) (top). sall1 is expressed in a similar autopodial-like domain in lungfish pectoral fins (n = 2 out of 2 fins) (bottom). dpf, days post-fertilization. c, Left, hoxc13 is expressed in a distal lungfish area that overlaps with the central metapterygial axis (sox9) and fin fold (and1) (arrowheads) (n = 2 out of 2 fins). Right, similar expression present in axolotl limbs (arrowhead) (n = 4 out of 4 limbs), indicating a deep sarcopterygian origin for this expression domain. d, During lungfish fin development, hoxd11 and hoxd13 are expressed in mostly nonoverlapping proximal and posterior–distal fin domains (n = 4 out of 4 fins each). e, The lungfish hoxd cluster has increased in size compared to mouse and Xenopus, but may be smaller than the axolotl hoxd cluster. In lungfish and axolotl expansion has occurred in the 3′ and 5′ regions of the cluster, whereas the central hoxd8, hoxd9, hoxd10 and hoxd11 region (lilac box) remained stable at approximately 25 kb, forming a separate ‘minicluster’. The hoxd cluster is regulated by 3′ and long-range enhancers. hoxd9, hoxd10 and hoxd11 (lilac), and hoxd13 (green), are subject to enhancer sharing and co-expressed in the distal limb in mouse and Xenopus,, whereas the increased genomic distance between hoxd13 and hoxd9, hoxd10 and hoxd11 has disrupted their co-expression in the distal appendages of lungfish and axolotl. The preserved clustering of hoxd8, hoxd9, hoxd10 and hoxd11 can be explained by enhancer sharing 3′ of the cluster, which probably places constraints on their intergenic distances. Axolotl and Xenopus hoxd11 and hoxd13 after ref. ; lungfish hoxd11 and hoxd13 domains after ref. and d (Supplementary Table 16 lists primers for probes). Scale bars, 0.2 mm. Silhouettes are from ref. .
Extended Data Fig. 1
Extended Data Fig. 1. Schematic overview of the scaffolding procedure.
a, Scaffolding consists conceptually of two nested loops. The inner loop, depicted on the right, takes a list of contigs, their contact information and iteratively performs a global agglomerative clustering until convergence or until no more contigs can be joined. This loop is nested in the main procedure, which takes as input a list of seed contigs, assigns contigs these initial clusters, scaffolds these and allows for visual inspection and merging or splitting of the clusters. b, N(x) plot of the assembled contigs. On the y axis the contig length is shown, for which the collection of all contigs of that length or longer covers at least x per cent (x axis) of the assembly. c, N(x) plot of the scaffolded genome. On the y axis, the contig length is shown for which the collection of all scaffolds of that length or longer covers at least x per cent (x axis) of the assembly. d, Hi-C contact heat map of the scaffolded portion of the lungfish genome assembly, ordered by scaffold length. Blue boxes indicate the scaffold boundaries. The four largest scaffolds represent both chromosome arms on a single scaffold. Remaining scaffolds are split into chromosome arms or represent microchromosomes. e, Schema illustrating the contig misjoin detection process. Hi-C contacts are binned along the diagonal. Points that are not crossed by a sufficient number of contacts are deemed potential misjoins and are thus separated (dotted line).
Extended Data Fig. 2
Extended Data Fig. 2. k-mer frequency analysis and transcript coverage by genomic sequences.
a, The Illumina dataset was used to generate the spectra of k-mer abundances using seven k-mer sizes. be, Transcript coverage by genomic sequences. b, Histogram of the proportion of all transcript lengths covered by the alignment to contigs. c, Histogram of the proportion of all transcript lengths covered by the alignment to scaffolds. d, e, Histogram of the proportion of the transcript lengths covered by the alignment to contigs (d) or to scaffolds (e) of those transcripts with alignments that were improved after scaffolding.
Extended Data Fig. 3
Extended Data Fig. 3. CNE-based phylogeny, divergence times and rates of genome evolution.
a, Maximum likelihood phylogeny from noncoding conserved alignment blocks totalling 99,601 informative sites (using RAxML; GTRGAMMA model). All branches were supported by 100% bootstrap value; scale bar is in expected nucleotide replacements per site. Branch lengths of the trees obtained by the CNE method or from the protein sequences show a high correlation (R2 = 0.84, P < 0.05). b, Relaxed clock time-calibrated phylogeny (MCMCTree). Plots at nodes correspond to full posterior distribution of inferred ages. Scale is in Ma, and main geological periods are highlighted. Plot generated with MCMCTreeR (https://github.com/PuttickMacroevolution/MCMCtreeR). c, Evolution of genome size in jawed vertebrates. Maximum likelihood reconstruction of ancestral genome sizes using a time-calibrated phylotranscriptomic tree and genome size values obtained from ref. . Branch lengths are in Ma; colours denote genome size (c-value in pg or Gb). Rates of genome expansion are given for the ancestral branches of lungfishes and salamanders, as well as for the Neoceratodus terminal branch.
Extended Data Fig. 4
Extended Data Fig. 4. CLG, gene and repeat density along lungfish chromosomes.
a, CLG content profiled within windows of 20 genes with available orthology and CLG identity, and using a 10-gene sliding window. If genes were more than 10 Mb or 100 Mb apart in gar or lungfish, respectively (breaking the 20-gene window), the area is highlighted as grey, indicating areas that lack a sufficient amount of orthologous CLG markers. Blue bar indicates gene density (as measured by the 6,337 marker genes used in the CLG analysis) along 10-Mb windows. White or grey indicates gene desert; blue indicates gene-rich areas. Top row, previously reconstructed CLGs and their colour labels, followed by lungfish, spotted gar and chicken from top to bottom. b, Gene and repeat density along 10-Mb windows on lungfish chromosomes. The y axis shows count of CLG genes, LINEs and LTRs per 10-Mb window in top, middle and bottom panels, respectively. Microchromosomes show higher gene density and lower LINE density, and LTR density remains stable. c, d, Conserved macrosynteny between lungfish and chicken (c) and spotted gar (d). Chromosomes of chicken (c) and gar (d) are plotted along with their homologous lungfish chromosomes. The majority of the chromosomes and co-linearity are retained one-to-one. Some recent incorporation of microchromosomes into lungfish macrochromosomes (scaffold 02) has occurred, as evident from sharp syntenic boundaries. e, f, Significance of the association (homology) between chicken and lungfish chromosomes. Colours correspond to the significance power of the association, or −log10(adjusted Fisher’s exact test P values). Fisher’s test was run on the number of orthologous gene families shared between any given pair of chromosomes in chicken and lungfish, compared to the overall distribution of orthologous gene families on all other chromosomes. Most chicken microchromosomes (chromosome 6 onwards) are in one-to-one correspondence with lungfish, but some lungfish microchromosomes have recently been incorporated into macrochromosomes. These lungfish macrochromosomes (for example, scaffold 01 or scaffold 02) have significant association with both chicken macro- and microchromosomes. However, these fusions are very recent in lungfish, because the positions of chicken orthologues are restricted to specific areas of the lungfish chromosome (also seen as a clear boundary in Fig. 2c). ‘Size’ refers to the number of shared orthologous gene families between homologous chromosomes. f, Significance of the association (homology) between CLGs and lungfish chromosomes. Fisher’s test was run on the number of orthologous gene families shared between any given pair of chromosomes in CLGs and lungfish, compared to the overall distribution of orthologous gene families on all other chromosomes. Silhouette of the lungfish is from ref. .
Extended Data Fig. 5
Extended Data Fig. 5. Age estimation plots on LINE and LTR classes in Kimura plots.
a, b, Repeat landscape of LINE (a) and LTR (b) of lungfish and axolotl. The two main peaks indicate there were two major LINE expansions in lungfish. The recent expansion (diverging ≤ 15% from the consensus sequences) contributed to 9% of the lungfish genome. The LTR landscapes are similar in these two species.
Extended Data Fig. 6
Extended Data Fig. 6. Correlation between expression of transposable element families and copy number in the genome.
a, Expression was estimated for each transposable element family using poly (A)-enriched RNA-seq data from gonad, brain and liver. For all tissues and transposable element classes, a positive correlation is observed between expression level and copy number. When a transposable element family is highly expressed, this family tend to have more copies. However, some families are distant from the correlation line, with a high expression and low copy number or vice versa. The expression levels of transposable element families are globally correlated in the three tissues. b, Composition of different classes of repetitive elements in genic regions. Gene and repetitive element annotations were obtained from published reference genomes (see ‘Repeats and transposable elements annotation’ in Methods). The percentage of different classes of repetitive elements in genic region (including UTRs, exons and introns) were calculated as percentage of the number of bp covered by the repetitive element, normalized by the size of the genes. Genes are grouped by length. As the size of genes varies across species, we grouped them by quartile division per species. The genic LTR percentage (orange) increases in longer genes in lungfish, axolotl and caecilian (vertical lines show the minimum and maximum of the percentage of transposable elements in genes). The box plot shows the median, and the 25% and the 75% quartiles; whiskers show 1.5× the interquartile range. Outliers extend beyond 1.5× interquartile ranges from either hinge. c, Percentage of the genic regions that are occupied by different classes of transposable elements. Top and middle, LINE CR1 and LINE L2 (which are classified in the same clade of LINE and are closely related) compose about 5.1% and 2.9% of the lungfish genome, respectively. Bottom, on average, introns (blue) contain a higher number of LTRs and DIRS (about 20 to 30%) than exons (red). d, Percentage of LTR families in genic regions (including UTRs). The LTRs and DIRS are enriched in genic regions in lungfish and axolotl.
Extended Data Fig. 7
Extended Data Fig. 7. Box plot of intron sizes in axolotl, fugu, human and lungfish.
For axolotl, fugu, human and lungfish the lengths (y axis is log2-transformed scale of base pairs) of the first, second, third, fourth and fifth (and above) introns show a consistent pattern, in which the first intron is always the longest intron—both in the giant lungfish and axolotl genomes as well as in the tiny fugu (400 Mb) genome.
Extended Data Fig. 8
Extended Data Fig. 8. Gene expression data in Australian lungfish, ray-finned fish and axolotl salamader.
a, Neoceratodus only has a single right lung. shh expression in the Neoceratodus lung anlage. Stage (st.) 43 ventral view (n = 1 out of 1 embryo), anterior up. Stage-48 ventral view, anterior up (n = 1 out of 1 embryo). The appearance of the lung anlage and shh expression is similar to that in Xenopus. Transverse section across dotted line. lu, lung; in, intestine. Scale bars, 0.2 mm. b, LacZ enhancer assays in mouse 12-dpf embryos show the regulatory activity of several ultraconserved enhancers that emerged in association with the evolution of the lobed fin. These include elements located near important limb developmental genes that contribute to the sturdy sarcopterygian fin archetype (Supplementary Results). Reported LacZ limb expression: hs1603, n = 7 out of 7 embryos; hs895, n = 5 out of 8 embryos; hs1442, n = 10 out of 11 embryos; mm1179,, n = 7 out of 7 embryos; mm1887, n = 6 out of 6 embryos; hs1438, n = 5 out of 11 embryos. c, hox gene expression from RNA-seq analysis of stage-52 pectoral fins (n = 2). Individual data points shown with asterisks; the height of the bar indicates average expression. Overlapping data points indicated with a single asterisk. High expression of posterior hoxa and hoxd genes (except for hoxa14), low expression of hoxb genes and unexpectedly high expression of hoxc genes. d, Absence of hoxc13 expression from pectoral, but not caudal, fins in the ray-finned cichlid Astatotilapia burtoni. A staging series of cichlid pectoral fins (5–7 dpf) does not show expression of hoxc13, whereas this gene stains strongly in the caudal fin (n = 4/4 embryos per stage). This result is consistent with a sarcopterygian origin of hoxc13 expression in the distal paired fins and limbs. Scale bars, 0.1 mm. e, Non canonical patterns of hoxd9 and hoxd10 expression in axolotl limbs (n = 2/2 limbs per stage). Expression of hoxd9 and hoxd10 during axolotl limb development shows strong expression in a proximal limb domain but absence or low expression in the distal limb or digit domain. This noncanonical expression is similar to that previously reported for hoxd11,, and suggests a loss of contact with the distal limb enhancers located 5′ of the hoxd cluster, caused by the expansion of the posterior hoxd cluster. Scale bars, 0.2 mm. Silhouettes are from ref. .
Extended Data Fig. 9
Extended Data Fig. 9. Comparison of Neoceratodus and mouse hox clusters.
Four hox clusters are present in the Neoceratodus genome (hoxa, hoxb, hoxc and hoxd), comprising 43 genes and 6 conserved miRNA genes (miR10 and miR196). Neoceratodus preserves a copy of hoxb10 and hoxa14, which are lost in tetrapods. The 3′ hoxc cluster contains the hoxc1 and hoxc3 genes, which are lost in several tetrapod lineages but have been shown to be part of the original tetrapod hox complement. Consistent with the overall expansion of the Neoceratodus genome, its hox clusters are larger than their mouse counterparts. Expansion has occurred unevenly across the clusters and intergenic regions of highest expansion are indicated with yellow mark up (hoxa11 to hoxa13; hoxb10  to hoxb13; hoxc1 to hoxc3; hoxc3 to hoxc4; hoxc11 to hoxc12; and hoxd12 to hoxd13). Furthermore, the introns of hoxa3 and hoxd3 are enlarged. All clusters shown (both mouse and Neoceratodus) are drawn to scale with the respective sizes indicated, except for the 11 Mb between hoxb10 and hoxb13, which is drawn about 20-fold reduced. The Neoceratodus hoxb13 and hoxd13 are present on separate contigs and the exact genomic distance to their nearest neighbouring hox gene has not been determined. The sizes for the hoxb and hoxd clusters therefore represent a lower limit. The mouse has lost hoxa14 and the indicated synteny for hoxa runs from hoxa1 through hoxa13. Similarly, the mouse hoxc cluster lacks hoxc1 and hoxc3 and the comparative hoxc synteny runs from hoxc4 through hoxc13. Gene labels are included for the Neoceratodus cluster, whereas in the mouse clusters genes are indicated only using red boxes. miRNAs are indicated only for the Neoceratodus clusters. Silhouettes are from ref. .
Extended Data Fig. 10
Extended Data Fig. 10. Validation of the assembly of the Neoceratodus genome.
a, Read coverage along the assembly showing a portion of scaffold 01. Red lines mark regions exhibiting a coverage >3 s.d. from the mean. Overall, these regions represent 0.09% of the genome. b, Representative region showing read pile-up with coverage in excess of 3 s.d. from the mean. The entire region is contained within a region annotated as repetitive by RepeatMasker (red interval).

Comment in

  • Giant genomes of lungfish.
    Otto G. Otto G. Nat Rev Genet. 2021 Apr;22(4):199. doi: 10.1038/s41576-021-00337-9. Nat Rev Genet. 2021. PMID: 33597743 No abstract available.

References

    1. Clack, J., Sharp, E. & Long, J. in The Biology of Lungfishes (eds Jorgensen, J. M. & Joss, J.) 1–42 (CRC, 2011).
    1. Kemp A. The biology of the Australian lungfish, Neoceratodus forsteri (Krefft 1870) J. Morphol. 1986;190:181–198.
    1. Carroll, R. L. Vertebrate Paleontology and Evolution (W. H. Freeman, 1988).
    1. Irisarri I, Meyer A. The identification of the closest living relative(s) of tetrapods: phylogenomic lessons for resolving short ancient internodes. Syst. Biol. 2016;65:1057–1075. - PubMed
    1. Irisarri I, et al. Phylotranscriptomic consolidation of the jawed vertebrate timetree. Nat. Ecol. Evol. 2017;1:1370–1378. - PMC - PubMed

Publication types

MeSH terms

LinkOut - more resources