. 2021 Nov;17(11):3424-3443.
doi: 10.1080/15548627.2021.1874208. Epub 2021 Jan 19.

Autophagy activation, lipotoxicity and lysosomal membrane permeabilization synergize to promote pimozide- and loperamide-induced glioma cell death

Affiliations

Autophagy activation, lipotoxicity and lysosomal membrane permeabilization synergize to promote pimozide- and loperamide-induced glioma cell death

Nina Meyer et al. Autophagy. 2021 Nov.

Abstract

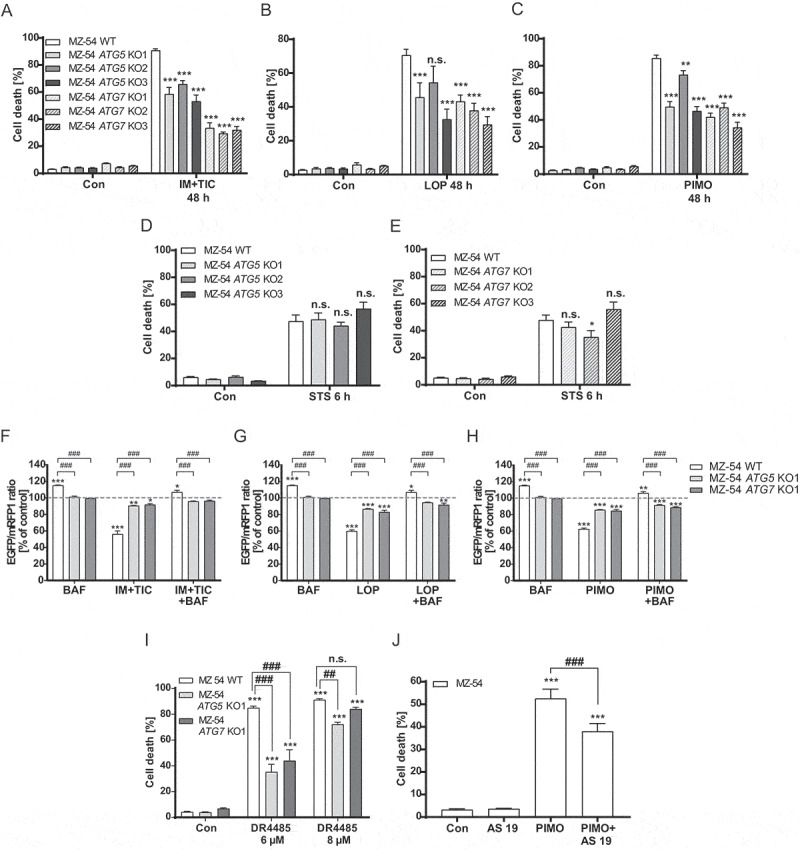
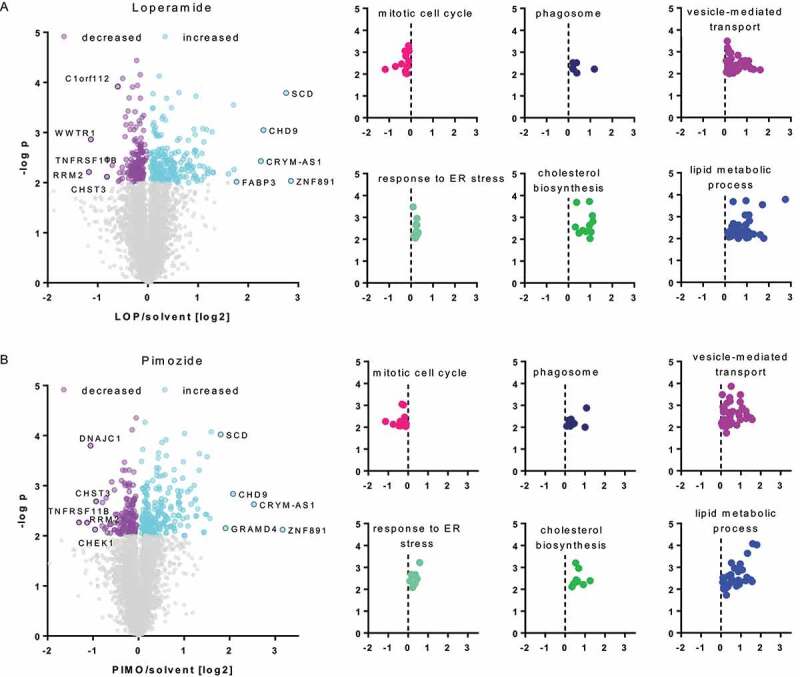
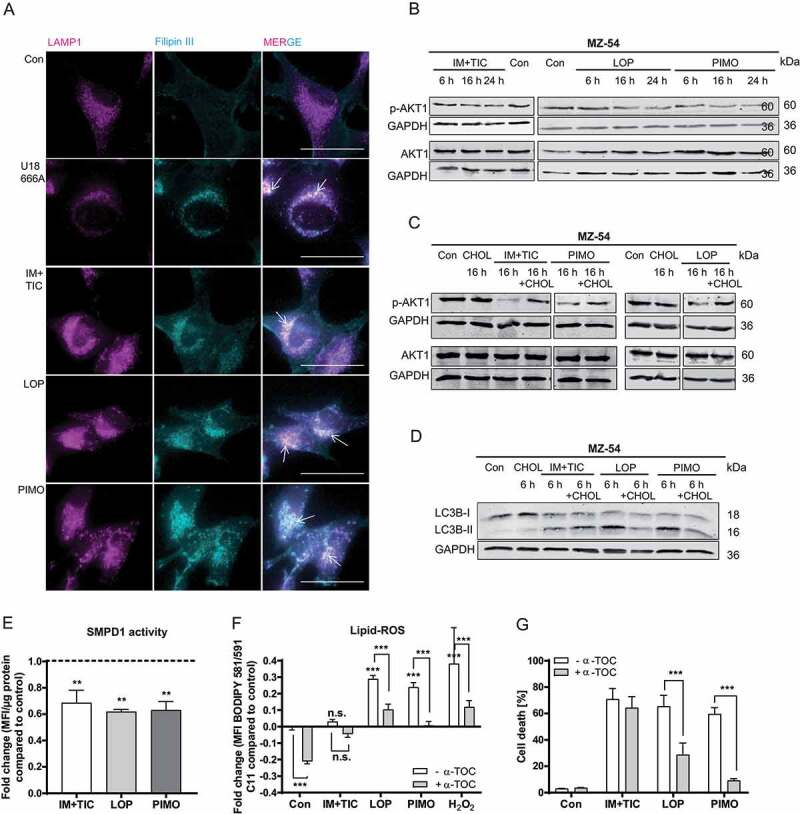
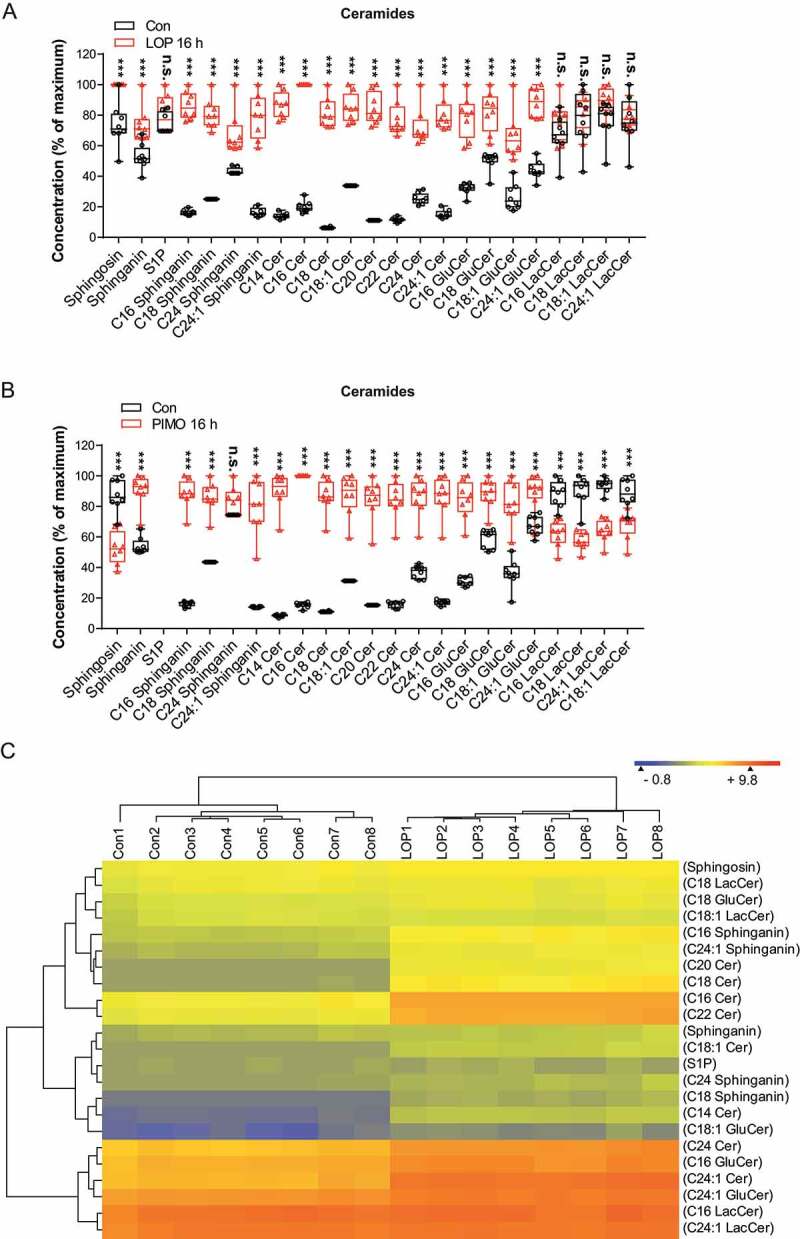
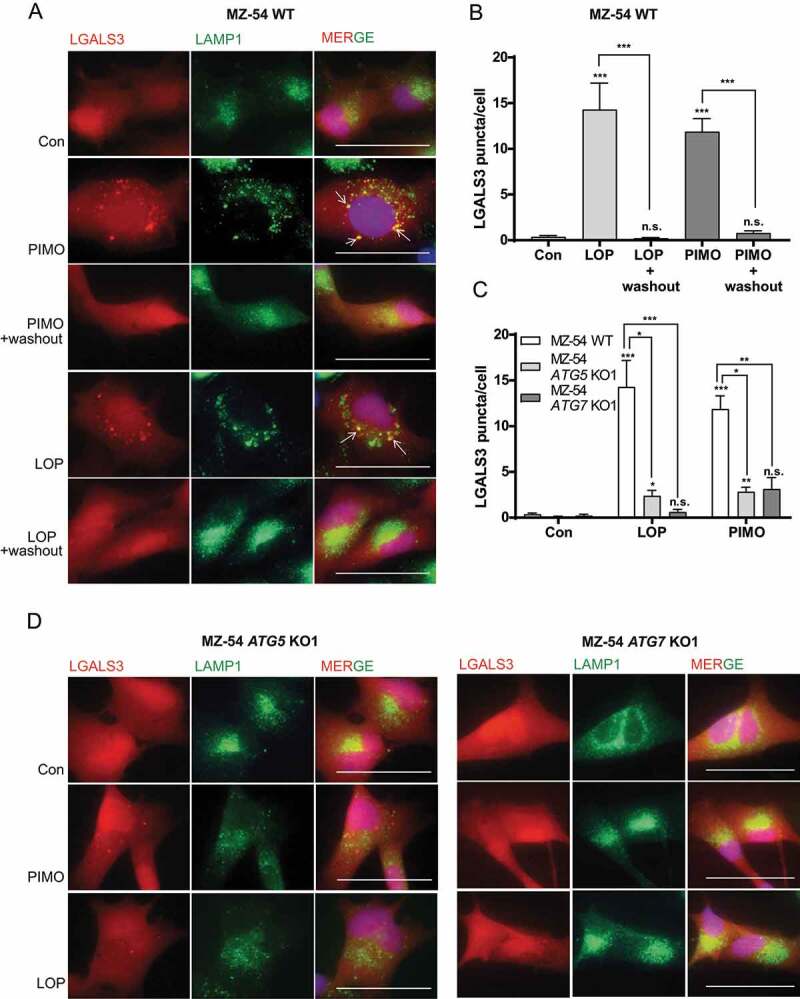
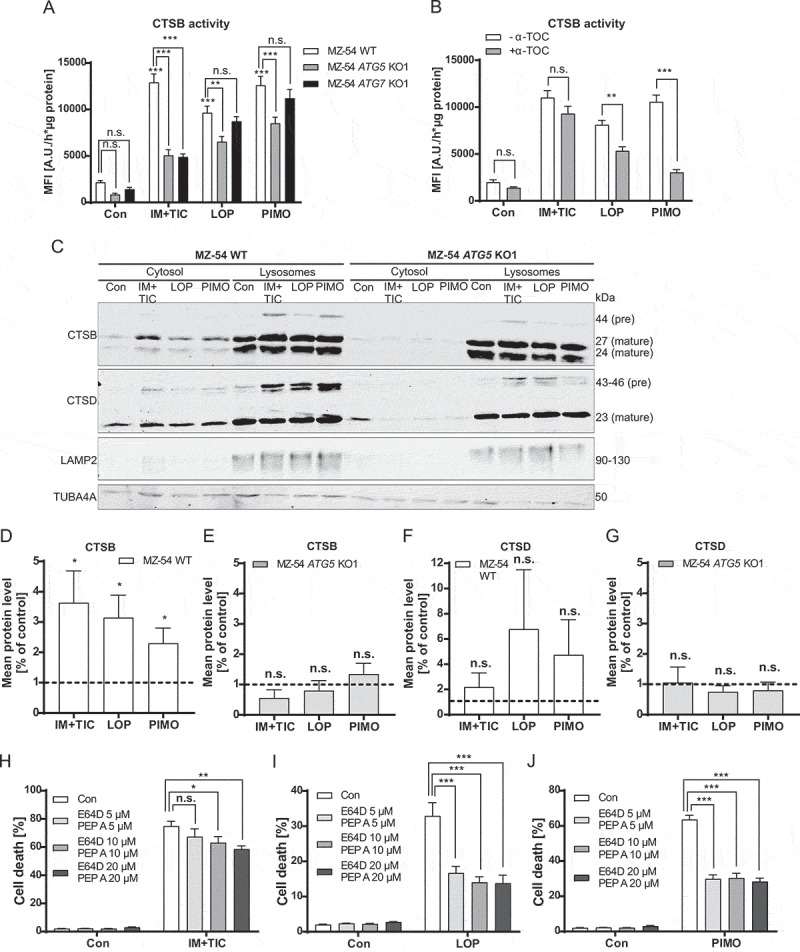
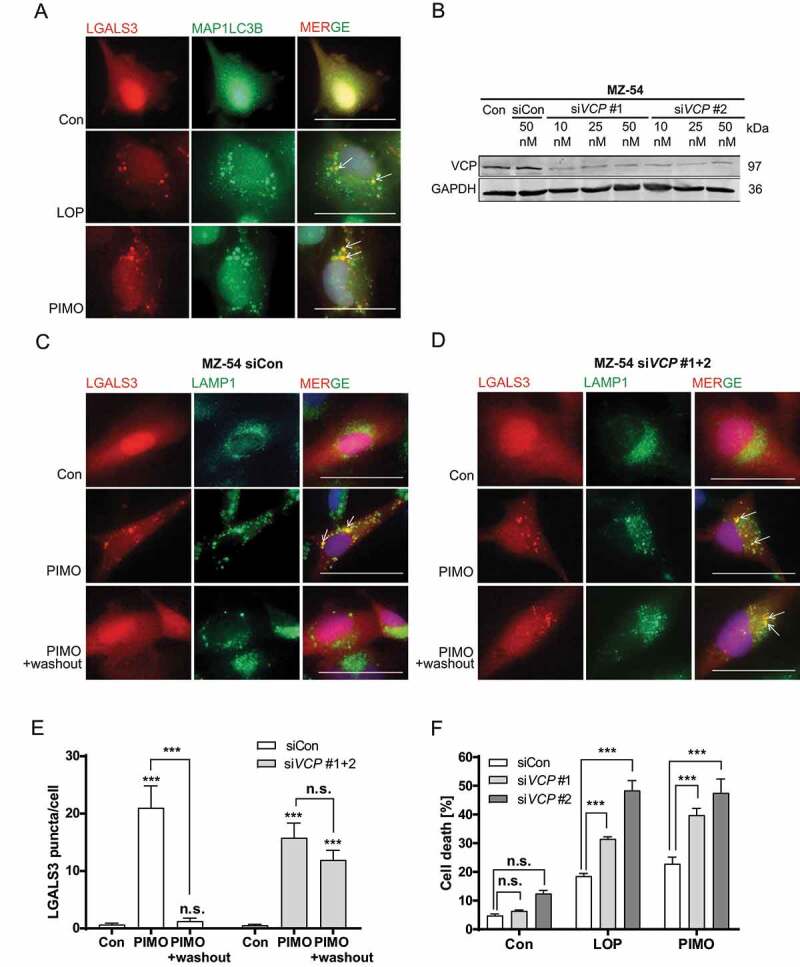
Increasing evidence suggests that induction of lethal macroautophagy/autophagy carries potential significance for the treatment of glioblastoma (GBM). In continuation of previous work, we demonstrate that pimozide and loperamide trigger an ATG5- and ATG7 (autophagy related 5 and 7)-dependent type of cell death that is significantly reduced with cathepsin inhibitors and the lipid reactive oxygen species (ROS) scavenger α-tocopherol in MZ-54 GBM cells. Global proteomic analysis after treatment with both drugs also revealed an increase of proteins related to lipid and cholesterol metabolic processes. These changes were accompanied by a massive accumulation of cholesterol and other lipids in the lysosomal compartment, indicative of impaired lipid transport/degradation. In line with these observations, pimozide and loperamide treatment were associated with a pronounced increase of bioactive sphingolipids including ceramides, glucosylceramides and sphingoid bases measured by targeted lipidomic analysis. Furthermore, pimozide and loperamide inhibited the activity of SMPD1/ASM (sphingomyelin phosphodiesterase 1) and promoted induction of lysosomal membrane permeabilization (LMP), as well as release of CTSB (cathepsin B) into the cytosol in MZ-54 wild-type (WT) cells. Whereas LMP and cell death were significantly attenuated in ATG5 and ATG7 knockout (KO) cells, both events were enhanced by depletion of the lysophagy receptor VCP (valosin containing protein), supporting a pro-survival function of lysophagy under these conditions. Collectively, our data suggest that pimozide and loperamide-driven autophagy and lipotoxicity synergize to induce LMP and cell death. The results also support the notion that simultaneous overactivation of autophagy and induction of LMP represents a promising approach for the treatment of GBM.Abbreviations: ACD: autophagic cell death; AKT1: AKT serine/threonine kinase 1; ATG5: autophagy related 5; ATG7: autophagy related 7; ATG14: autophagy related 14; CERS1: ceramide synthase 1; CTSB: cathepsin B; CYBB/NOX2: cytochrome b-245 beta chain; ER: endoplasmatic reticulum; FBS: fetal bovine serum; GBM: glioblastoma; GO: gene ontology; HTR7/5-HT7: 5-hydroxytryptamine receptor 7; KD: knockdown; KO: knockout; LAMP1: lysosomal associated membrane protein 1; LAP: LC3-associated phagocytosis; LMP: lysosomal membrane permeabilization; MAP1LC3B: microtubule associated protein 1 light chain 3 beta; MTOR: mechanistic target of rapamycin kinase; RB1CC1: RB1 inducible coiled-coil 1; ROS: reactive oxygen species; RPS6: ribosomal protein S6; SMPD1/ASM: sphingomyelin phosphodiesterase 1; VCP/p97: valosin containing protein; WT: wild-type.

Keywords: Acid sphingomyelinase; autophagy-dependent cell death; brain tumors; cholesterol metabolism; drug repurposing; er stress; lysophagy.


Conflict of interest statement

All authors declare no conflict of interest.

Figures

Figure 1.
Figure 1.
Determination of autophagic cell death upon treatment with loperamide and pimozide. (A-E) Flow cytometric analysis of cell death by measurement of APC-ANXA5 binding and PI uptake. MZ-54 WT cells and three different CRISPR-Cas9 ATG5 and ATG7 KO cell lines were treated with 20 µM imipramine + 100 µM ticlopidine (IM+TIC) (A), 12.5 µM loperamide (LOP) (B), 12.5 µM pimozide (PIMO) (C) for 48 h or with 3 µM staurosporine (STS) (D and E) for 6 h. A-E display total cell death including only-APC-ANXA5-positive, only-PI-positive and double-positive cells. DMSO was used as vehicle (Con, 48 h or 6 h, respectively). Data show mean + SEM of at least three experiments with three replicates and 5,000–10,000 cells measured in each sample. Statistical significances were calculated with a two-way ANOVA. (F-H) Flow cytometric analysis of the autophagic flux by measurement of the EGFP and mRFP1 signal. MZ-54 WT cells and ATG5 and ATG7 KO cells were exposed to 20 µM imipramine + 100 µM ticlopidine (IM+TIC) (F), 15 µM loperamide (LOP) (G) or 15 µM pimozide (PIMO) (H) for 16 h alone or in combination with bafilomycin A1 (BAF). Data show mean + SEM of three experiments with three replicates and 5,000–10,000 cells measured in each sample. Statistical significances were calculated with a two-way ANOVA. (I and J) Assessment of cell death as described above. (I) DR4485 was added in a concentration of 6 µM or 8 µM to MZ-54 WT cells or the respective ATG5 and ATG7 KOs. DMSO (con) served as control. Data represent mean + SEM of three independent experiments with three replicates and 5,000–10,000 cells measured in each sample. Statistical significances were calculated with a two-way ANOVA. (J) 10 µM AS 19 was added 2 h before MZ-54 WT cells were treated with 12.5 µM pimozide (PIMO) for 40 h. DMSO (con) served as control. Data represent mean + SEM of four independent experiments with three replicates and 5,000–10,000 cells measured in each sample. Statistical significances were calculated with a one-way ANOVA Significances between WT and KO cells are depicted as P ≤ 0.05: #, P ≤ 0.01: ## or P ≤ 0.001: ###
Figure 2.
Figure 2.
Whole proteome analysis of loperamide- and pimozide-treated MZ-54 glioma cells. (A and B, left panel) Volcano plots displaying the protein ratios (log2) of TMT-labeled proteome data as a function of the -log p-value. MZ-54 cells were exposed to 12.5 µM loperamide (LOP; A) or 12.5 µM pimozide (PIMO; B) for 24 h. Experiments were performed in duplicates and a total of 6,298 proteins were quantified in all samples. Significantly up- or downregulated proteins with p < 0.01 are each depicted in purple or light blue, proteins with no significant expression changes are shown in gray. (A and B, right panel) Bioinformatic analyses using String [29] revealed that significant reduction of the GO-term “mitotic cell cycle” (GO:0000278; upper left; pink) and a significant enrichment of the GO-terms “response to ER-stress” (GO:0034976; lower left; turquoise), “vesicle-mediated transport” (GO:0016192; upper right; purple) and “lipid-metabolic process” (GO:0006629; lower right; blue). Additionally, the KEGG-pathway “phagosome” (hsa04145; upper middle; dark blue) and the reactome-pathway “cholesterol biosynthesis (HSA-191,273; lower middle; green) were significantly enriched after both treatments
Figure 3.
Figure 3.
Determination of altered lipid trafficking in imipramine + ticlopidine, loperamide and pimozide-treated MZ-54 cells. (A) Microscopic analysis of cholesterol accumulation in the lysosomes. Cholesterol was marked with filipin III and lysosomes were stained with anti-LAMP1. MZ-54 cells were treated with 1.25 µM U18666A as positive control, 20 µM imipramine + 75 µM ticlopidine (IM+TIC), 12.5 µM loperamide (LOP), 12.5 µM pimozide (PIMO) or DMSO (Con) for 18 h. At least three images were taken per experiment at 60x magnification and three independent experiments were performed (scale bar: 50 µm). Arrows display colocalization of filipin III and LAMP1. (B-D) Immunoblot analysis of phospho-AKT1 and AKT1 protein expression (B and C) and of MAP1LC3B switch (D). GAPDH was used as housekeeper. MZ-54 cells were treated with 20 µM imipramine + 100 µM ticlopidine (IM+TIC), 15 µM loperamide (LOP) or 15 µM pimozide (PIMO) for the indicated time periods (6 h, 16 h, 24 h) alone or in combination with 10 µg/mL cholesterol–methyl-β-cyclodextrin. DMSO was used as control (Con). Experiments were performed two to three times. (E) Assessment of SMPD1 activity upon treatment with 20 µM imipramine + 75 µM ticlopidine (IM+TIC), 12.5 µM loperamide (LOP) or 12.5 µM pimozide (PIMO) for 16 h. The bar chart represents the fold-change of mean fluorescent intensity (MFI) per µg protein compared to control. (F) Assessment of lipid-ROS levels by flow cytometric analysis of MZ-54 cells stained with the lipid peroxidation sensor BODIPY™ 581/591 C11. Cells were exposed to 15 µM pimozide (PIMO), 15 µM loperamide (LOP), 20 µM imipramine + 100 µM ticlopidine (IM+TIC), 100 µM H2O2 (positive control) or DMSO (Con) for 16 h alone or in combination with 100 µM α-tocopherol (α-TOC, added to the cells 1 h before the other treatments). Data represent the fold-change of BODIPY™ 581/591 C11 MFI compared to control. (G) Quantification of cell death by flow cytometric analysis of APC-ANXA5 binding and PI uptake. MZ-54 cells were treated with 20 µM imipramine + 75 µM ticlopidine (IM+TIC), 12.5 µM loperamide (LOP), 12.5 µM pimozide (PIMO) or DMSO (Con) for 48 h in the presence or absence of 100 µM α-tocopherol (α-TOC, added to the cells 1 h before the other treatments). Total cell death was calculated by summing up only-APC-ANXA5-positive, only-PI-positive and double-positive cells. E, F and G represent mean + SEM of at least three independent experiments performed in triplicates (5,000–10,000 cells measured in each sample). Statistical significances were calculated with a two-way ANOVA
Figure 4.
Figure 4.
Targeted LC-MS/MS analysis of sphingolipids and ceramides in MZ-54 cells treated with loperamide or pimozide. (A and B) MZ-54 cells were exposed to 12.5 µM loperamide (LOP) (A), 12.5 µM pimozide (PIMO) (B) or DMSO as control (Con). FBS in the cell culture medium was reduced to 2% for loperamide and to 5% for pimozide treatments and the respective controls to minimize background. The box plots represent the interquartile range of sphingolipid and ceramide concentrations shown as percentage of the maximum, the line is the median and whiskers show min and max values of the eight replicates, depicted as scatters. Statistical significance was assessed with a two-way ANOVA and subsequent t-tests for each lipid individually employing a correction of alpha according to Sidak. Asterisks indicate significant differences versus control, ***: P < 0.001. (C) Heatmap and dendrograms showing the result of hierarchical Euclidean clustering of lipids (y-axis) and of the individual experimental replicates (x-axis). The experimental groups are clearly separated. Colors per row display the concentration differences between different lipids and groups. The abbreviations are: S1P, sphingosine-1-phosphate; C14 Cer etc. ceramide with 14 C-atoms; C24:1 Cer etc., ceramide with 24 C-atoms and one unsaturated bound
Figure 5.
Figure 5.
Assessment of LMP after loperamide and pimozide treatment. (A-D) Monitoring LMP by microscopic analysis of mCherry-LGALS3 puncta formation and colocalization with the lysosomal marker LAMP1. MZ-54 control (A), ATG5 and ATG7 KO cells (D) stably transfected with pmCherry-LGALS3 were treated with 15 µM loperamide (LOP), 12.5 µM pimozide (PIMO) or DMSO (Con) for 16 h. For washout experiments shown in A, loperamide and pimozide was removed after 16 h and fresh medium was added for additional 24 h. At least three independent experiments were performed, and three to eight images were taken at 60x magnification in each experiment (scale bar: 50 µm). (B and C) Quantification of mCherry-LGALS3 puncta/cell. In total, 14–33 cells were analyzed per condition. Data represent mean + SEM of at least three independent experiments and three to eight images per experiment. Statistical significance was analyzed with a Kruskal-Wallis test
Figure 6.
Figure 6.
Determination of cathepsin release and lysosomal cell death. (A and B) Quantification of active CTSB in the cytosol. (A) MZ-54 WT, ATG5 and ATG7 KO cells were exposed to 20 µM imipramine + 75 µM ticlopidine (IM+TIC), 12.5 µM loperamide (LOP), 12.5 µM pimozide (PIMO) or DMSO (Con) for 16 h. Cells were fractionated using digitonin and cytosolic extracts were subjected to fluorescence-based measurement of CTSB activity. The bar chart represents changes in mean fluorescence intensity as arbitrary unit per hour and µg protein. (B) MZ-54 cells were treated as in A in the presence or absence of 100 µM α-tocopherol (α-TOC) that was added to the cells 1 h before all other treatments. Data in A and B display mean + SEM of four independent experiments with five to six replicates. Statistical analysis was calculated with a two-way ANOVA. (C) Immunoblot analysis of CTSB and CTSD expression in the cytosolic fraction and organelle fraction containing lysosomes. LAMP2 was used for identification of lysosomes and TUBA4A was used for identification of cytosolic material. MZ-54 WT cells and ATG5 KO cells were treated as described in A. (D-G) Quantification of cytosolic CTSB and CTSD protein levels of MZ54 WT cells and MZ-54 ATG5 KO cells detected by immunoblot analysis. Data show mean + SEM of three to five independent experiments. (H-J) Monitoring cell death by flow cytometric quantification of APC-ANXA5 binding and PI uptake. Cell death refers to overall cell death including only-APC-ANXA5-positive, only-PI-positive and double-positive cells. MZ-54 cells were exposed to 20 µM imipramine + 75 µM ticlopidine (IM+TIC), 12.5 µM loperamide (LOP), 12.5 µM pimozide (PIMO) or DMSO (Con) for 40 h in the presence or absence of the cathepsin inhibitors E64D and pepstatin A (PEP A) at concentrations of 5, 10 and 20 µM. Cathepsin inhibitors were added to the cells 2 h before the other treatments. Data show mean + SEM or three independent experiments with three replicates and 5,000–10,000 cells measured in each sample. Statistical significances were calculated with a two-way ANOVA
Figure 7.
Figure 7.
Determination of lysophagy triggered by loperamide and pimozide-induced LMP. (A) Microscopic analysis of mCherry-LGALS3 and anti-MAP1LC3B colocalization. Images were taken at 60x magnification. Three independent experiments were performed with at least three images per experiment (scale bar: 50 µm). (B) Immunoblot analysis of VCP expression and GAPDH as housekeeper. MZ-54 cells were transfected with siRNA against VCP at different concentrations (siVCP 1 and siVCP 2; 10, 25 and 50 nM) or universal siRNA negative control (siCon). (C-E) Monitoring mCherry-LGALS3 puncta formation and disappearance after compound washout by microscopic analysis of mCherry-LGALS3 puncta formation and colocalization with the lysosomal marker LAMP1. MZ-54 cells were transfected with a combination of two siRNAs against VCP (25 nM siVCP #1 + 25 nM siVCP #2) or universal siRNA negative control (50 nM siCon), followed by treatment with 15 µM pimozide (PIMO) or DMSO (Con) for 16 h. For washout experiments, treatment compounds were removed after 16 h and cells were incubated in fresh medium for additional 24 h. (C, D) Images were taken at 60x magnification (scale bar: 50 µm). (E) Quantification of mCherry-LGALS3 puncta per cell. In total, 11–23 cells were analyzed for each condition. Data represent mean + SEM of three independent experiments and three to five images per experiment. Statistical significance was analyzed with a Kruskal-Wallis test. (F) Flow cytometry-based cell death analyses by quantification of only-APC-ANXA5-positive, only PI-positive and double-positive cells. MZ-54 cells were transfected with 25 nM siRNA against VCP (siVCP #1 and siVCP #2) or universal siRNA negative control (siCon), followed by treatment with 12.5 µM loperamide (LOP) or 12.5 µM pimozide (PIMO) for 30 h. Data represent the combined values of all three cell populations and show means + SEM of three independent experiments with three replicates and 5,000–10,000 cells measured in each sample. Statistical significance was calculated with a two-way ANOVA

References

    1. Mariño G, Niso-Santano M, Baehrecke EH, et al. Self-consumption: the interplay of autophagy and apoptosis. Nat Rev Mol Cell Biol. 2014;15(2):81–94. - PMC - PubMed
    1. Klionsky DJ, Cuervo AM, Dunn, Jr. WA, et al. How shall I eat thee? Autophagy. 2007;3(5):413–416. - PubMed
    1. Liu Y-L, Yang P-M, Shun C-T, et al. Autophagy potentiates the anti-cancer effects of the histone deacetylase inhibitors in hepatocellular carcinoma. Autophagy. 2010;6(8):1057–1065. - PubMed
    1. Dasari SK, Bialik S, Levin-Zaidman S, et al. Signalome-wide RNAi screen identifies GBA1 as a positive mediator of autophagic cell death. Cell Death Differ. 2017;24(7):1288–1302. - PMC - PubMed
    1. Segala G, David M, de Medina P, et al. Dendrogenin A drives LXR to trigger lethal autophagy in cancers. Nat Commun. 2017;8(1):1903. - PMC - PubMed

Publication types

MeSH terms