

Expression quantitative trait loci in sheep liver and muscle contribute to variations in meat traits
- PMID: 33461502
- PMCID: PMC7812657
- DOI: 10.1186/s12711-021-00602-9
Expression quantitative trait loci in sheep liver and muscle contribute to variations in meat traits
Abstract
Background: Variants that regulate transcription, such as expression quantitative trait loci (eQTL), have shown enrichment in genome-wide association studies (GWAS) for mammalian complex traits. However, no study has reported eQTL in sheep, although it is an important agricultural species for which many GWAS of complex meat traits have been conducted. Using RNA sequence data produced from liver and muscle from 149 sheep and imputed whole-genome single nucleotide polymorphisms (SNPs), our aim was to dissect the genetic architecture of the transcriptome by associating sheep genotypes with three major molecular phenotypes including gene expression (geQTL), exon expression (eeQTL) and RNA splicing (sQTL). We also examined these three types of eQTL for their enrichment in GWAS of multi-meat traits and fatty acid profiles.
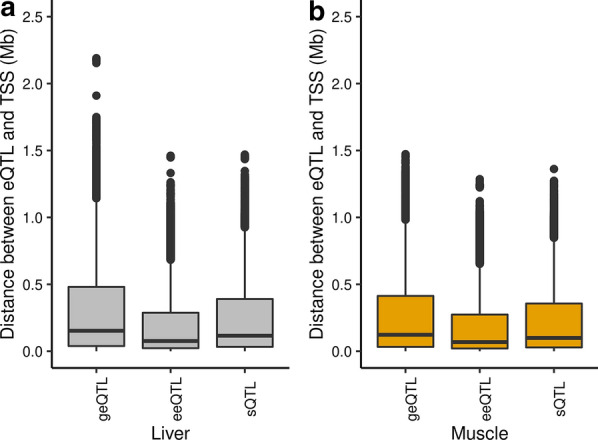
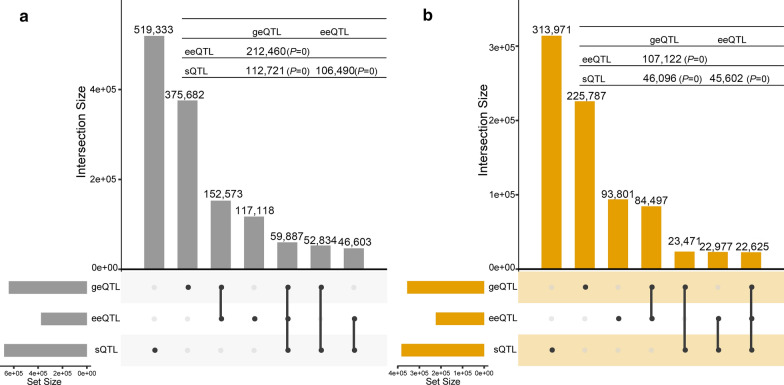
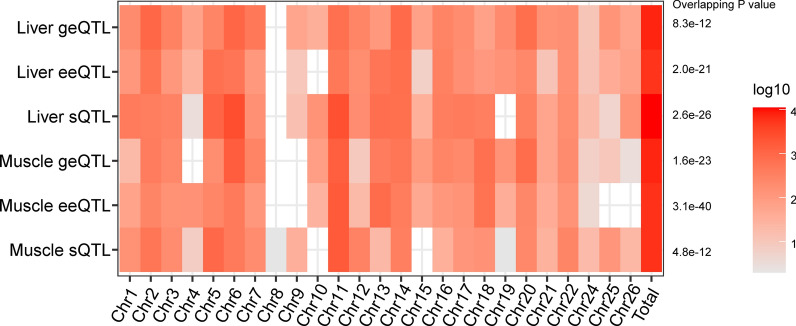
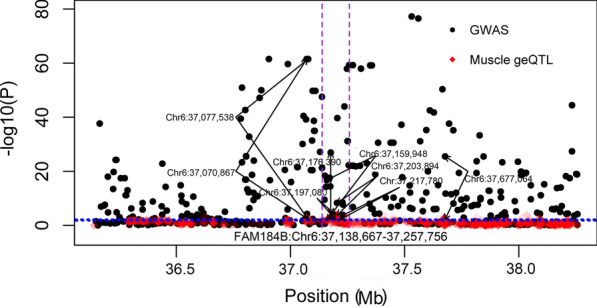
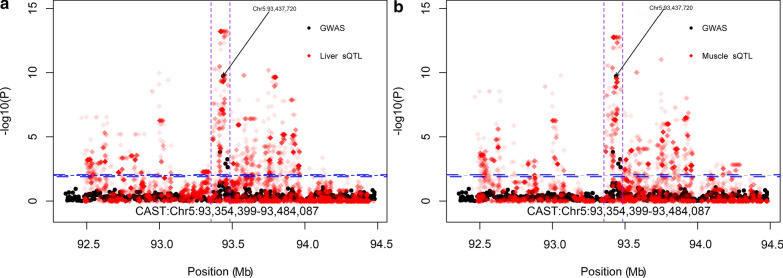
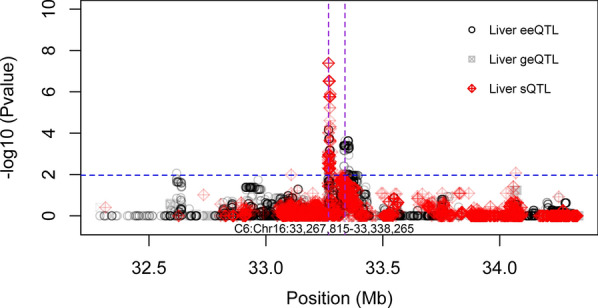
Results: Whereas a relatively small number of molecular phenotypes were significantly heritable (h2 > 0, P < 0.05), their mean heritability ranged from 0.67 to 0.73 for liver and from 0.71 to 0.77 for muscle. Association analysis between molecular phenotypes and SNPs within ± 1 Mb identified many significant cis-eQTL (false discovery rate, FDR < 0.01). The median distance between the eQTL and transcription start sites (TSS) ranged from 68 to 153 kb across the three eQTL types. The number of common variants between geQTL, eeQTL and sQTL within each tissue, and the number of common variants between liver and muscle within each eQTL type were all significantly (P < 0.05) larger than expected by chance. The identified eQTL were significantly (P < 0.05) enriched in GWAS hits associated with 56 carcass traits and fatty acid profiles. For example, several geQTL in muscle mapped to the FAM184B gene, hundreds of sQTL in liver and muscle mapped to the CAST gene, and hundreds of sQTL in liver mapped to the C6 gene. These three genes are associated with body composition or fatty acid profiles.
Conclusions: We detected a large number of significant eQTL and found that the overlap of variants between eQTL types and tissues was prevalent. Many eQTL were also QTL for meat traits. Our study fills a gap in the knowledge on the regulatory variants and their role in complex traits for the sheep model.
Conflict of interest statement
The authors declare that they have no competing interests.
Figures
Similar articles
-
Genetic control of longissimus dorsi muscle gene expression variation and joint analysis with phenotypic quantitative trait loci in pigs.BMC Genomics. 2019 Jan 3;20(1):3. doi: 10.1186/s12864-018-5386-2. BMC Genomics. 2019. PMID: 30606113 Free PMC article.
-
Integration of a single-step genome-wide association study with a multi-tissue transcriptome analysis provides novel insights into the genetic basis of wool and weight traits in sheep.Genet Sel Evol. 2021 Jun 30;53(1):56. doi: 10.1186/s12711-021-00649-8. Genet Sel Evol. 2021. PMID: 34193030 Free PMC article.
-
Genome-wide analysis of expression QTL (eQTL) and allele-specific expression (ASE) in pig muscle identifies candidate genes for meat quality traits.Genet Sel Evol. 2020 Oct 9;52(1):59. doi: 10.1186/s12711-020-00579-x. Genet Sel Evol. 2020. PMID: 33036552 Free PMC article.
-
Expression Quantitative Trait Loci Information Improves Predictive Modeling of Disease Relevance of Non-Coding Genetic Variation.PLoS One. 2015 Oct 16;10(10):e0140758. doi: 10.1371/journal.pone.0140758. eCollection 2015. PLoS One. 2015. PMID: 26474488 Free PMC article. Review.
-
Genetic basis of muscle-related traits in sheep: A review.Anim Genet. 2022 Dec;53(6):723-739. doi: 10.1111/age.13266. Epub 2022 Oct 2. Anim Genet. 2022. PMID: 36184760 Review.
Cited by
-
Comparative analysis of genotype imputation strategies for SNPs calling from RNA-seq.BMC Genomics. 2025 Mar 13;26(1):245. doi: 10.1186/s12864-025-11411-5. BMC Genomics. 2025. PMID: 40082746 Free PMC article.
-
Potential candidate genes influencing meat production phenotypic traits in sheep: a review.Front Vet Sci. 2025 Jul 16;12:1616533. doi: 10.3389/fvets.2025.1616533. eCollection 2025. Front Vet Sci. 2025. PMID: 40740300 Free PMC article. Review.
-
Preliminary Results about Lamb Meat Tenderness Based on the Study of Novel Isoforms and Alternative Splicing Regulation Pathways Using Iso-seq, RNA-seq and CTCF ChIP-seq Data.Foods. 2022 Apr 7;11(8):1068. doi: 10.3390/foods11081068. Foods. 2022. PMID: 35454655 Free PMC article.
-
Cis-eQTL Analysis and Functional Validation of Candidate Genes for Carcass Yield Traits in Beef Cattle.Int J Mol Sci. 2022 Dec 1;23(23):15055. doi: 10.3390/ijms232315055. Int J Mol Sci. 2022. PMID: 36499383 Free PMC article.
-
NCAPG Regulates Myogenesis in Sheep, and SNPs Located in Its Putative Promoter Region Are Associated with Growth and Development Traits.Animals (Basel). 2023 Oct 11;13(20):3173. doi: 10.3390/ani13203173. Animals (Basel). 2023. PMID: 37893897 Free PMC article.
References
MeSH terms
Substances
Grants and funding
LinkOut - more resources
Full Text Sources
Other Literature Sources
Miscellaneous
