

Subtyping CKD Patients by Consensus Clustering: The Chronic Renal Insufficiency Cohort (CRIC) Study
- PMID: 33462081
- PMCID: PMC7920178
- DOI: 10.1681/ASN.2020030239
Subtyping CKD Patients by Consensus Clustering: The Chronic Renal Insufficiency Cohort (CRIC) Study
Abstract
Background: CKD is a heterogeneous condition with multiple underlying causes, risk factors, and outcomes. Subtyping CKD with multidimensional patient data holds the key to precision medicine. Consensus clustering may reveal CKD subgroups with different risk profiles of adverse outcomes.
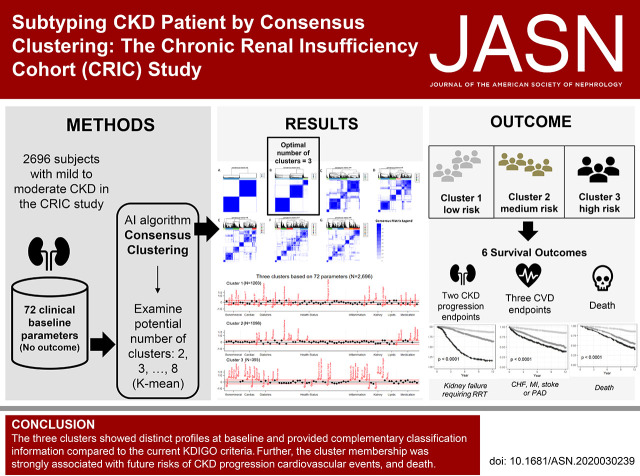
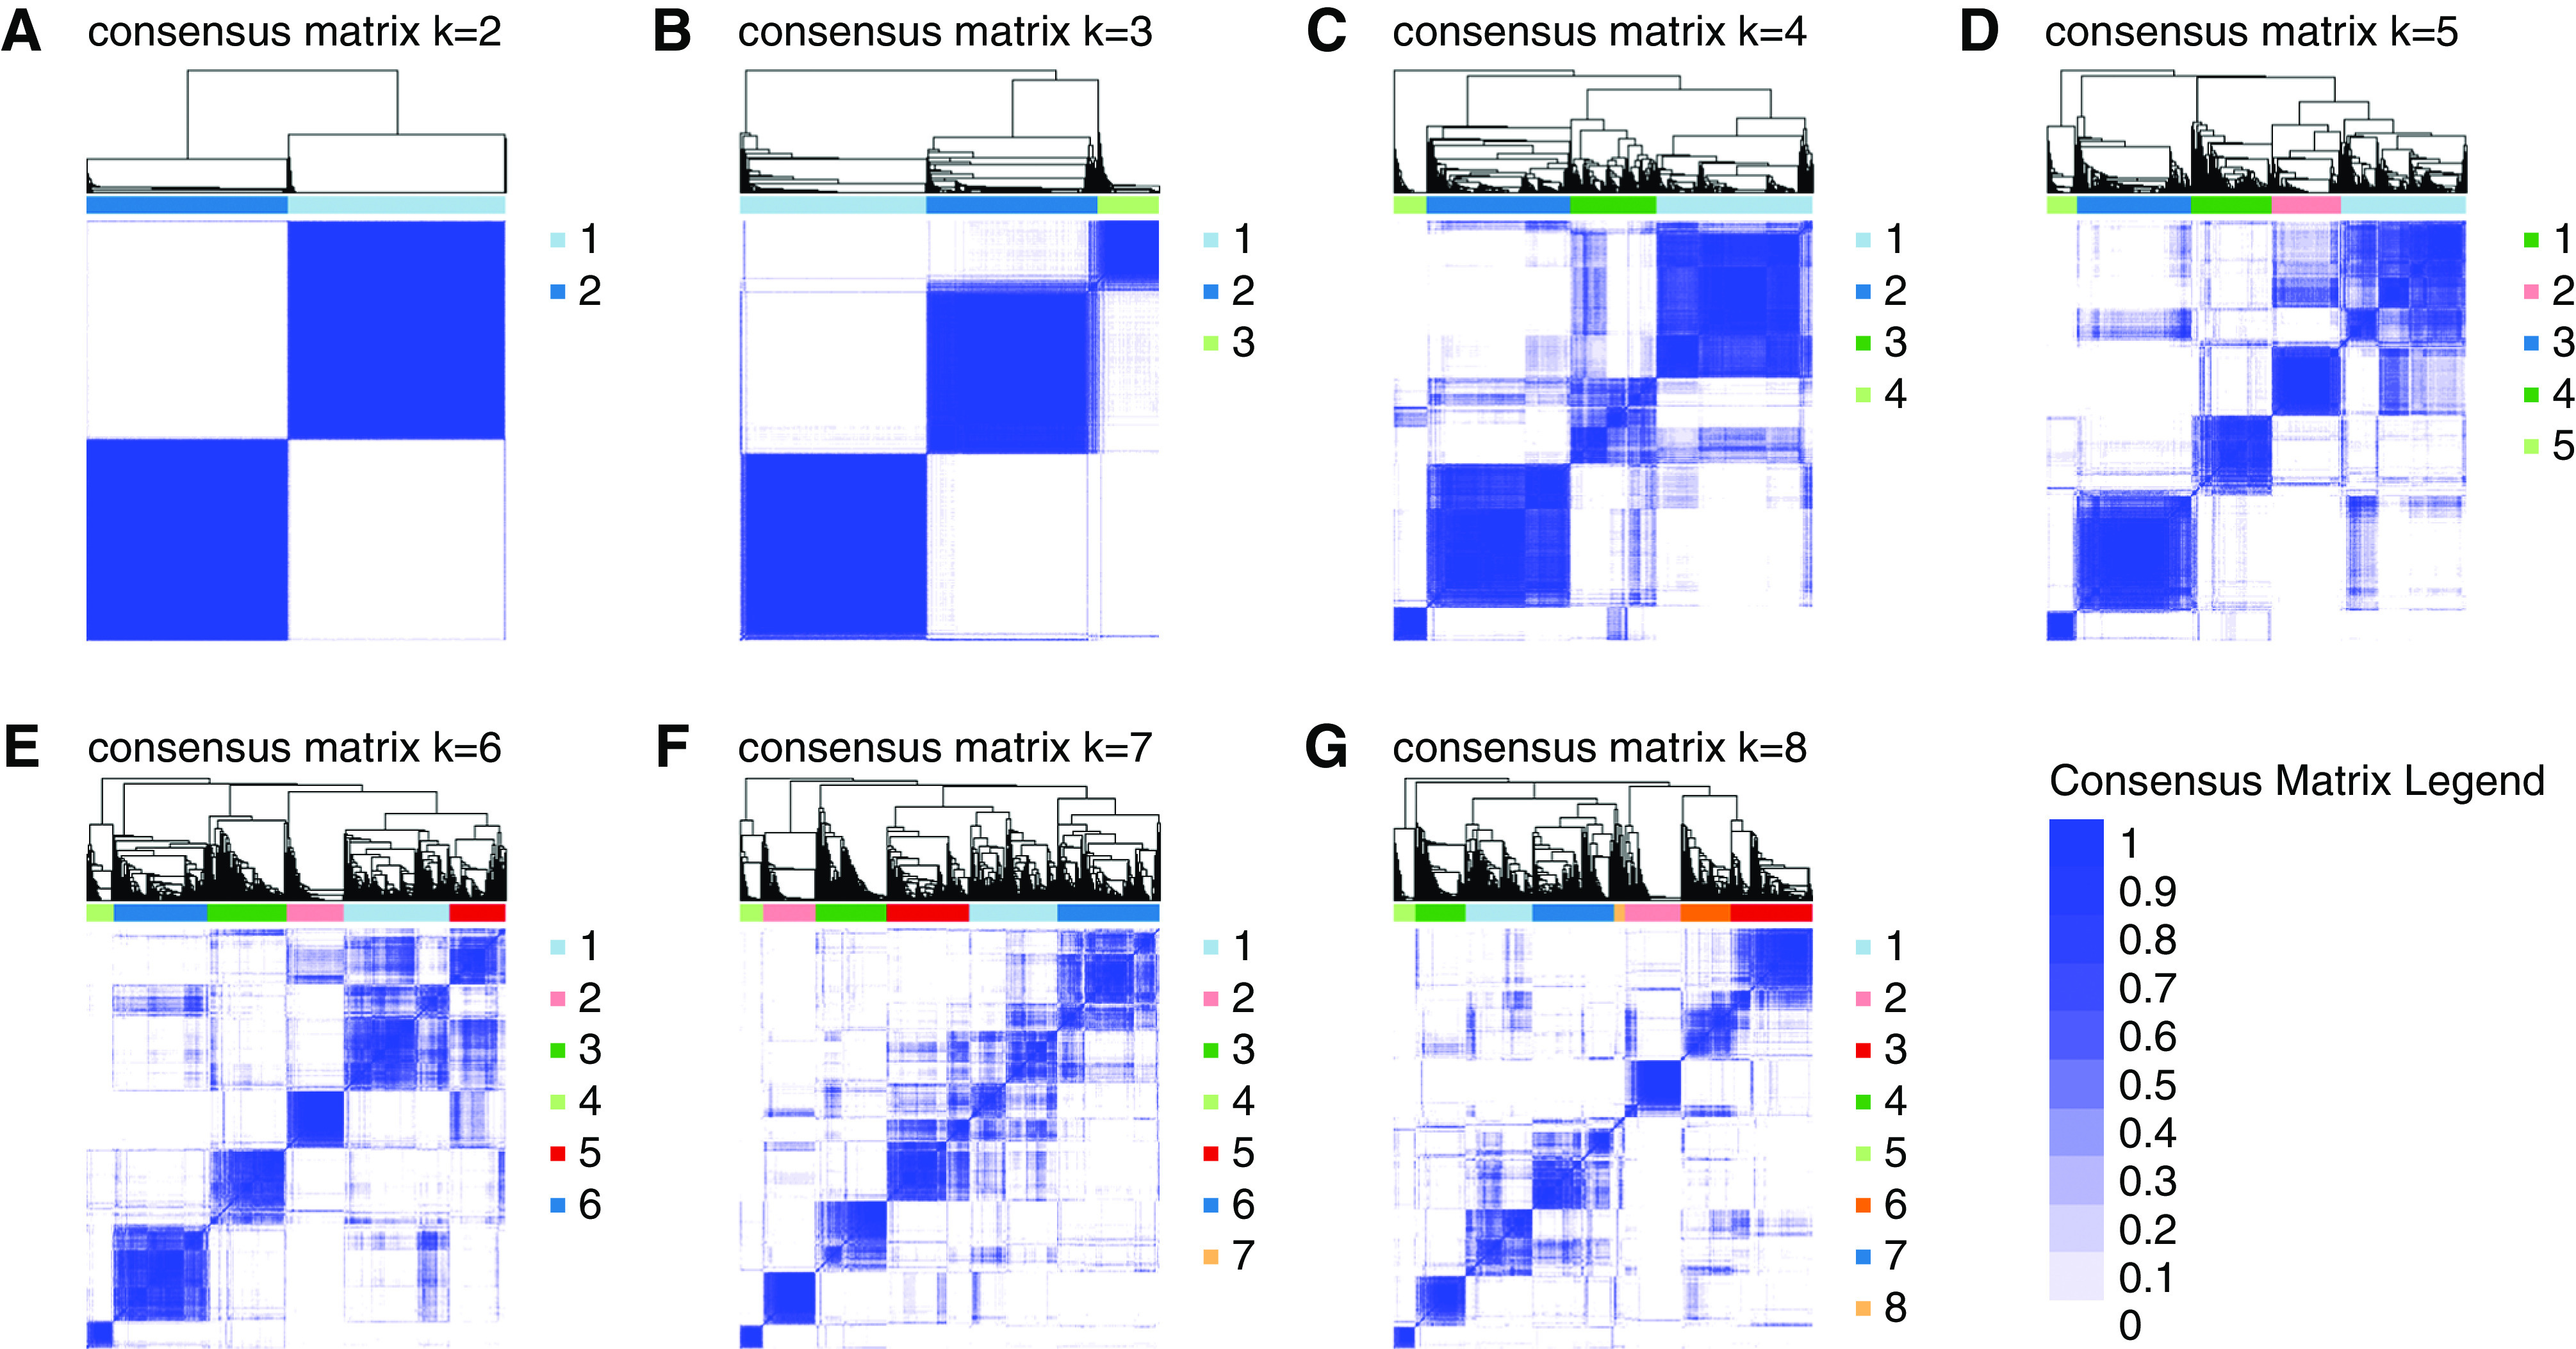
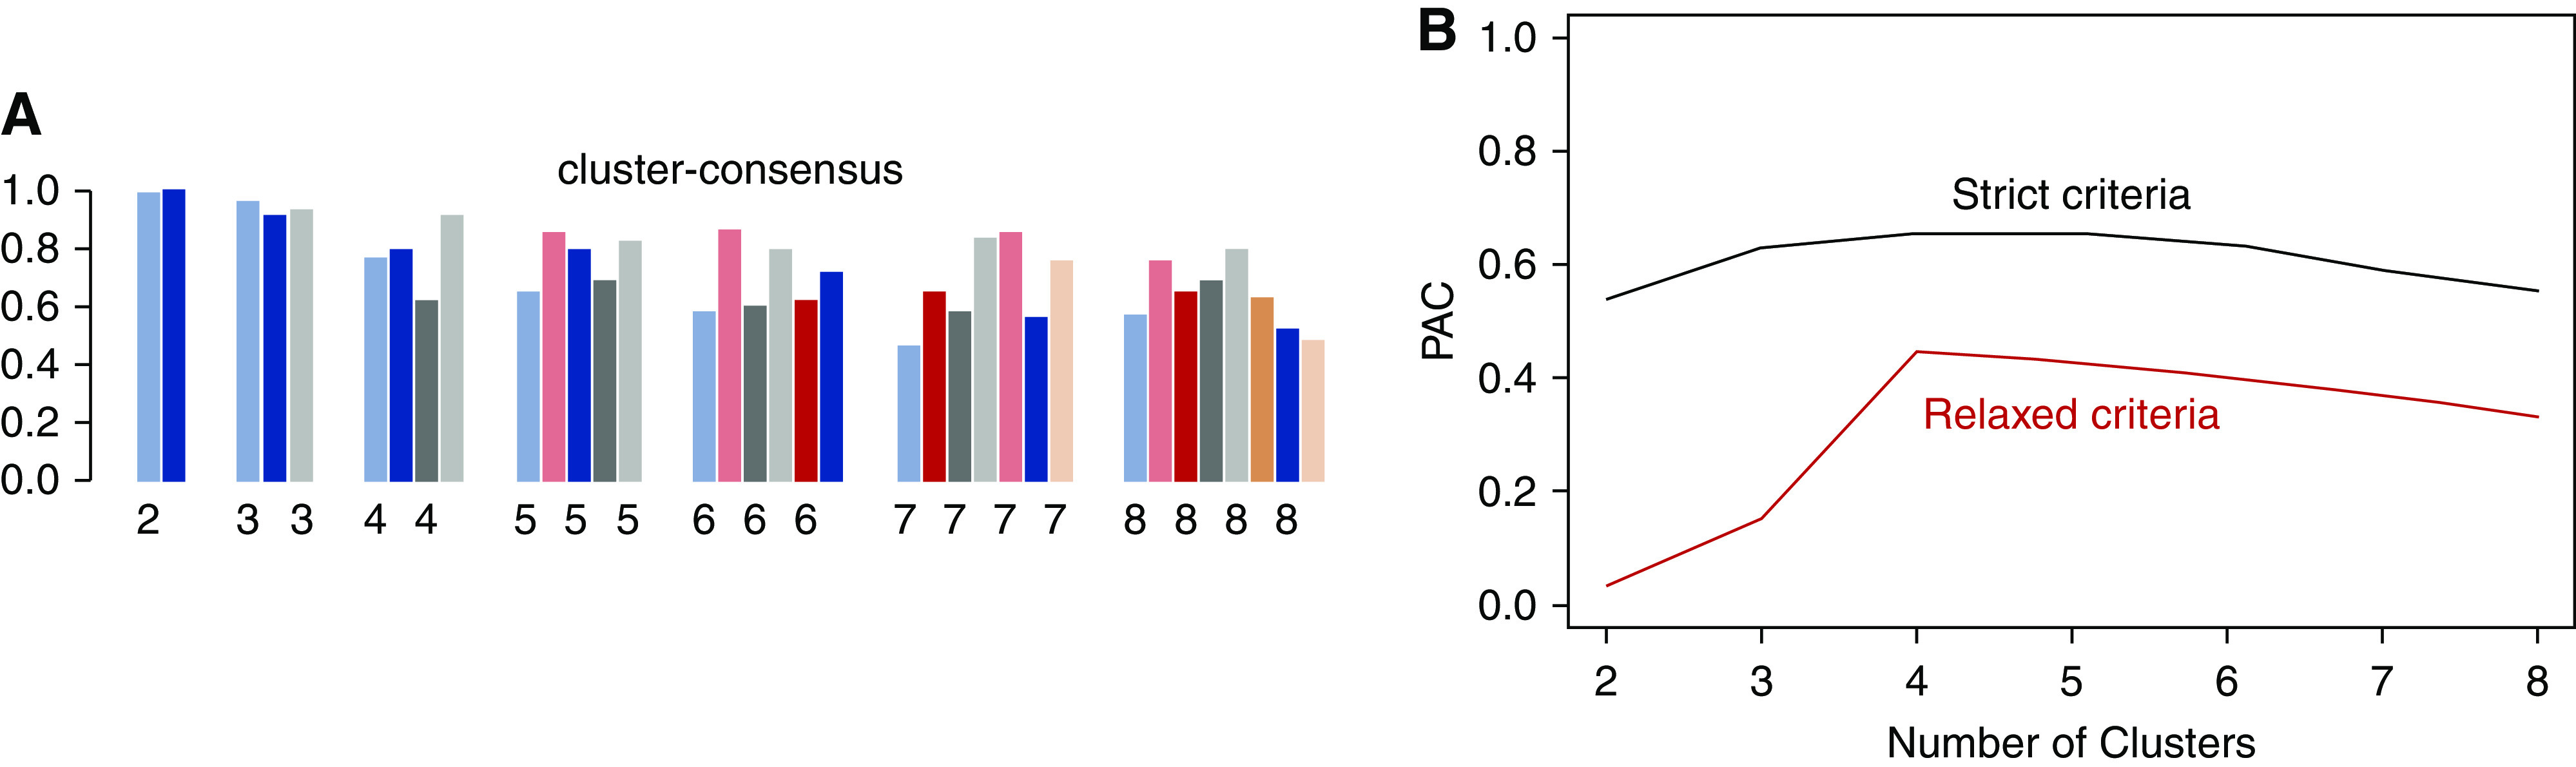
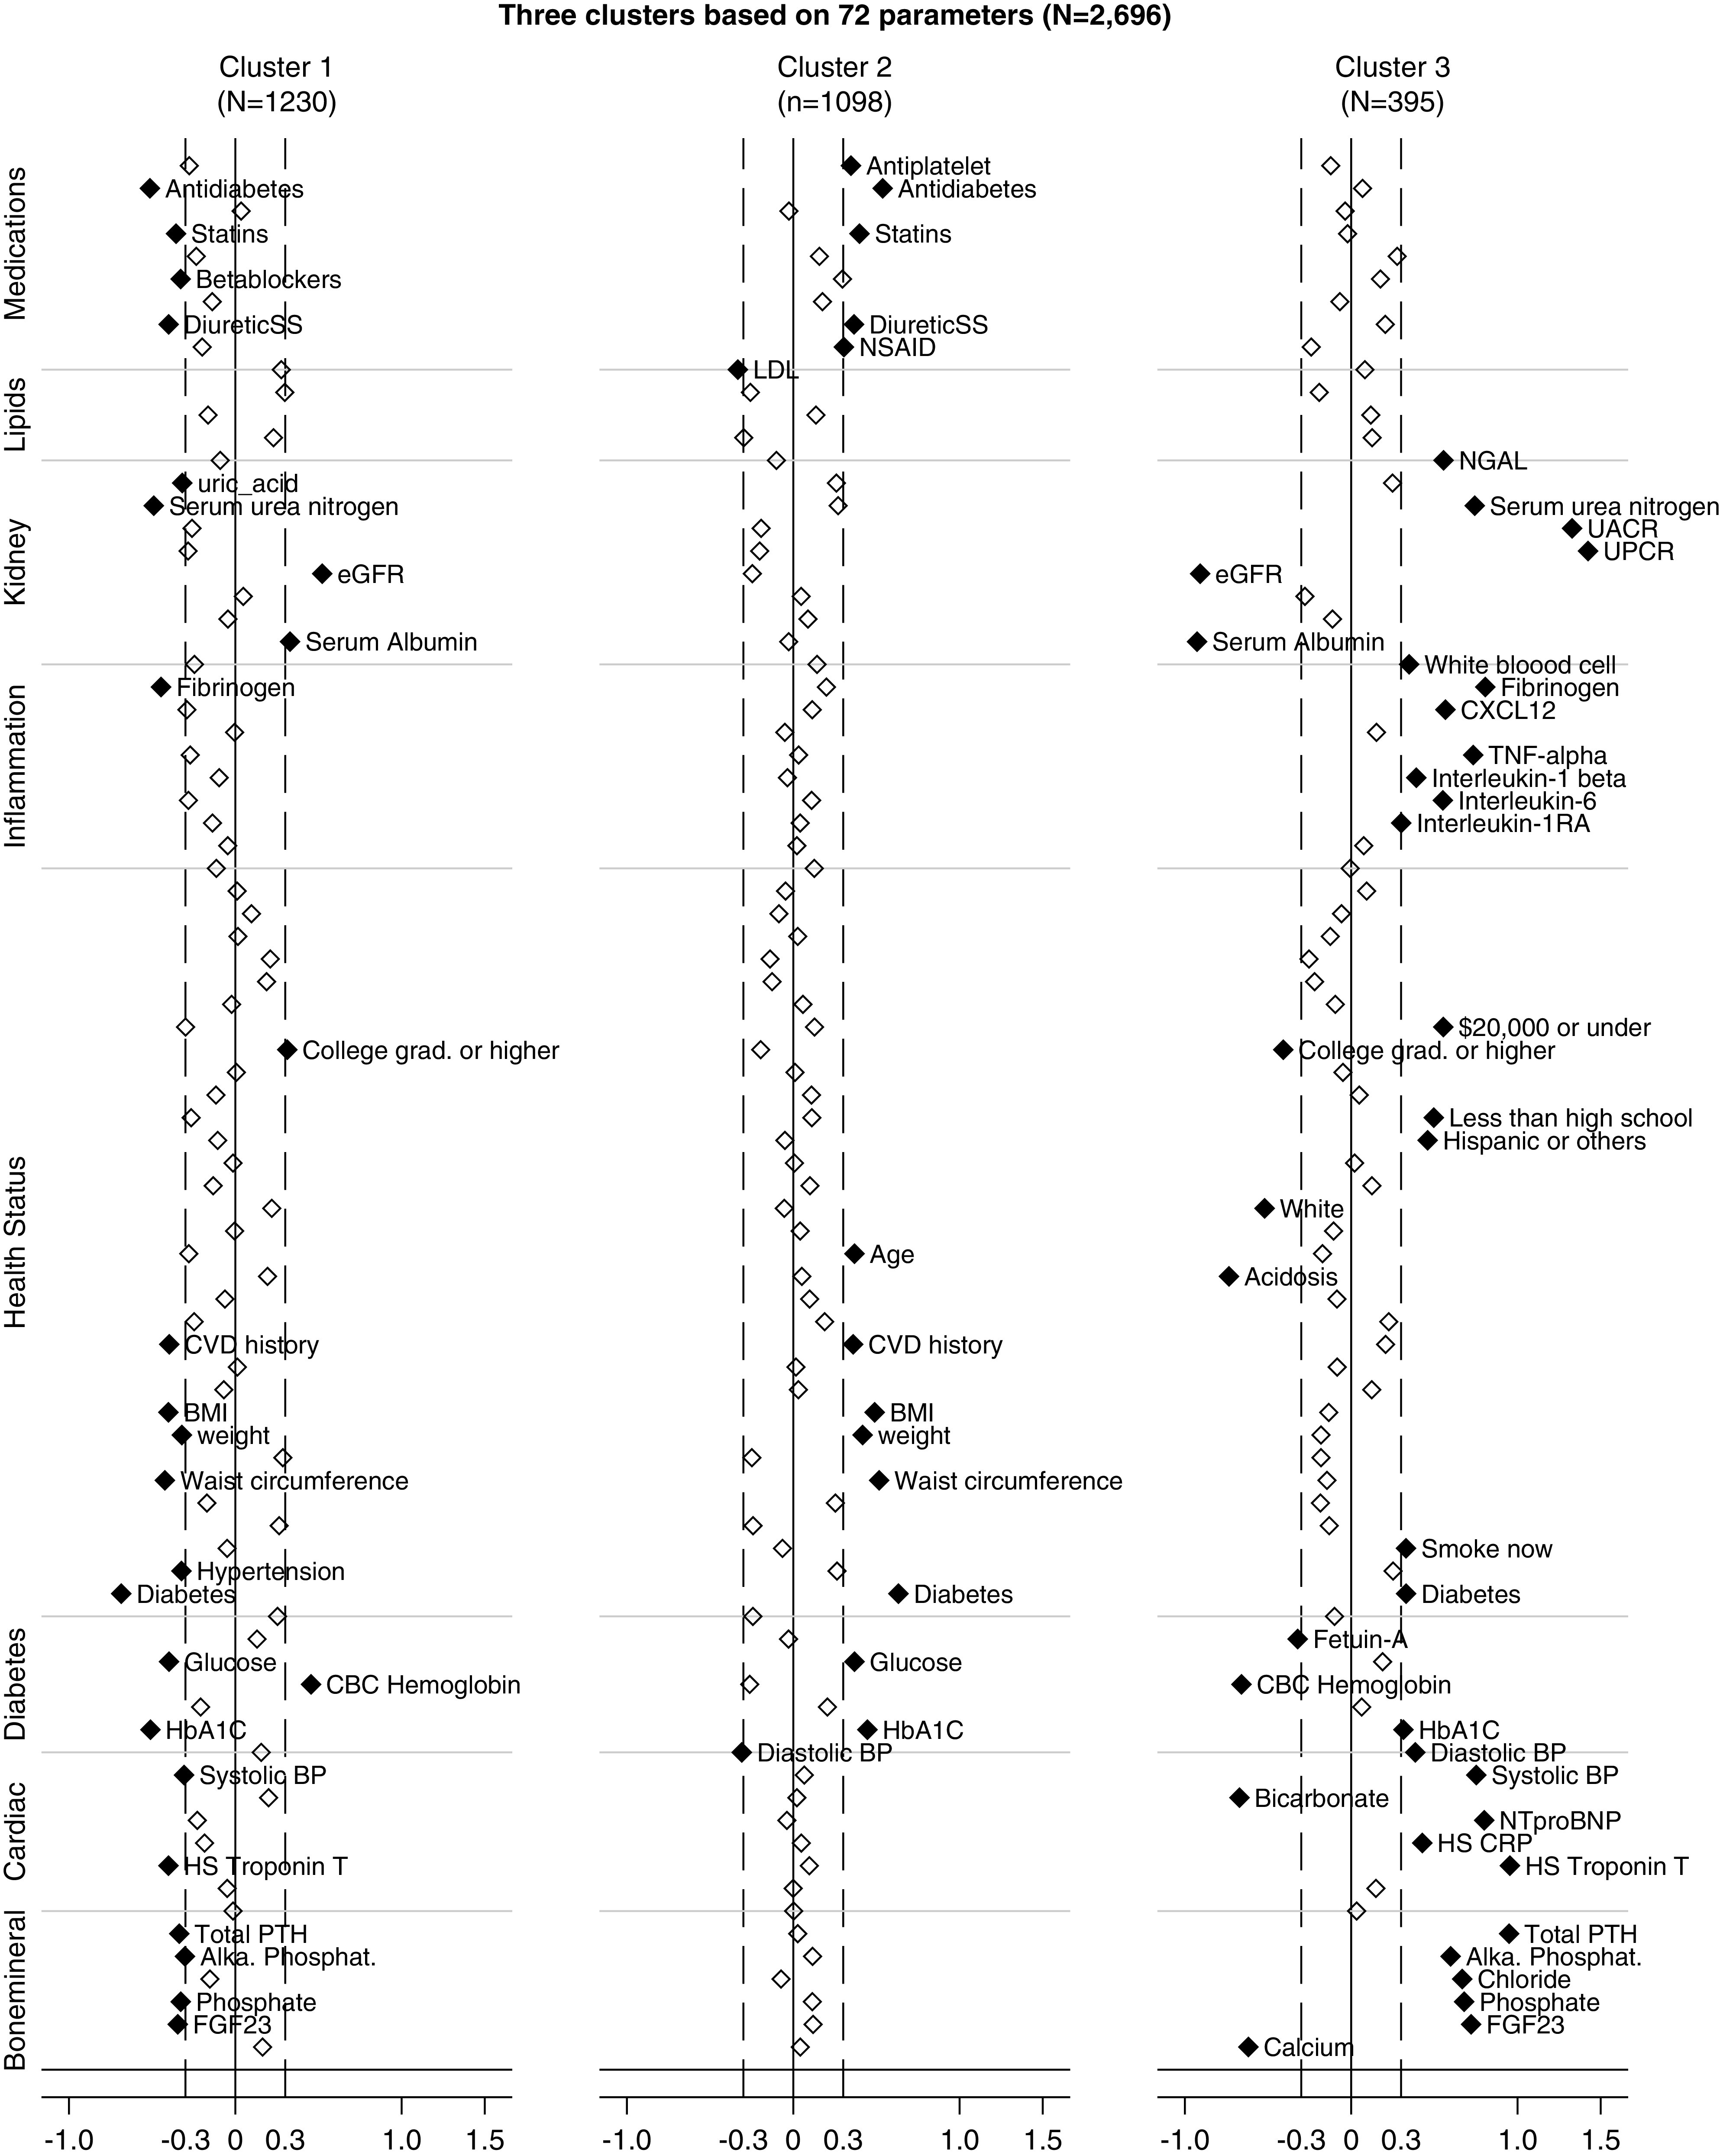
Methods: We used unsupervised consensus clustering on 72 baseline characteristics among 2696 participants in the prospective Chronic Renal Insufficiency Cohort (CRIC) study to identify novel CKD subgroups that best represent the data pattern. Calculation of the standardized difference of each parameter used the cutoff of ±0.3 to show subgroup features. CKD subgroup associations were examined with the clinical end points of kidney failure, the composite outcome of cardiovascular diseases, and death.
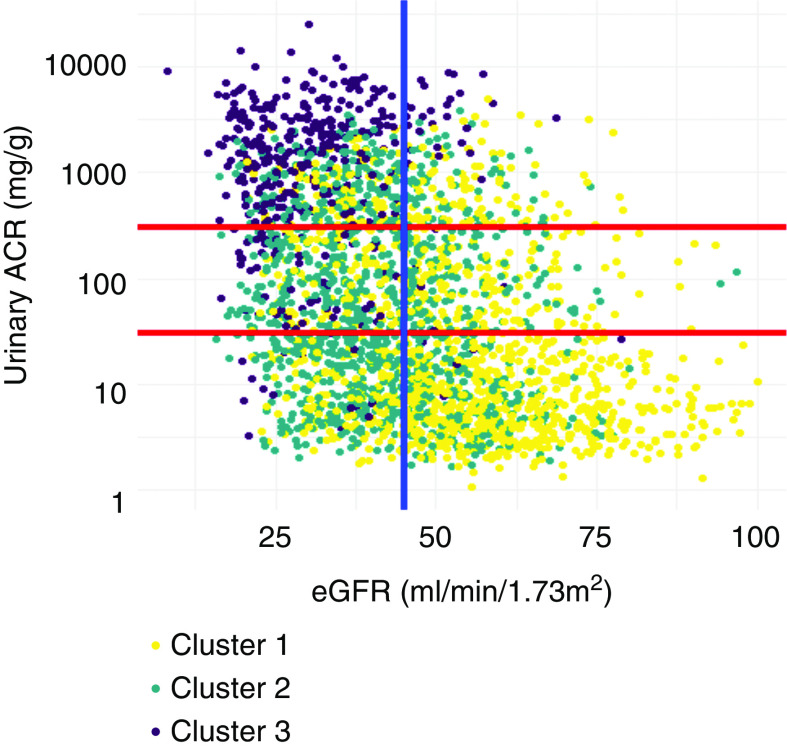
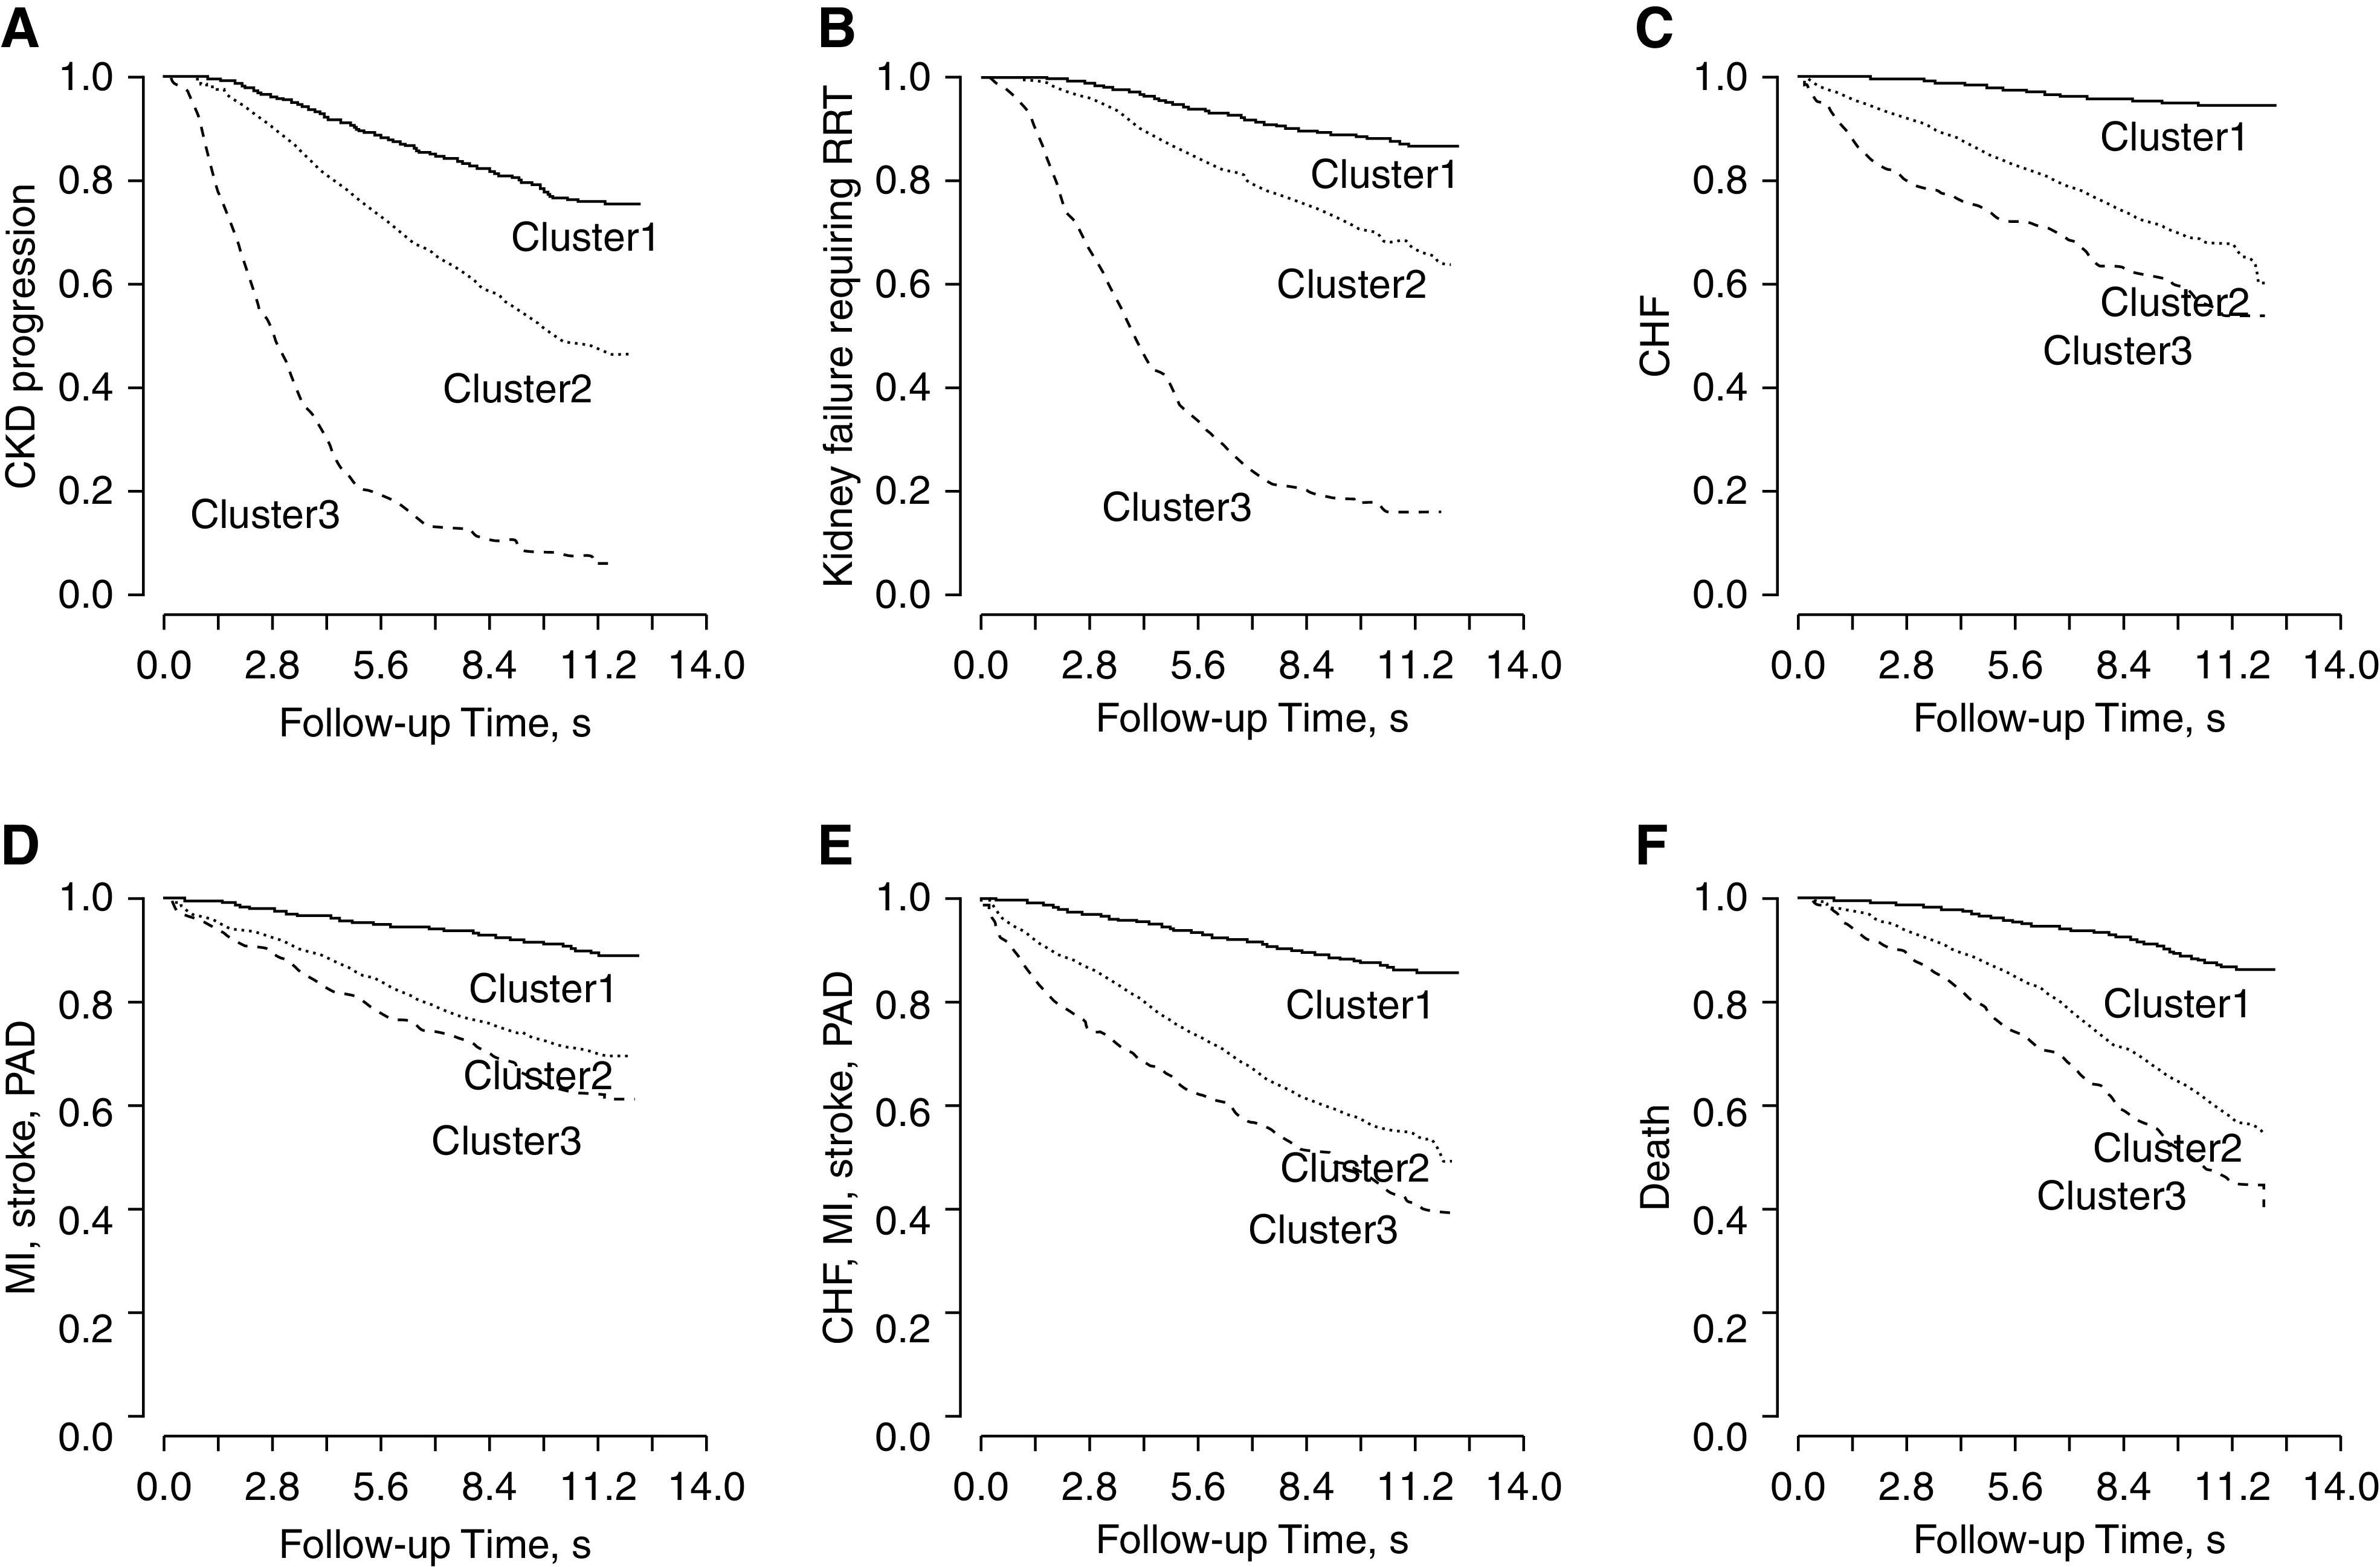
Results: The algorithm revealed three unique CKD subgroups that best represented patients' baseline characteristics. Patients with relatively favorable levels of bone density and cardiac and kidney function markers, with lower prevalence of diabetes and obesity, and who used fewer medications formed cluster 1 (n=1203). Patients with higher prevalence of diabetes and obesity and who used more medications formed cluster 2 (n=1098). Patients with less favorable levels of bone mineral density, poor cardiac and kidney function markers, and inflammation delineated cluster 3 (n=395). These three subgroups, when linked with future clinical end points, were associated with different risks of CKD progression, cardiovascular disease, and death. Furthermore, patient heterogeneity among predefined subgroups with similar baseline kidney function emerged.
Conclusions: Consensus clustering synthesized the patterns of baseline clinical and laboratory measures and revealed distinct CKD subgroups, which were associated with markedly different risks of important clinical outcomes. Further examination of patient subgroups and associated biomarkers may provide next steps toward precision medicine.
Keywords: CKD subgroups; clustering analysis; patient heterogeneity; survival.
Copyright © 2021 by the American Society of Nephrology.
Figures
References
-
- Centers for Disease Control and Prevention: Chronic Kidney Disease in the United States, 2019, Atlanta, GA, US Department of Health and Human Services, Centers for Disease Control and Prevention, 2019
-
- Levin A, Stevens PE: Summary of KDIGO 2012 CKD Guideline: Behind the scenes, need for guidance, and a framework for moving forward. Kidney Int 85: 49–61, 2014 - PubMed
-
- Levey AS, Inker LA: GFR as the “gold standard”: Estimated, measured, and true. Am J Kidney Dis 67: 9–12, 2016 - PubMed
-
- Tervaert TWC, Mooyaart AL, Amann K, Cohen AH, Cook HT, Drachenberg CB, et al. .; Renal Pathology Society: Pathologic classification of diabetic nephropathy. J Am Soc Nephrol 21: 556–563, 2010 - PubMed
Publication types
MeSH terms
Grants and funding
- UL1 TR001863/TR/NCATS NIH HHS/United States
- U01 DK060963/DK/NIDDK NIH HHS/United States
- U01 DK060980/DK/NIDDK NIH HHS/United States
- R01 DK119199/DK/NIDDK NIH HHS/United States
- UL1 TR000003/TR/NCATS NIH HHS/United States
- UL1 TR000439/TR/NCATS NIH HHS/United States
- U01 DK060990/DK/NIDDK NIH HHS/United States
- U01 DK061022/DK/NIDDK NIH HHS/United States
- UL1 RR029879/RR/NCRR NIH HHS/United States
- U01 DK061028/DK/NIDDK NIH HHS/United States
- UL1 TR000433/TR/NCATS NIH HHS/United States
- UL1 TR001878/TR/NCATS NIH HHS/United States
- U01 DK061021/DK/NIDDK NIH HHS/United States
- U24 DK060990/DK/NIDDK NIH HHS/United States
- P30 DK079310/DK/NIDDK NIH HHS/United States
- UL1 RR024131/RR/NCRR NIH HHS/United States
- U01 DK060984/DK/NIDDK NIH HHS/United States
- UL1 TR000424/TR/NCATS NIH HHS/United States
- M01 RR016500/RR/NCRR NIH HHS/United States
- P20 GM109036/GM/NIGMS NIH HHS/United States
- U01 DK060902/DK/NIDDK NIH HHS/United States
LinkOut - more resources
Full Text Sources
Other Literature Sources
Medical
