. 2021 Jan 18;12(1):418.
doi: 10.1038/s41467-020-20687-y.

Mathematical model of COVID-19 intervention scenarios for São Paulo-Brazil

Affiliations

Mathematical model of COVID-19 intervention scenarios for São Paulo-Brazil

Osmar Pinto Neto et al. Nat Commun. .

Abstract

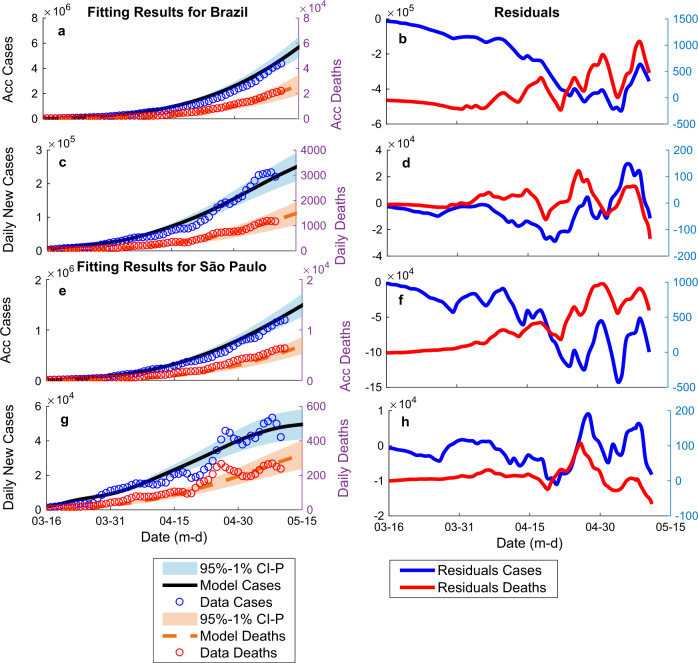
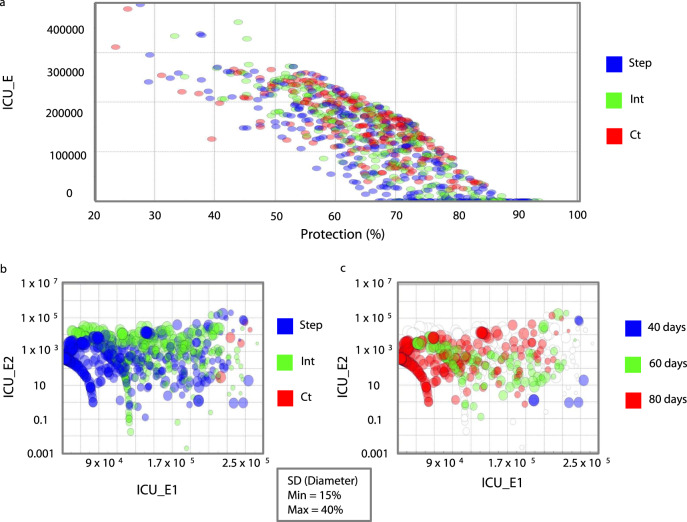
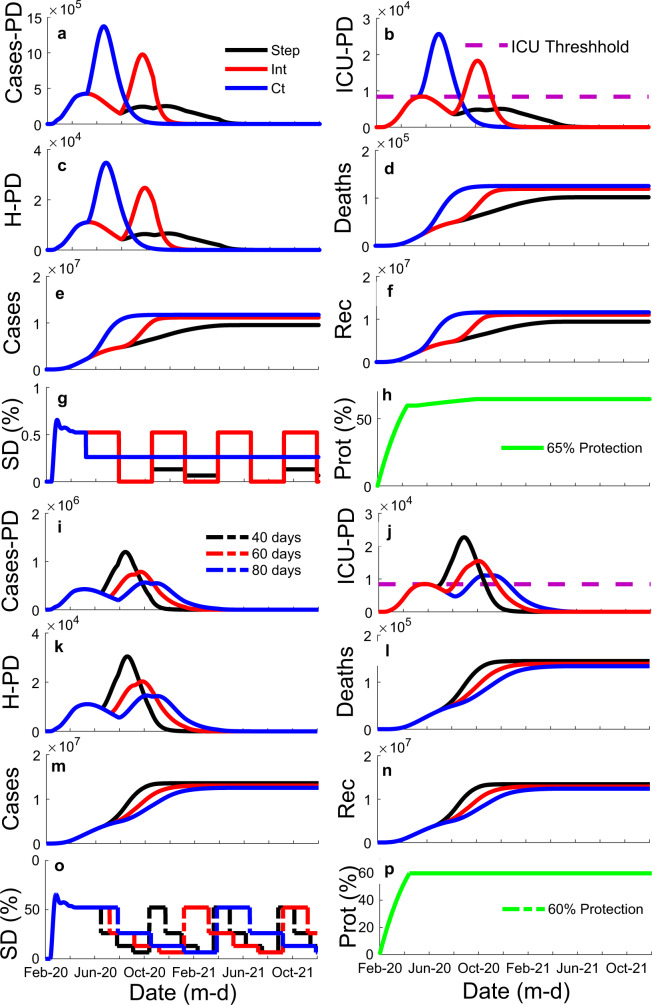
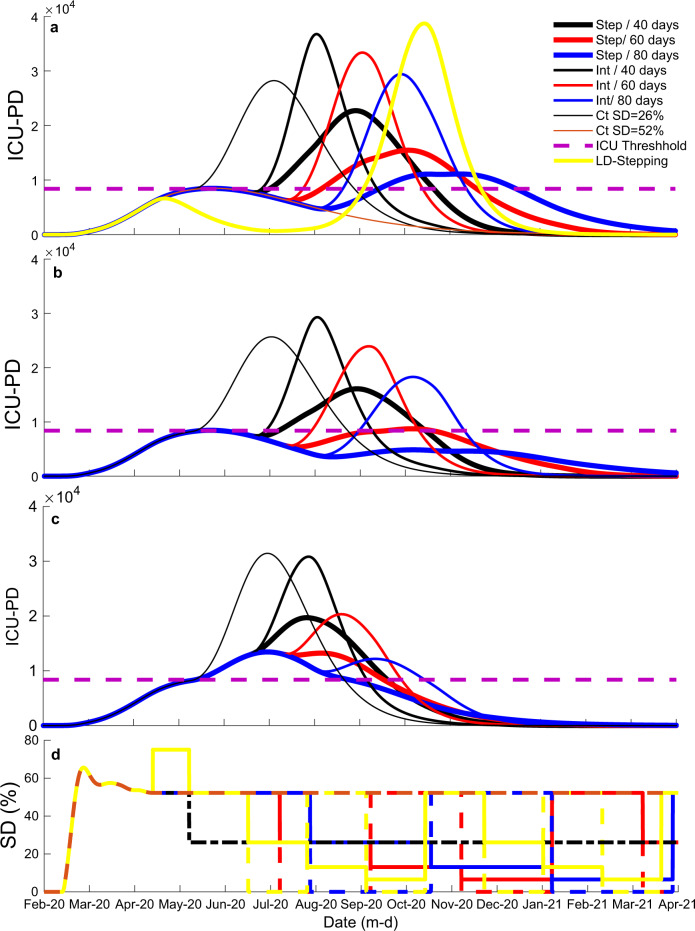
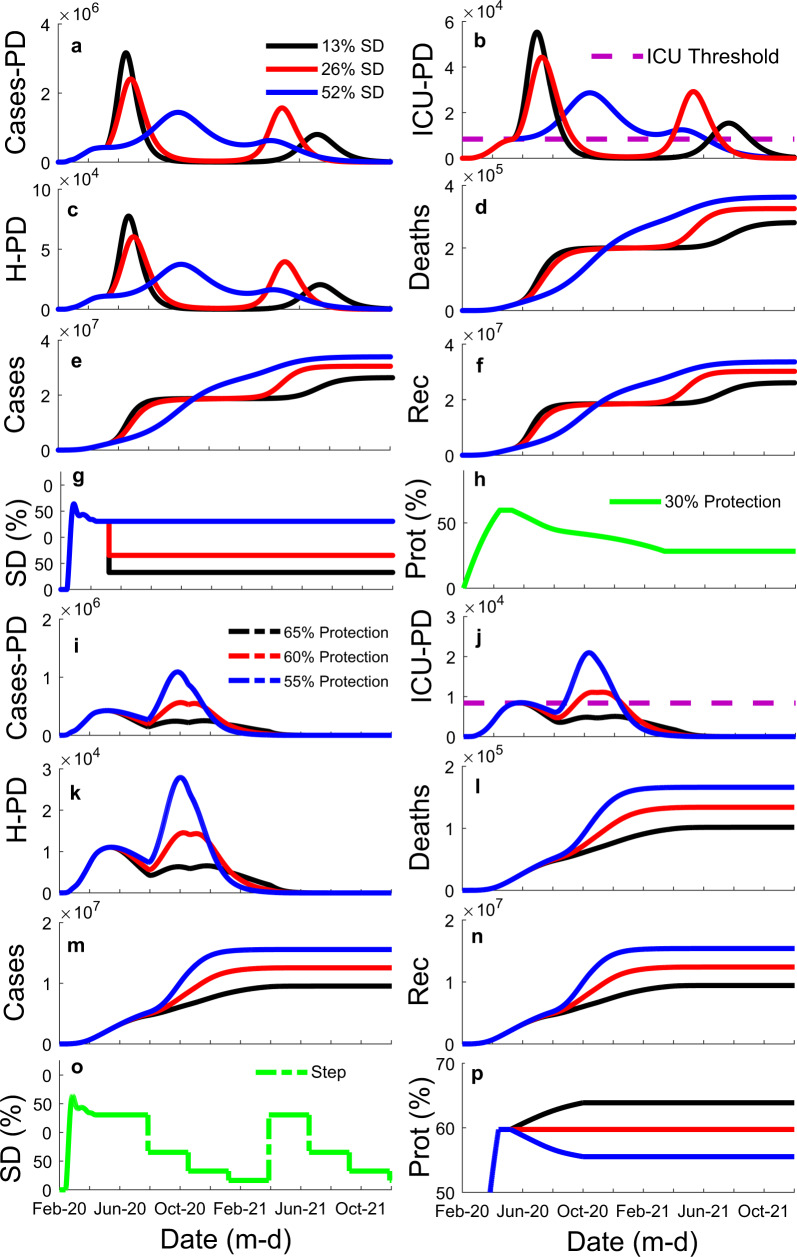
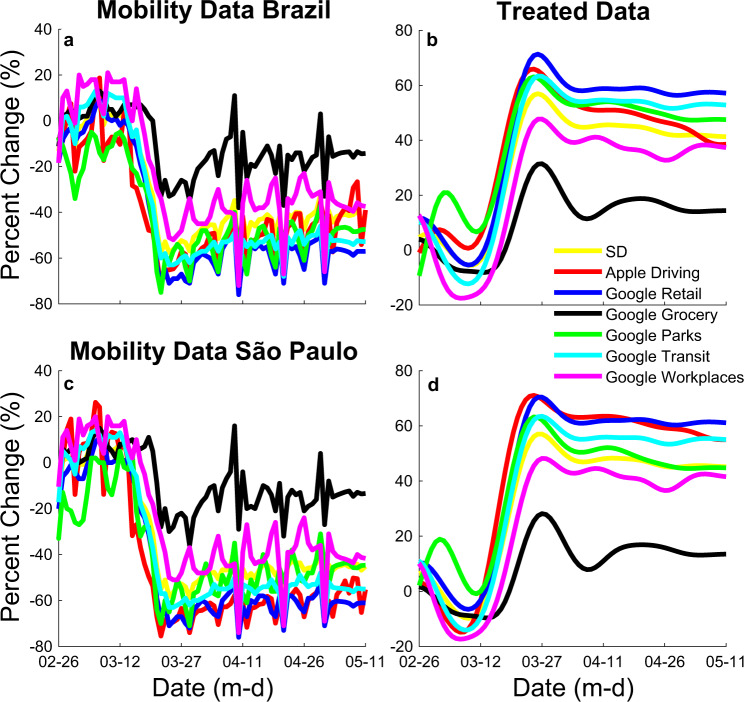
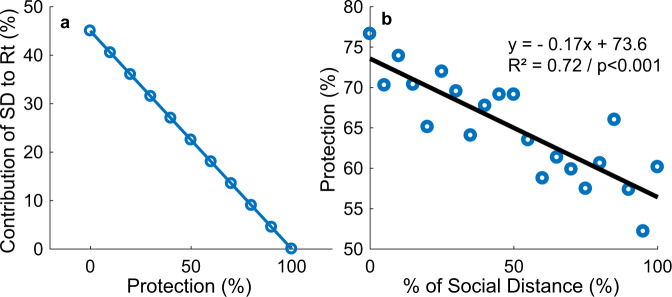
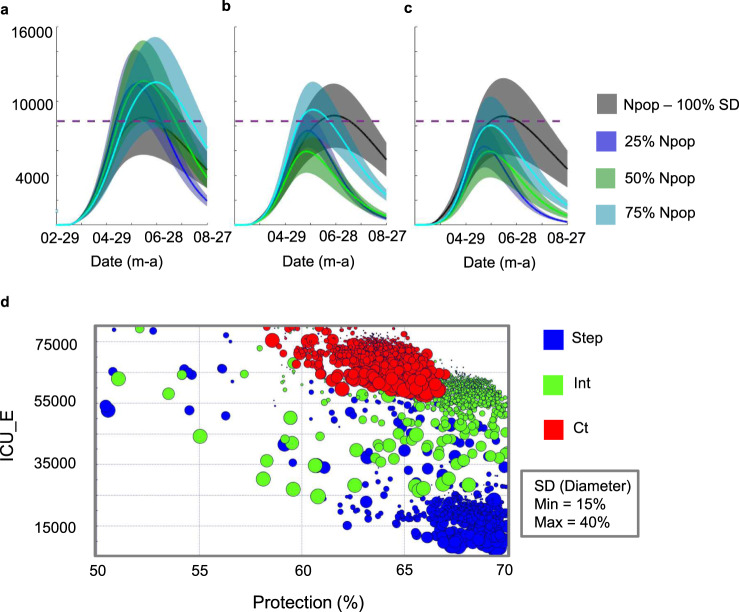
With COVID-19 surging across the world, understanding the effectiveness of intervention strategies on transmission dynamics is of primary global health importance. Here, we develop and analyze an epidemiological compartmental model using multi-objective genetic algorithm design optimization to compare scenarios related to strategy type, the extent of social distancing, time window, and personal protection levels on the transmission dynamics of COVID-19 in São Paulo, Brazil. The results indicate that the optimal strategy for São Paulo is to reduce social distancing over time with a stepping-down reduction in the magnitude of social distancing every 80-days. Our results also indicate that the ability to reduce social distancing depends on a 5-10% increase in the current percentage of people strictly following protective guidelines, highlighting the importance of protective behavior in controlling the pandemic. Our framework can be extended to model transmission dynamics for other countries, regions, states, cities, and organizations.


Conflict of interest statement

The authors declare no competing interests.

Figures

Fig. 1
Fig. 1. Fitting results for cases and deaths for Brazil and São Paulo.
a Corrected accumulated (Acc) cases and deaths for Brazil. b Acc data fitting residuals for Brazil. c Corrected daily new cases and deaths for Brazil. d Daily data fitting residuals for Brazil. e Corrected Acc cases and deaths for São Paulo. f Acc data fitting residuals for São Paulo. g Corrected daily new cases and deaths for São Paulo. h Daily data fitting residuals for São Paulo. Black lines represent the best-fit model expected cases; red dashed lines represent the best-fit model expected deaths. Blue circles are COVID-19 official data cases’ data, and red circles are official deaths, both corrected by sub-testing factors. Blue and red shaded regions show confidence intervals of 95%, considering the 2.5 and 97.5% quantiles of the distribution of n = 300 uniformly distributed 1% errors or perturbations done to the best-fit model parameters.
Fig. 2
Fig. 2. Mitigation strategies optimization results for the state of São Paulo.
a Design of experiment results showing the influence of social distancing (SD) strategy (red color indicates constant (Ct) SD strategy; green color indicates intermittent (Int) SD strategy; blue color indicates stepping down (Step) SD strategy) and the percentage ratio of the unsusceptible or protected people over the whole population (Protection), x-axis, on the total number of critical cases over the ICU threshold (ICU_E), y-axis, for the entire period of analysis (end-day 25 December 2021). b Constrained optimization results showing the influence of strategy (color) and SD magnitude (circle diameters corresponding to variations between 15 and 40%) on the number of critical cases over ICU threshold for the first (ICU_E1), x-axis, and the second peak of the pandemic (ICU_E2), y-axis. c Constrained optimization results showing the influence of Window size (red color indicates 80-day windows; green color indicates 60-day windows; blue color indicates 80-day windows) and SD magnitude (circle diameters) on ICU_E1, x-axis, and ICU_E2, y-axis.
Fig. 3
Fig. 3. Illustration of the influence of social distancing (SD) variation strategies (stepping down, intermittent, and constant) and different time windows (40, 60, and 80 days) on the model results for the state of São Paulo.
It shows influence of strategy (colored lines: black—stepping down (step); red—intermittent (Int); blue—constant (Ct)) through time, x-axis, on: a the number of cases per day (Cases-PD); b the number of estimated intensive care unit patients per day (ICU-PD); c the number of estimated hospitalized patients per day (H-PD); d the number of estimated accumulated deaths; e the number of accumulated cases; and f the number of recuperated cases. g Manipulations of SD through time, illustrating the three different strategies tested. h The percentage ratio of the unsusceptible or protected people over the whole population (protection—Prot (%)) through time for graphs af. It also shows the influence of different time windows (colored lines: black—40-days; red—60 days; blue—80 days)) through time, x-axis, on: i Cases-PD; j ICU-PD; k H-PD; l accumulated deaths; m accumulated cases; and n recuperated cases. o Manipulations of SD through time for graphs in, all three curves represent a stepping down strategy, but with three different time window sizes. p Protection through time for graphs in.
Fig. 4
Fig. 4. Representative model results for intensity care units bed occupancy per day (ICU_PD or critical cases) results for the state of São Paulo.
a Nine different scenarios showing the influence of strategy (line thickness: stepping down (step)—thick; intermittent (Int)—intermediate; constant (Ct)—thin; line color yellow: lockdown followed by stepping down—LD-stepping) and window size (line color: black—40-days; red—60 days; blue—80 days) with the percentage ratio of the unsusceptible people over the whole population (protection) kept at the current state-level of 60%; for the stepping and intermittent scenarios, social distancing (SD) maximum magnitude is kept at current levels, as estimated by mobility data (SD = 52%); for the LD-stepping scenario there is a 40-day 75% SD (lockdown) period followed by a 80-day stepping strategy with SD maximum magnitude of 52%. b Similar scenarios but with 70% protection, instead of 60%. c Similar scenarios with 70% protection and 40% maximum SD, instead of 52%. d Manipulations of SD through time, illustrating all scenarios tested. Dashed purple line indicates the total number of available ICU for the state.
Fig. 5
Fig. 5. Illustration of the influence of different mean social distance (SD) magnitude (13, 26, and 52%) and different percentage ratios of the unsusceptible or protected people over the whole population (protection—65, 60, and 55%) on the model results for the state of São Paulo.
It shows influence of SD (colored lines: black—13%; red—26%; blue—52%) through time, x-axis, on: a the number of cases per day (Cases-PD); b the number of estimated Intensive Care Unit patients per day (ICU-PD); c the number of estimated Hospitalized patients per day (H-PD)); d the number of estimated accumulated deaths; e the number of accumulated cases; and f the number of recuperated cases. g Constant strategy SD curves illustrating the three different magnitude tested. h The percentage ratio of the unsusceptible or protected people over the whole population (protection—Prot (%)) through time for graphs af. It also shows the influence of different protection levels (colored lines: black—65% endpoint; red—60% endpoint; blue—55% endpoint) through time, x-axis, on: i Cases-PD; j ICU-PD; k H-PD; l accumulated deaths; m accumulated cases; and n recuperated cases. o Manipulation of SD through time for graphs in, a stepping down strategy. p The three protection levels tested in graphs in.
Fig. 6
Fig. 6. Mobility trends raw and treated data from Apple Maps and community mobility reports from Google.
a Mobility data for Brazil. b Treated mobility data for Brazil. c Mobility data for the state of São Paulo. d Treated mobility data for for the state of São Paulo. Data were low-pass filter filtered at 0.09 Hz (Butterworth fourth order), and percentage changes from baseline were considered (Apple’s driving data were averaged with Google’s retail and recreation, grocery and pharmacy, parks, transit stations, and workplaces). Social distancing (SD, yellow) was determined as the mean of Apple Driving (red) and Googles’ Retail (blue), Grocery (Black), Parks (Green), Transit (Blue), and Workplaces (pink) treated data.
Fig. 7
Fig. 7. The relationship between social distancing (SD) and the percentage ratio of the unsusceptible or protected people over the whole population (Protection).
a It shows how the effect of a 45% SD in reducing effective reproduction number (Rt) as Protection percentage increases from 0 to 100%. b Sensitivity analysis determining the effect of changes in social distancing (SD) on protection percentage, considering 5% decrements to the magnitude of SD with respective linear regression equation, y = −0.17x + 73.6, and Pearson’s correlation coefficient squared, R2 = 0.72, F1,19 = 48.891, p < 0.001, 95% CI [−0.223, −0.120].
Fig. 8
Fig. 8. Sensitivity analysis considering the impact of having the pandemic spread contained within localized pockets within the state of São Paulo on the progression of the disease estimated by our model and mitigation strategies optimization results for the worst-case scenario investigated in terms of the number of critical cases per day (ICU-PD).
Panel a considers having all cases recorded coming from 25, 50, or 75% of the states’ population (Npop) and isolation has no direct impact in social distancing (SD) magnitude, as estimated by mobility data (100% SD). panel b considers isolation causes a decrease of 25% in the effect of SD on the disease’s transmission rate (75% SD). Panel c considers isolation causes a decrease of 50% in the impact of SD (50% SD). For ac protection rate (α) was kept constant across all scenarios and all other model parameters optimized for each scenario and future values of social distancing and protection were chosen to stay at current levels. For comparison, they also show the scenario with no part of the population isolated (Npop and 100% SD). Shaded regions show confidence intervals of 95%, considering the 2.5 and 97.5% quantiles of the distribution of n = 300 uniformly distributed 1% errors or perturbations to the model parameters. d Mitigation strategy optimization results for 50% isolation and 100% SD showing the impact of different strategies, in color, and the percentage ratio of the unsusceptible or protected people over the whole population (Protection), x-axis, on the total number of critical cases over the ICU threshold (ICU_E), y-axis, predicted till 25 December 2021. Red color indicates constant (Ct) SD strategy, green color indicates intermittent (Int) strategy, and blue color indicates a stepping (Step) down strategy, SD values are shown from 15 to 40% by the diameters of the circles.

References

    1. World Health Organization. Coronavirus Disease 2019 (COVID-19) Situation Report. 70. https://www.who.int/docs/default-source/coronaviruse/situation-reports/2....
    1. WorldoMeter. COVID-19. https://www.worldometers.info/coronavirus/ (2020).
    1. Institute for Health Metrics and Evaluation (IHME). COVID-19 Projections. https://covid19.healthdata.org/united-states-of-america (2020).
    1. Mellan, T. A. et al. Report 21: Estimating COVID-19 Cases and Reproduction Number in Brazil (Imperial College, 2020).
    1. Anastassopoulou C, Russo L, Tsakris A, Siettos C. Data-based analysis, modelling and forecasting of the COVID-19 outbreak. PLoS ONE. 2020;15:e0230405. doi: 10.1371/journal.pone.0230405. - DOI - PMC - PubMed