. 2021 Jan 18;12(1):430.
doi: 10.1038/s41467-020-20658-3.

A clinically applicable and scalable method to regenerate T-cells from iPSCs for off-the-shelf T-cell immunotherapy

Affiliations

A clinically applicable and scalable method to regenerate T-cells from iPSCs for off-the-shelf T-cell immunotherapy

Shoichi Iriguchi et al. Nat Commun. .

Abstract

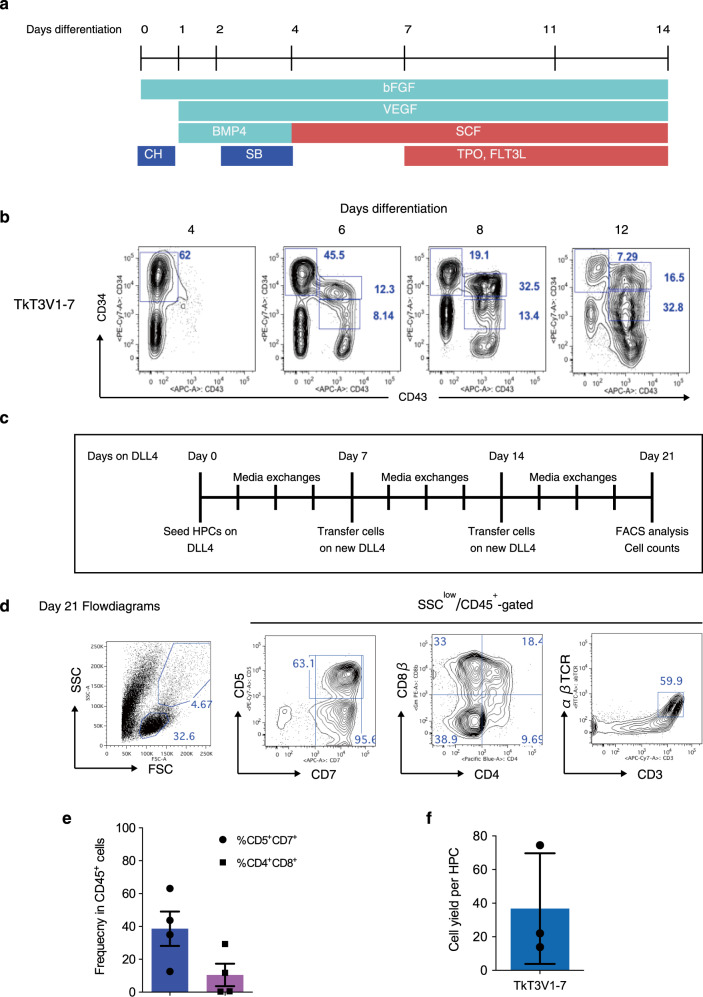
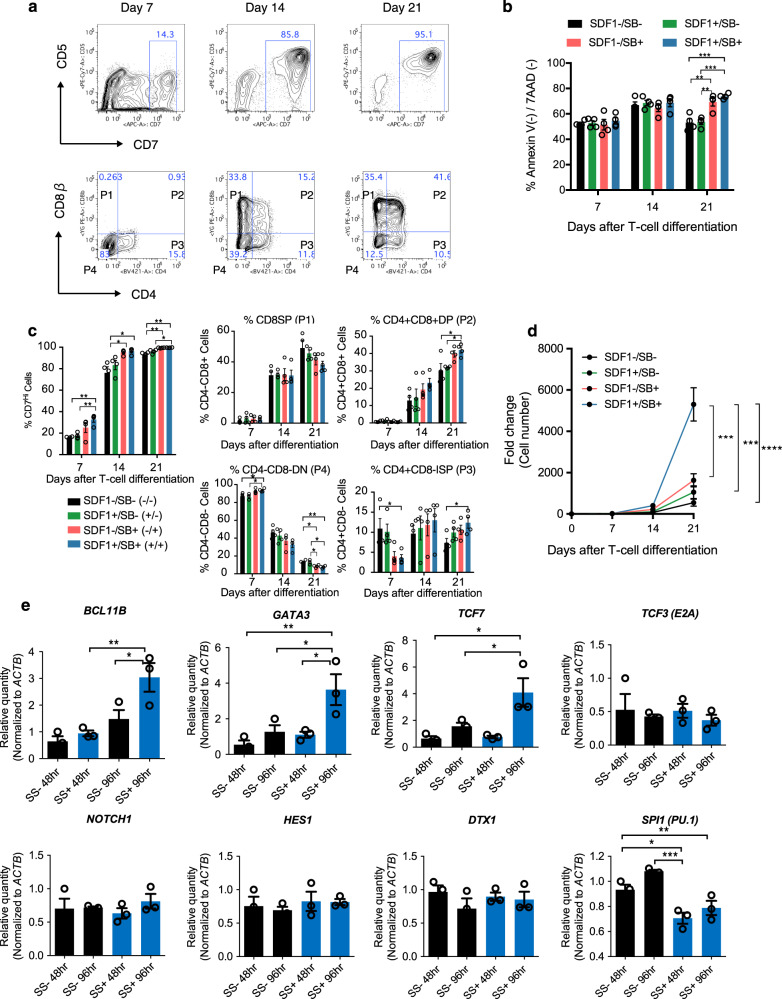
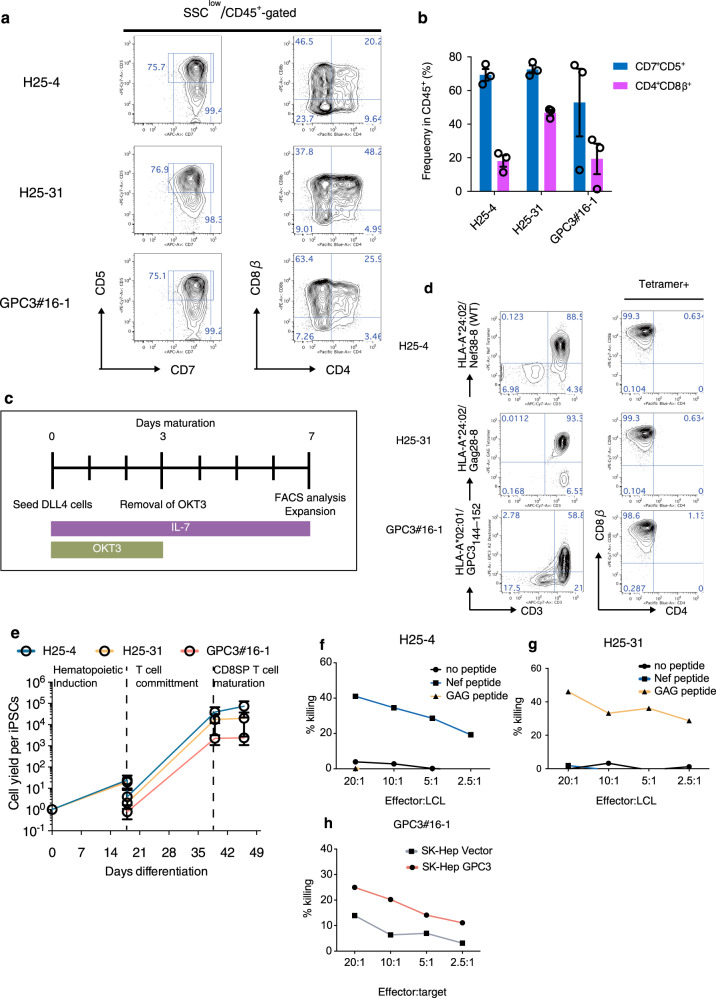
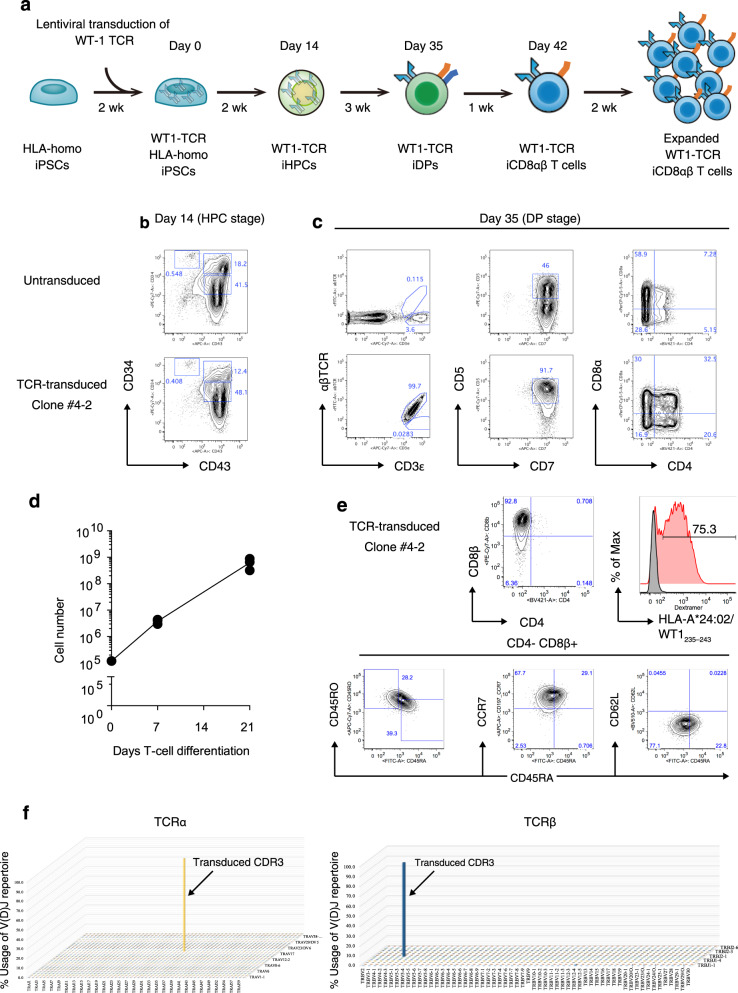
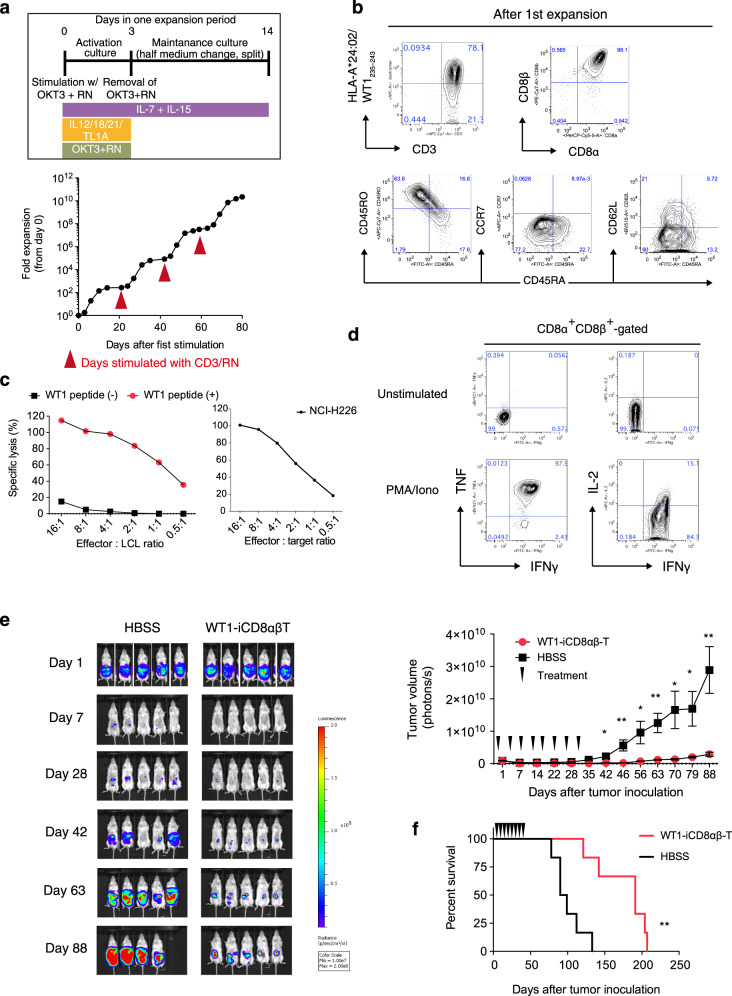
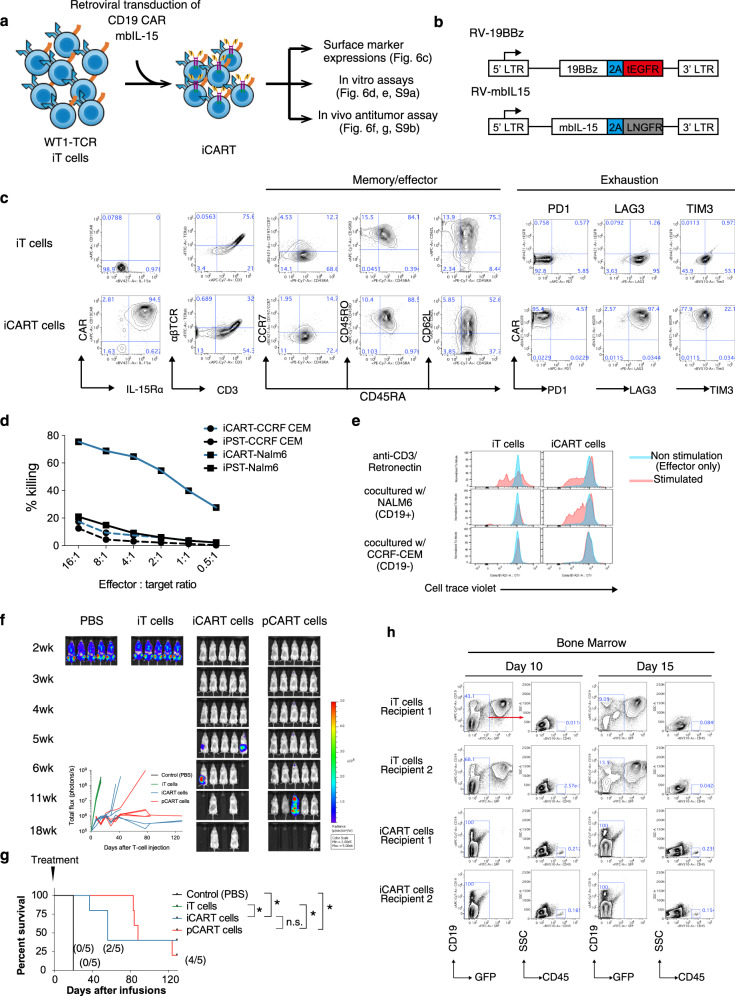
Clinical successes demonstrated by chimeric antigen receptor T-cell immunotherapy have facilitated further development of T-cell immunotherapy against wide variety of diseases. One approach is the development of "off-the-shelf" T-cell sources. Technologies to generate T-cells from pluripotent stem cells (PSCs) may offer platforms to produce "off-the-shelf" and synthetic allogeneic T-cells. However, low differentiation efficiency and poor scalability of current methods may compromise their utilities. Here we show improved differentiation efficiency of T-cells from induced PSCs (iPSCs) derived from an antigen-specific cytotoxic T-cell clone, or from T-cell receptor (TCR)-transduced iPSCs, as starting materials. We additionally describe feeder-free differentiation culture systems that span from iPSC maintenance to T-cell proliferation phases, enabling large-scale regenerated T-cell production. Moreover, simultaneous addition of SDF1α and a p38 inhibitor during T-cell differentiation enhances T-cell commitment. The regenerated T-cells show TCR-dependent functions in vitro and are capable of in vivo anti-tumor activity. This system provides a platform to generate a large number of regenerated T-cells for clinical application and investigate human T-cell differentiation and biology.


Conflict of interest statement

The authors declare the following financial competing interests. S.K. is a founder, shareholder, and chief scientific officer at Thyas Co., Ltd. and received research fundings from Takeda Pharmaceutical Co., Ltd., Kyowa Hakko Kirin Co., Ltd., Sumitomo Chemical Co., Ltd., and Thyas Co., Ltd. S.A., M.K., T. Sato., Y.B., T.S., K.N., M.T., Y. Kassai, and A.H. are employees of Takeda Pharmaceutical Co. Ltd. Y.Y. is an employee of Thyas Co. Ltd. The remaining authors declare no competing financial interests. These authors and all other authors declare no other competing interests.

Figures

Fig. 1
Fig. 1. Generation of CD4+CD8αβ+ DP T-cells from T-iPSCs in feeder-free (Ff) culture conditions.
a Scheme of hematopoietic induction from T-iPSC clones. EBs were generated from a single-cell dissociated human T-iPSCs proliferated in a feeder- and serum-free condition and induced to differentiate into mesoderm and later into hematopoietic cells in the presence of CH, BMP-4, bFGF, and VEGF. The emerging hematopoietic cells were proliferated in the presence of hematopoietic cytokines. SB was added on day 2 to induce definitive hematopoiesis. CH, CHIR99021; SB, SB431542. b Representative kinetic analysis of hematopoietic differentiation from a T-iPSC clone, TkT3V1-7, assessed based on the expression levels of CD34 and CD43 at the indicated days after induction (n = 3). c Schedule of T-cell differentiation of T-iPSC-HPCs in immobilized-DL4 and retronectin culture plates. d Representative flow cytometry plots of T-iPSC-HPCs differentiated on DL4 and RN cultures in the presence of SCF, TPO, FLT3L, and IL-7 for 21 days (n = 4). e Frequencies of CD5+CD7+ progenitor T-cells (blue) and CD4+CD8αβ+ DP-cells (purple) generated from T-iPSC-HPCs 21 days after differentiation on DL4 and RN cultures (n = 4). f DL4 and RN cell yields after 21 days of culture normalized to the input T-iPSC-HPC numbers (n = 3). Data represent mean ± SD of n independent experiments.
Fig. 2
Fig. 2. Optimization of T-cell differentiation in DL4 and RN cultures.
a Representative kinetic flow cytometric analysis of T-cell differentiation on DL4 and RN cultures assessed at the indicated days. b Frequencies of Annexin V(-)/7-AAD (-) live cells in differentiating cultures over 3 weeks in the presence or absence of SDF1α and/or SB203580 (n = 4). c Frequencies of the indicated cell types defined as in (a) in the differentiation culture over 21 days in the presence or absence of SDF1α and/or SB203580 (n = 4). d Kinetics of differentiating T-iPSC-HPC counts over 21 days on DL4 and RN in the presence or absence of SDF1α and/or SB203580 (n = 4). e Gene expression related to T-cell differentiation, Notch signaling pathway, and a myeloid lineage gene (SPI1 (PU.1)) detected by qPCR after T-iPSC-HPCs were cultured for 48 or 96 h on DL4 and RN + / − SS (n = 3). Data represent mean ± SEM of n independent experiments.*P < 0.05; **P < 0.01; ***P < 0.001 by one-way ANOVA with Tukey’s multiple comparison test.
Fig. 3
Fig. 3. Generation of CD8αβ+ T-cells from antigen-specific T-iPSCs in the optimized condition.
a Representative flow cytometry plots of three T-iPSC-derived differentiating cells after 21 days in SS + condition showing expression levels of CD5 vs CD7 and CD8αβ vs CD4. b Frequencies of CD5+CD7+ progenitor T-cells (blue) and CD4+CD8αβ+ DP-cells (purple) generated from the indicated T-iPSC-HPCs after 21 days on DL4/RN + SS condition (n = 3). c Schedule of maturation of DL4-cells to induce CD4CD8αβ+ T-cells. d CD4CD8αβ+ T-cell yield as determined by input T-iPSC count during differentiation processes. e Representative flow cytometry plots obtained 42 days after differentiation (after 7 days in maturation culture as shown in (c) showing the expression levels of tetramer and CD3 (left) and CD8β and CD4 (right) of regenerated T-cells (n = 3). Data represent mean ± SEM of n independent experiments. f–h In vitro cytotoxicity assay of proliferated CD8αβ+ SP T-cells measured by 51Cr release assay using LCL cells loaded with specific peptides (Nef38 for H25-4 (f) and Gag28-8 for H25-31 (g)) or SK-Hep cells transduced with GPC3 or empty vectors (GPC3#16-1 (h)) as target cells. Data are representative of two independent experiments.
Fig. 4
Fig. 4. Generation of CD8αβ+ SP T-cells from TCR-transduced HLA-homo iPSCs.
a Scheme of production starting from HLA-homo iPSC to WT1-TCR-transduced iPSC CD8αβ+ T-cells. Wk, week; HPCs, hematopoietic progenitor cells; DP, CD4+CD8+ double-positive; CTLs, CD4CD8αβ+ cytotoxic T-cells. b, c Flow cytometry plot of differentiating untransduced (top) or WT1-TCR transduced (bottom) HLA-homo iPSCs (b) 14 days after differentiation (HPC stage) gated on the CD14CD235α population and (c) 35 days after differentiation (DP stage) showing the expression levels of αβTCR and CD3 (left), CD5 and CD7 (middle), and CD8α and CD4 (right) (n = 3). d Kinetics of total differentiating cell count during T-cell differentiation in a large-scale culture generated from 1 × 105 WT1-iPSC-HPCs seeded on a DL4/RN-coated 10 cm dish (n = 3 independent experiments). Data represent mean ± SD. e Flow cytometry plots of mature CD4CD8αβ+αβTCR+ T-cells generated from WT1-transduced HLA-homo iPSCs at day 42 after differentiation. f VDJ frequency of WT1-TCR-transduced iPSC CD8 SP T-cells determined by next-generation sequencing of CDR3 regions of TCRα (left) and TCRβ (right) (n = 3 independent experiments).
Fig. 5
Fig. 5. In vitro and in vivo functions of WT1-TCR-transduced HLA-homo iCD8αβ T-cells.
a Fold proliferation of WT1-TCR iCD8αβ T-cells in an optimized protocol as shown (top) for four sequential rounds of stimulations. Data are representative of two independent experiments. b Flow cytometry plots of proliferated WT1-iPSC CD8 SP T-cells representing the expression levels of tetramer and naive/memory T-cell markers (n = 3 independent experiments). c In vitro cytotoxicity assay of proliferated WT1-TCR iCD8αβ T-cells measured by DELFIA assay using LCL cells loaded with specific peptides as target cells (left) and NCI-H226 (right). Data are representative of two independent experiments. d Intracellular cytokine production of WT1-TCR iCD8αβ T-cells after 6 h stimulation with PMA/Ionomycin. Data are representative of two independent experiments. e, f In vivo anti-tumor activity of WT1-TCR iCD8αβ T-cells. NSG mice were intraperitoneally inoculated with NCI-H226-expressing luciferase, treated 4 times weekly with HBSS or WT1-TCR iCD8αβ T-cells, and monitored for (e) tumor volume and (f) survival rate (n = 5 animals each). *P = 0.0016. Data represent mean ± SEM. *P < 0.05; **P < 0.01 (Welch’s two samples t-test (two-tailed) (e); log-rank test (two-tailed) (f)).
Fig. 6
Fig. 6. In vitro and in vivo functions of iCART cells.
a A schematic showing generation and assessment of iCART cells from iT cells. b Designs of RV-19BBz CAR (top) and RV-mbIL-15 (bottom). This design allows the co-expression of the CAR and truncated EGFR and mbIL-15 and LNGFR from the same LTR promoter by using a self-cleaving P2A sequence. LTR, long terminal repeat, Porcine teschovirus self-cleaving 2A sequence. c Representative flow cytometry plots of untransduced and 19BBz-transduced iT cells (iCART cells) showing expression levels of CD19 CAR, IL-15Rα, CD3, αβTCR, CD8α, CD8β (left), naive/memory T-cell markers (middle), and exhaustion markers (right). d Cytotoxic activity of iT cells and iCART cells using CD19+ NALM-6 and CD19- CCRF-CEM as target cells. Data represent two independent experiments. e Representative histograms showing cell divisions of CellTrace Violet-labeled iT cells (left) and iCART cells (right) cocultured with CD19 + NALM-6 or CD19- CCRF-CEM (red) or without target cells (blue) for 6 days. Cell divisions of iT cells and iCART cells activated by retronectin/CD3 conditions are shown (top panels). Data represent two independent experiments. f, g In vivo anti-tumor activity of iT cells and iCART cells in a systemic tumor model. NOG mice were intravenously inoculated with NALM-6-expressing luciferase 4 days before treatment, treated once intravenously with PBS, 1 × 107 iT-cells, iCART-cells, or primary CART-cells, and monitored for (f) tumor volume and (g) survival rate (n = 5 mice each). Values in parentheses represent the fraction of mice without tumor relapse. h NALM-6-bearing mice were treated with 1 × 107 iT cells or iCART cells. At 10 and 15 days after treatment, mice were euthanized and bone marrow cells were collected. Presence of iT cell or iCART cells (GFP-CD19-humanCD45+) and NALM-6 (GFP+CD19+) cells were analyzed by flow cytometry. *P < 0.05 (log-rank Mantel–Cox test with Bonferroni corrections, two-tailed).

References

    1. Themeli M, Rivière I, Sadelain M. New cell sources for T cell engineering and adoptive immunotherapy. Cell Stem Cell. 2015;16:357–366. doi: 10.1016/j.stem.2015.03.011. - DOI - PMC - PubMed
    1. Timmermans F, et al. Generation of T cells from human embryonic stem cell-derived hematopoietic zones. J. Immunol. 2009;182:6879–6888. doi: 10.4049/jimmunol.0803670. - DOI - PubMed
    1. Kennedy M, et al. T lymphocyte potential marks the emergence of definitive hematopoietic progenitors in human pluripotent stem cell differentiation cultures. CellReports. 2012;2:1722–1735. - PubMed
    1. Nishimura T, et al. Generation of rejuvenated antigen-specific T cells by reprogramming to pluripotency and redifferentiation. Cell Stem Cell. 2013;12:114–126. doi: 10.1016/j.stem.2012.11.002. - DOI - PubMed
    1. Wakao H, et al. Expansion of functional human mucosal-associated invariant T cells via reprogramming to pluripotency and redifferentiation. Cell Stem Cell. 2013;12:546–558. doi: 10.1016/j.stem.2013.03.001. - DOI - PubMed

Publication types

MeSH terms