. 2021 Jan 18;12(1):420.
doi: 10.1038/s41467-020-20713-z.

Core transcription regulatory circuitry orchestrates corneal epithelial homeostasis

Affiliations

Core transcription regulatory circuitry orchestrates corneal epithelial homeostasis

Mingsen Li et al. Nat Commun. .

Abstract

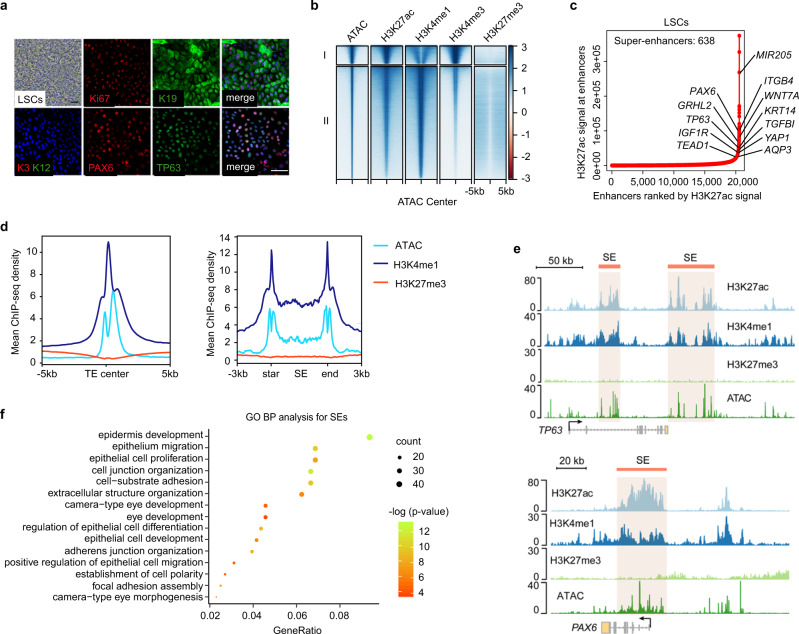
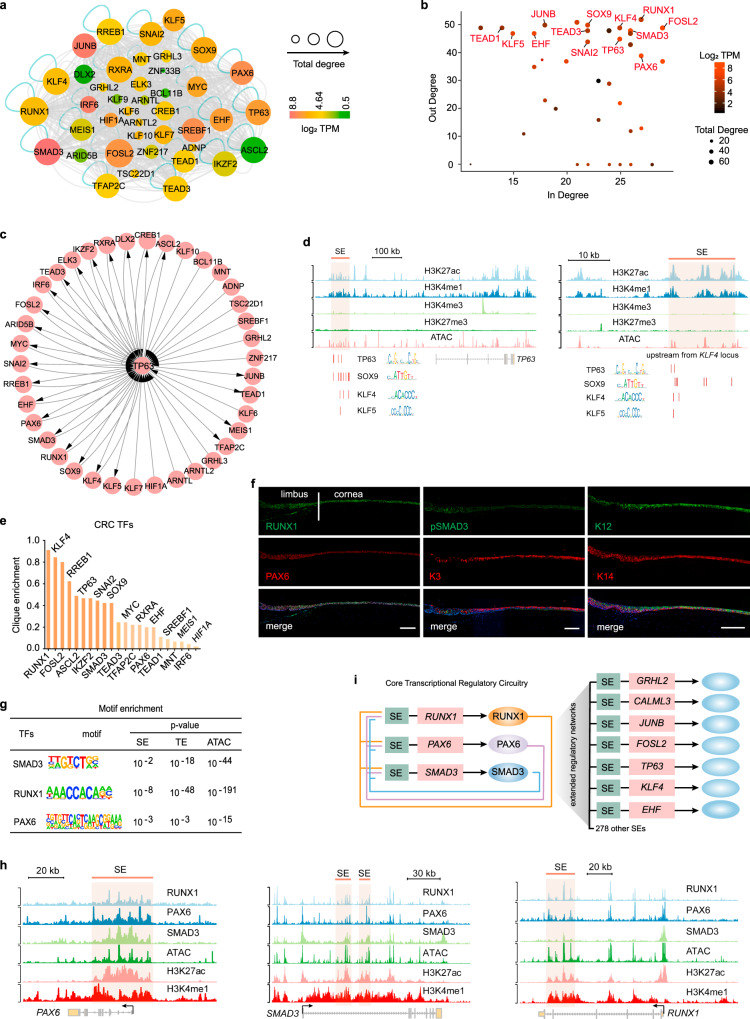
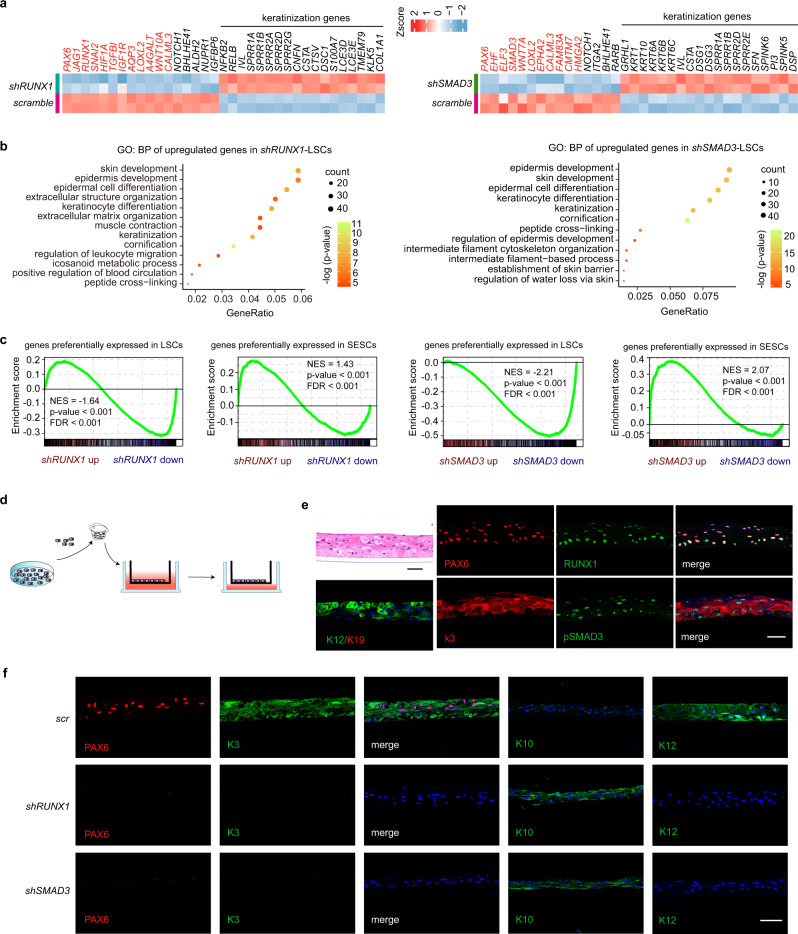
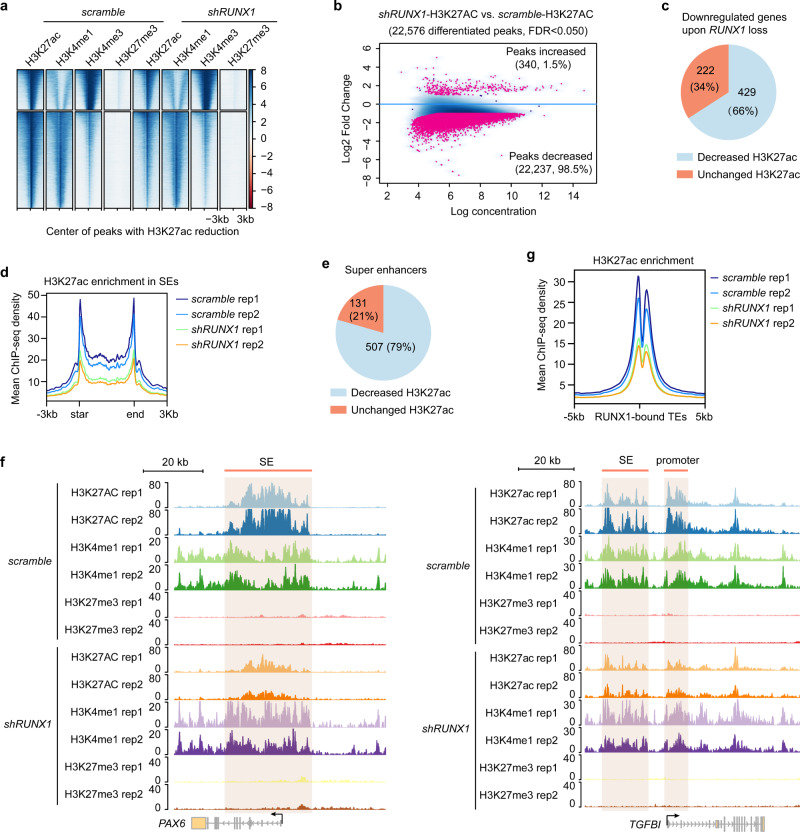
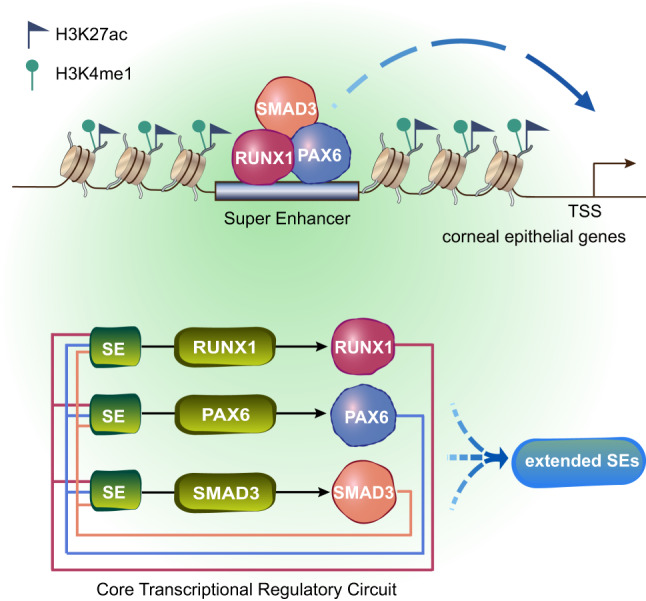
Adult stem cell identity, plasticity, and homeostasis are precisely orchestrated by lineage-restricted epigenetic and transcriptional regulatory networks. Here, by integrating super-enhancer and chromatin accessibility landscapes, we delineate core transcription regulatory circuitries (CRCs) of limbal stem/progenitor cells (LSCs) and find that RUNX1 and SMAD3 are required for maintenance of corneal epithelial identity and homeostasis. RUNX1 or SMAD3 depletion inhibits PAX6 and induces LSCs to differentiate into epidermal-like epithelial cells. RUNX1, PAX6, and SMAD3 (RPS) interact with each other and synergistically establish a CRC to govern the lineage-specific cis-regulatory atlas. Moreover, RUNX1 shapes LSC chromatin architecture via modulating H3K27ac deposition. Disturbance of RPS cooperation results in cell identity switching and dysfunction of the corneal epithelium, which is strongly linked to various human corneal diseases. Our work highlights CRC TF cooperativity for establishment of stem cell identity and lineage commitment, and provides comprehensive regulatory principles for human stratified epithelial homeostasis and pathogenesis.


Conflict of interest statement

The authors declare no competing interests.

Figures

Fig. 1
Fig. 1. Histone modification and chromatin accessibility landscapes of primary LSCs.
a Phase contrast image and immunofluorescence staining of primary LSCs for the indicated marker genes. Scale bar, 100 μm. b Heatmaps grouped into two clusters by k-means algorithm for ATAC-seq and the indicated ChIP-seq signals at the centers of ATAC peaks in LSCs. c Ranked enhancer plots defined by H3K27ac. Enhancers above the inflection point of the curve have exceptionally strong H3K27ac signals and are defined as SEs. The selected genes are SE-associated genes. d Metaplots of average ATAC-seq, H3K4me1, and H3K27me3 density at TEs (left) and SEs (right) in LSCs. e Genome browser tracks for H3K27ac, H3K4me1, H3K27me3, and ATAC-seq signals at the indicated SE loci. f GO biological process (BP) analysis of SE-associated genes with pvalueCutoff = 0.01 and qvalueCutoff = 0.05.
Fig. 2
Fig. 2. CRC model characterizes LSC-specific TF network.
a Interaction network between TFs and SEs in LSCs. Each node is colored according to expression level (log2 TPM), and each node size is scaled according to total degree. Edges indicated in gray represent predicted interactions between TFs and SEs. The turquoise edges represent auto-regulatory loops. TPM: transcripts per kilobase million. b Scatter plot of in-degree (number of TFs binding to the SE of a node gene) and out-degree (number of SEs bound by a node TF) for genes in the SE-mediated regulatory network. c A TP63-centered network showing the SE-based regulatory relationships. d Genome browser tracks for the indicated histone modifications and ATAC signals at the indicated SE loci with logos and positions of the enriched TF motifs shown. e Clique enrichment score of each CRC TF calculated as the percentage of total cliques in which that TF is a constituent member. f Immunofluorescence staining of the indicated genes in normal adult human cornea and limbus. Scale bars, 200 μm. g Enrichment of RPS motifs at SEs, TEs, and ATAC peaks. h Genome browser tracks for the indicated ChIP-seq and ATAC-seq signals across the indicated SE loci in LSCs. i A CRC model established by RPS.
Fig. 3
Fig. 3. Loss of RUNX1 or SMAD3 induces cell identity switch.
a Heatmaps of differentially expressed genes produced by RUNX1 or SMAD3 KD. Red mark represents SE-assigned genes. b GO BP analysis for the upregulated genes in RUNX1-depleted and SMAD3-depleted LSCs (pvalueCutoff = 0.01 and qvalueCutoff = 0.05). c GSEA for genes that (i) are expressed at higher levels in LSCs than in SESCs and (ii) are more highly expressed in SESCs than in LSCs. NES: normalized enrichment score. d Schema representation of the air-lifting culture system. LSCs were seeded in the transwell inserts and incubated in medium until they were confluent. Then, the medium in the upper chamber was removed to induce differentiation into a stratified epithelium sheet. e Hematoxylin and eosin (H&E) and immunofluorescence staining of the indicated genes in the differentiated corneal epithelium sheet after air-lifting induction. Scale bars, 50 μm. f Immunofluorescence staining of the indicated genes in the differentiated corneal epithelium sheets treated with the indicated shRNAs. Scale bar, 50 μm.
Fig. 4
Fig. 4. RPS complex positively regulates SE activity.
a Hierarchical clustering of the indicated ChIP-seq-binding profiles using affinity (read count) scores. Pearson correlation coefficients between each group are shown. b Motif enrichment within RPS peaks in LSCs. c Co-immunoprecipitation analysis of the interactions among endogenous RUNX1, PAX6, and pSMAD3 in LSCs. d Heatmaps grouped into two clusters using k-means algorithm for the indicated ChIP-seq and ATAC-seq signals at RUNX1-bound sites. e Metaplots of average RPS ChIP-seq signals across TEs and SEs in LSCs. f GSEA of SE-associated gene set in scrambled shRNA-treated versus shRUNX1-treated LSCs and scrambled shRNA-treated versus shSMAD3-treated LSCs. g Venn diagram showing the overlapping and unique peaks bound by RPS. h Genome browser tracks for the indicated ChIP-seq and ATAC signals across the TGFBI, AQP3, and IGF1R loci. i GO BP and KEGG analysis for the genes closest to the overlapping RPS peaks with pvalueCutoff = 0.01 and qvalueCutoff = 0.05.
Fig. 5
Fig. 5. RUNX1 depletion impairs H3K27ac deposition across lineage-specific enhancers.
a Heatmaps showing the indicated ChIP-seq signals across the peaks with H3K27ac reduction in shRUNX1-treated versus scrambled shRNA-treated LSCs. b Scatterplot of H3K27ac enrichment in shRUNX1-treated versus scrambled shRNA-treated LSCs. Sites identified as significantly differentially bound (fold change ≥ 2, FDR < 0.05) are shown in red. c Pie chart showing the percentages of reduced and unchanged H3K27ac signals close to the loci of down-regulated genes upon RUNX1 loss. d Metaplots of average H3K27ac density across the SEs of wild-type LSCs in shRUNX1-treated and scrambled shRNA-treated LSCs. e Pie chart showing the percentages of reduced and unchanged H3K27ac signals across the SEs of wild-type LSCs upon RUNX1 loss. f Genome browser tracks for the indicated ChIP-seq signals across the PAX6 and TGFBI loci in scrambled shRNA-treated and shRUNX1-treated LSCs. g Metaplots of average H3K27ac density across the RUNX1-binding TEs in scrambled shRNA-treated and shRUNX1-treated LSCs.
Fig. 6
Fig. 6. Pathological changes of corneal epithelium.
H&E staining and immunofluorescence analysis of the indicated genes in corneal inflammatory (47 years old, female), ulcer (62 years old, female), alkali burn (33 years old, male), and leukoma (51 years old, female) tissues. Scale bars, 200 μm.
Fig. 7
Fig. 7. The CRC model of lineage-determining TFs underling corneal epithelial identity.
RUNX1/PAX6/SMAD3 complex governs their own SEs and a broader SE network, establishing the active chromatin environment to maintain expression of the corneal epithelial identity genes.

Similar articles

Cited by

References

    1. Blanpain C, Horsley V, Fuchs E. Epithelial stem cells: turning over new leaves. Cell. 2007;128:445–458. doi: 10.1016/j.cell.2007.01.014. - DOI - PMC - PubMed
    1. Heinz S, et al. Simple combinations of lineage-determining transcription factors prime-regulatory elements required for macrophage and B cell Identities. Mol. Cell. 2010;38:576–589. doi: 10.1016/j.molcel.2010.05.004. - DOI - PMC - PubMed
    1. Adam RC, et al. Pioneer factors govern super-enhancer dynamics in stem cell plasticity and lineage choice. Nature. 2015;521:366–370. doi: 10.1038/nature14289. - DOI - PMC - PubMed
    1. Adam RC, et al. Temporal layering of signaling effectors drives chromatin remodeling during hair follicle stem cell lineage progression. Cell Stem Cell. 2018;22:398–413. doi: 10.1016/j.stem.2017.12.004. - DOI - PMC - PubMed
    1. Saint-André V, et al. Models of human core transcriptional regulatory circuitries. Genome Res. 2016;26:385–396. doi: 10.1101/gr.197590.115. - DOI - PMC - PubMed

Publication types

MeSH terms