. 2021 Mar;101(3):328-340.
doi: 10.1038/s41374-020-00523-z. Epub 2021 Jan 18.

Adipose tissue inflammation and systemic insulin resistance in mice with diet-induced obesity is possibly associated with disruption of PFKFB3 in hematopoietic cells

Affiliations

Adipose tissue inflammation and systemic insulin resistance in mice with diet-induced obesity is possibly associated with disruption of PFKFB3 in hematopoietic cells

Bilian Zhu et al. Lab Invest. 2021 Mar.

Abstract

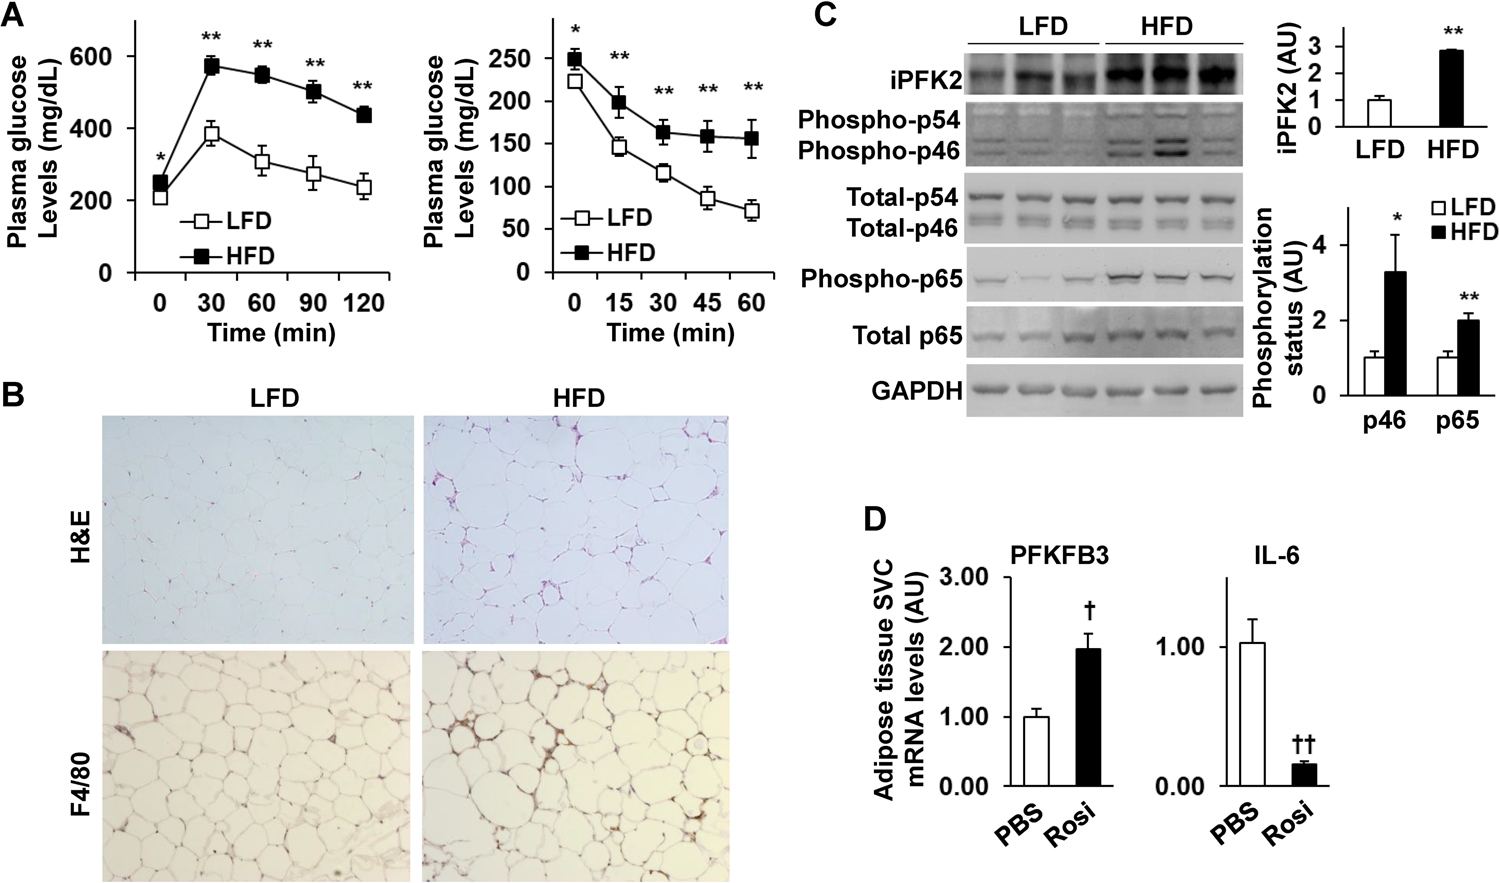
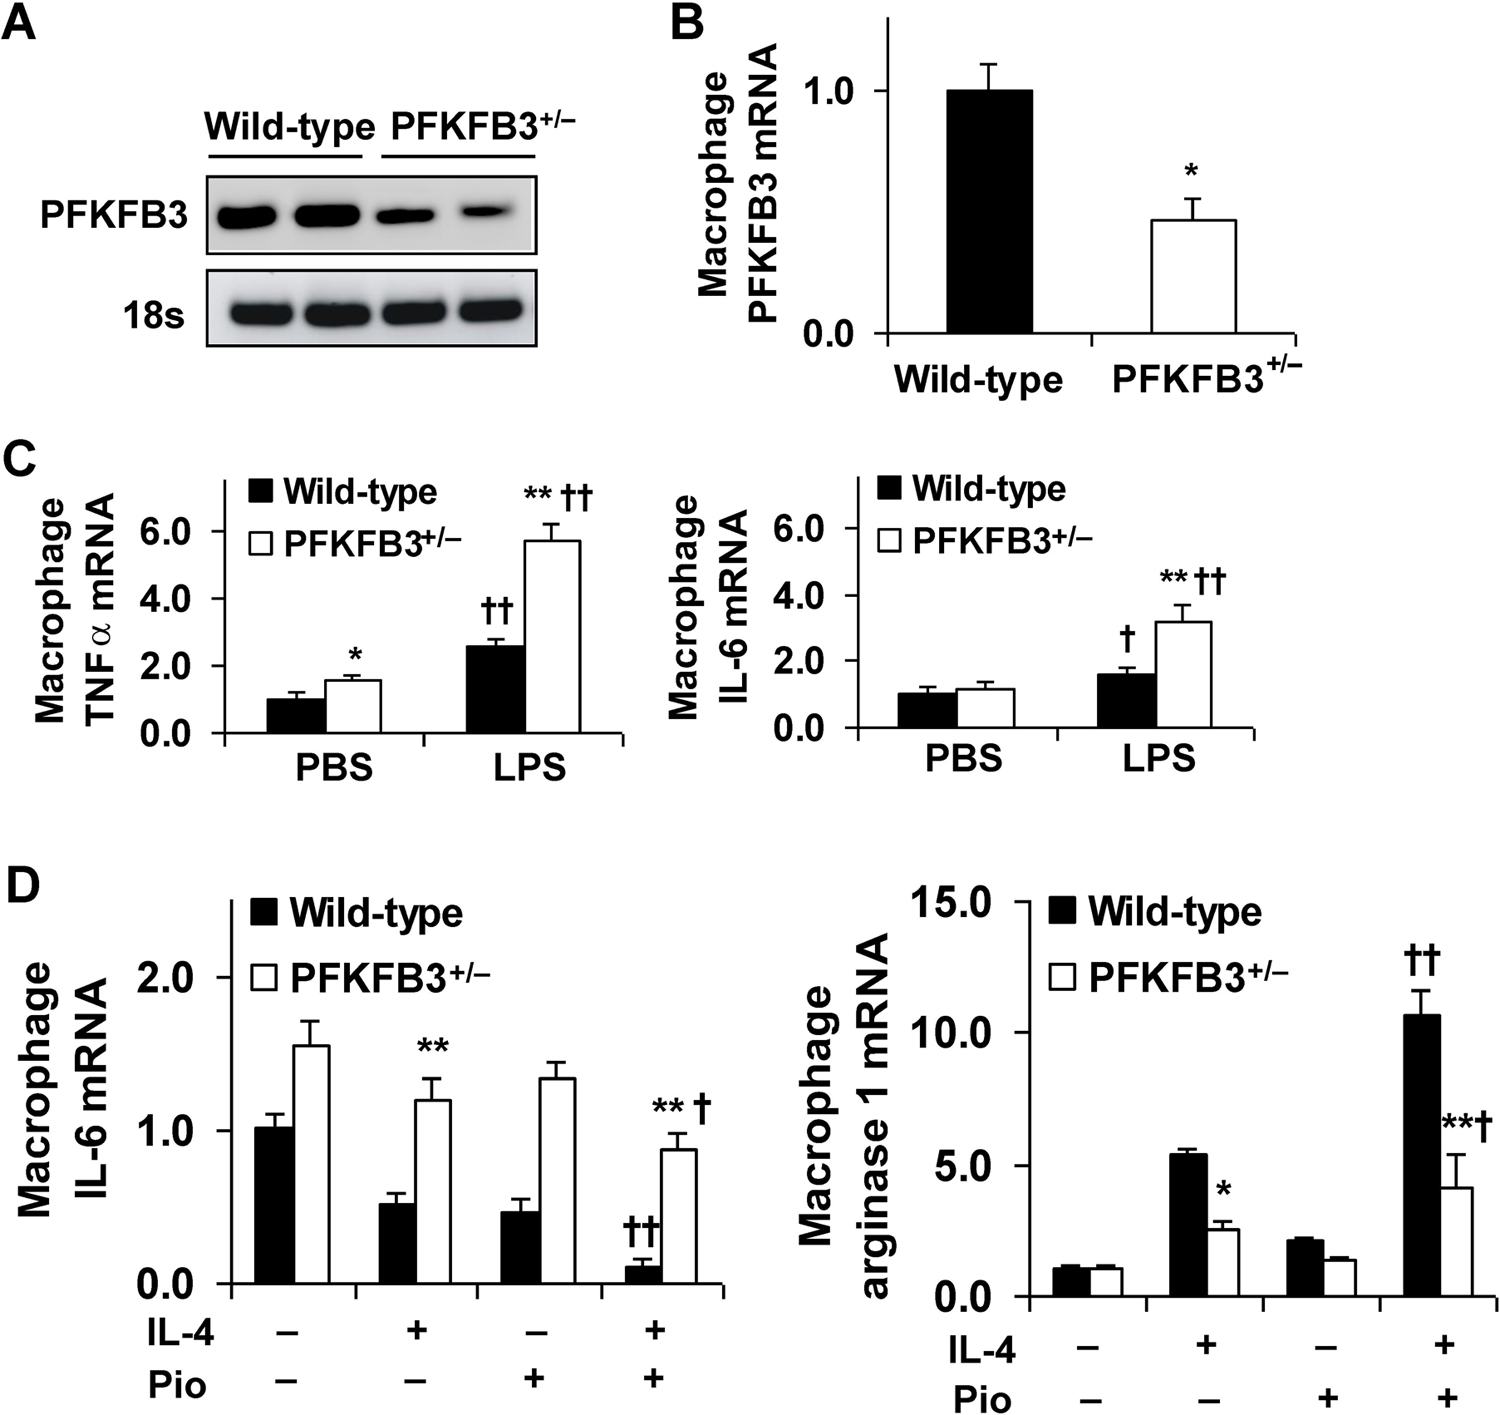
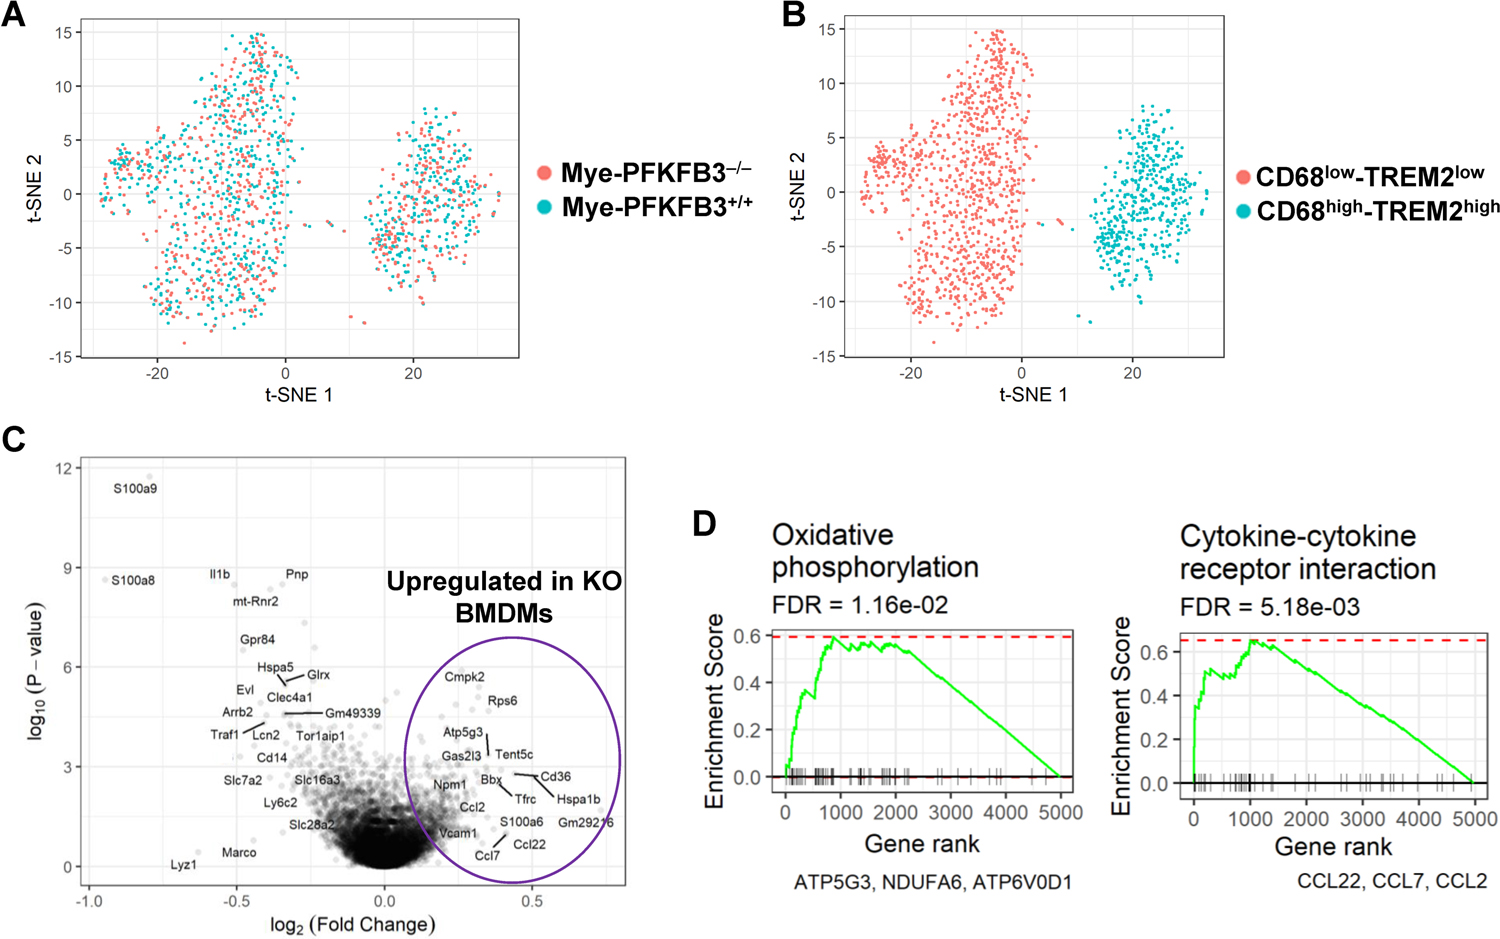
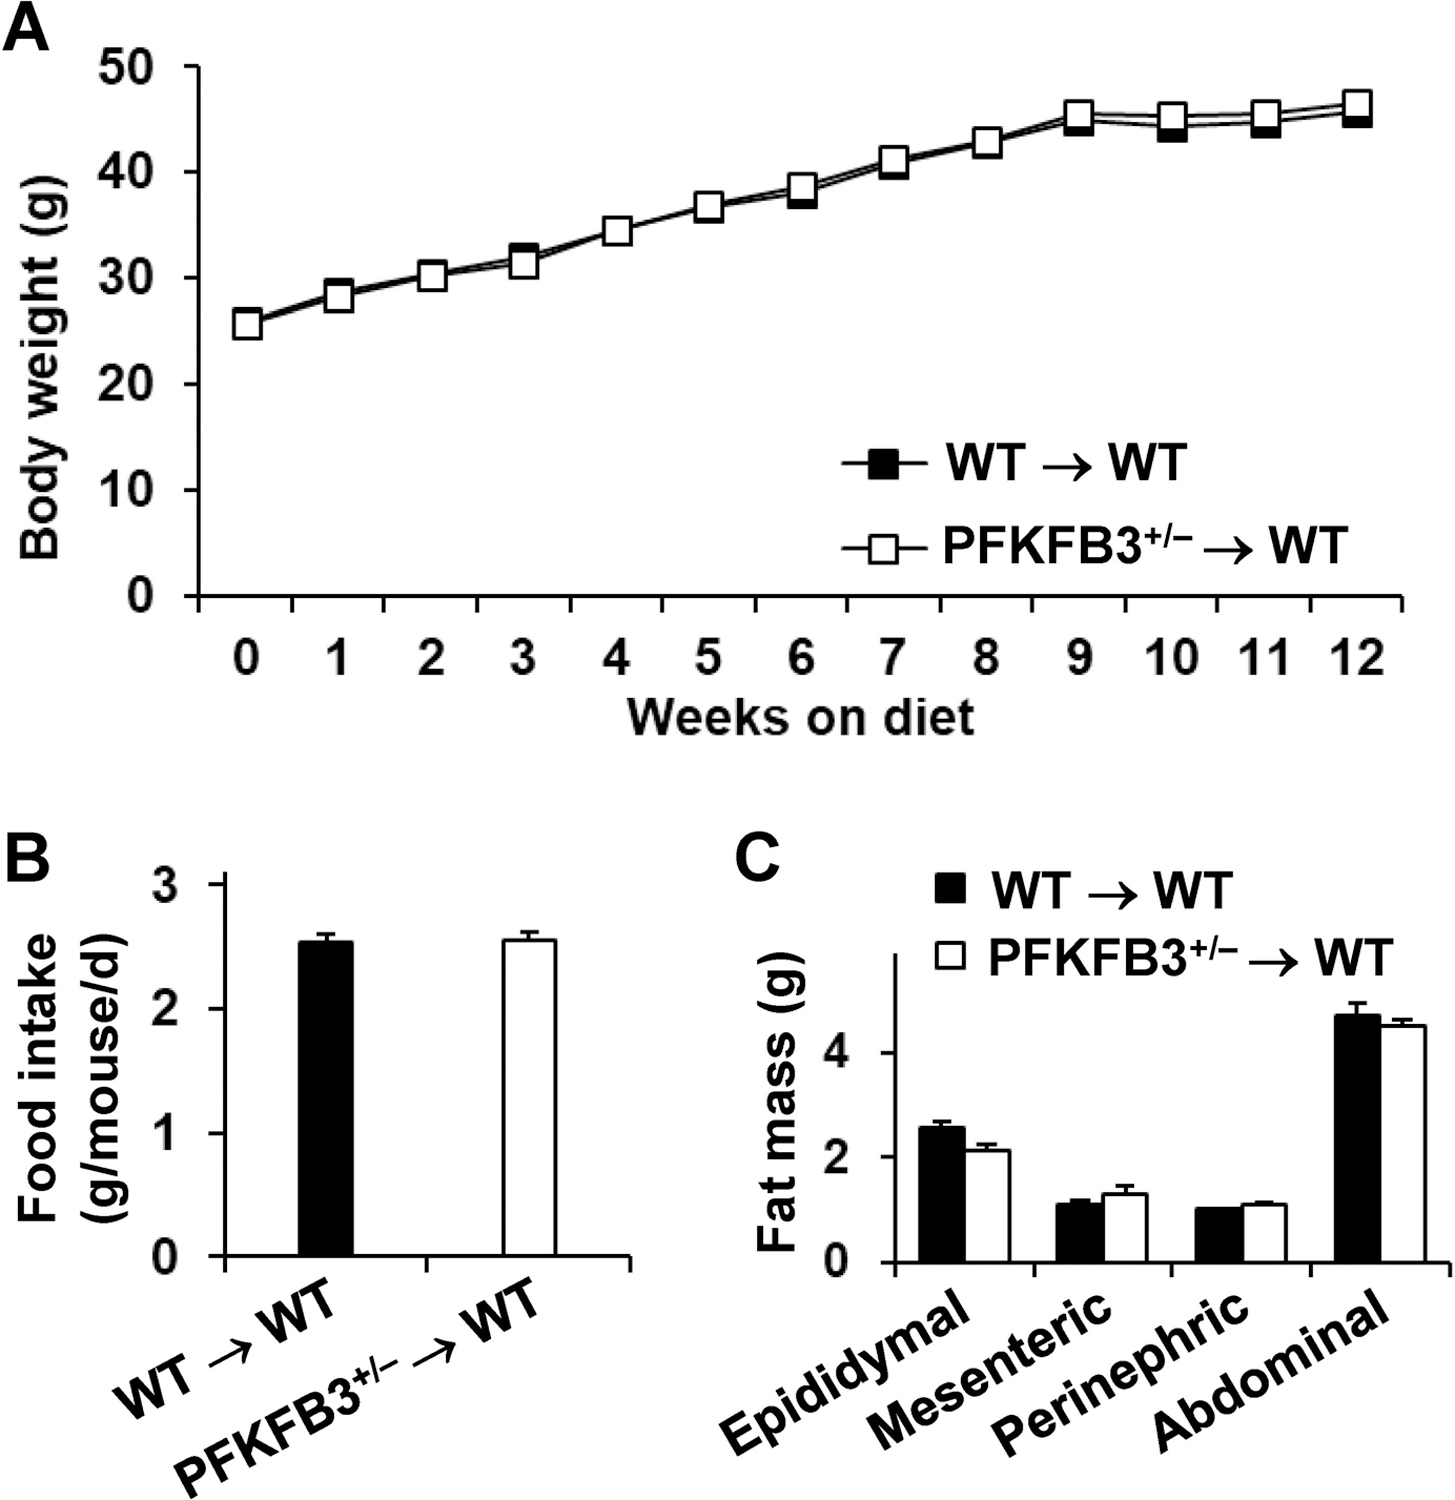
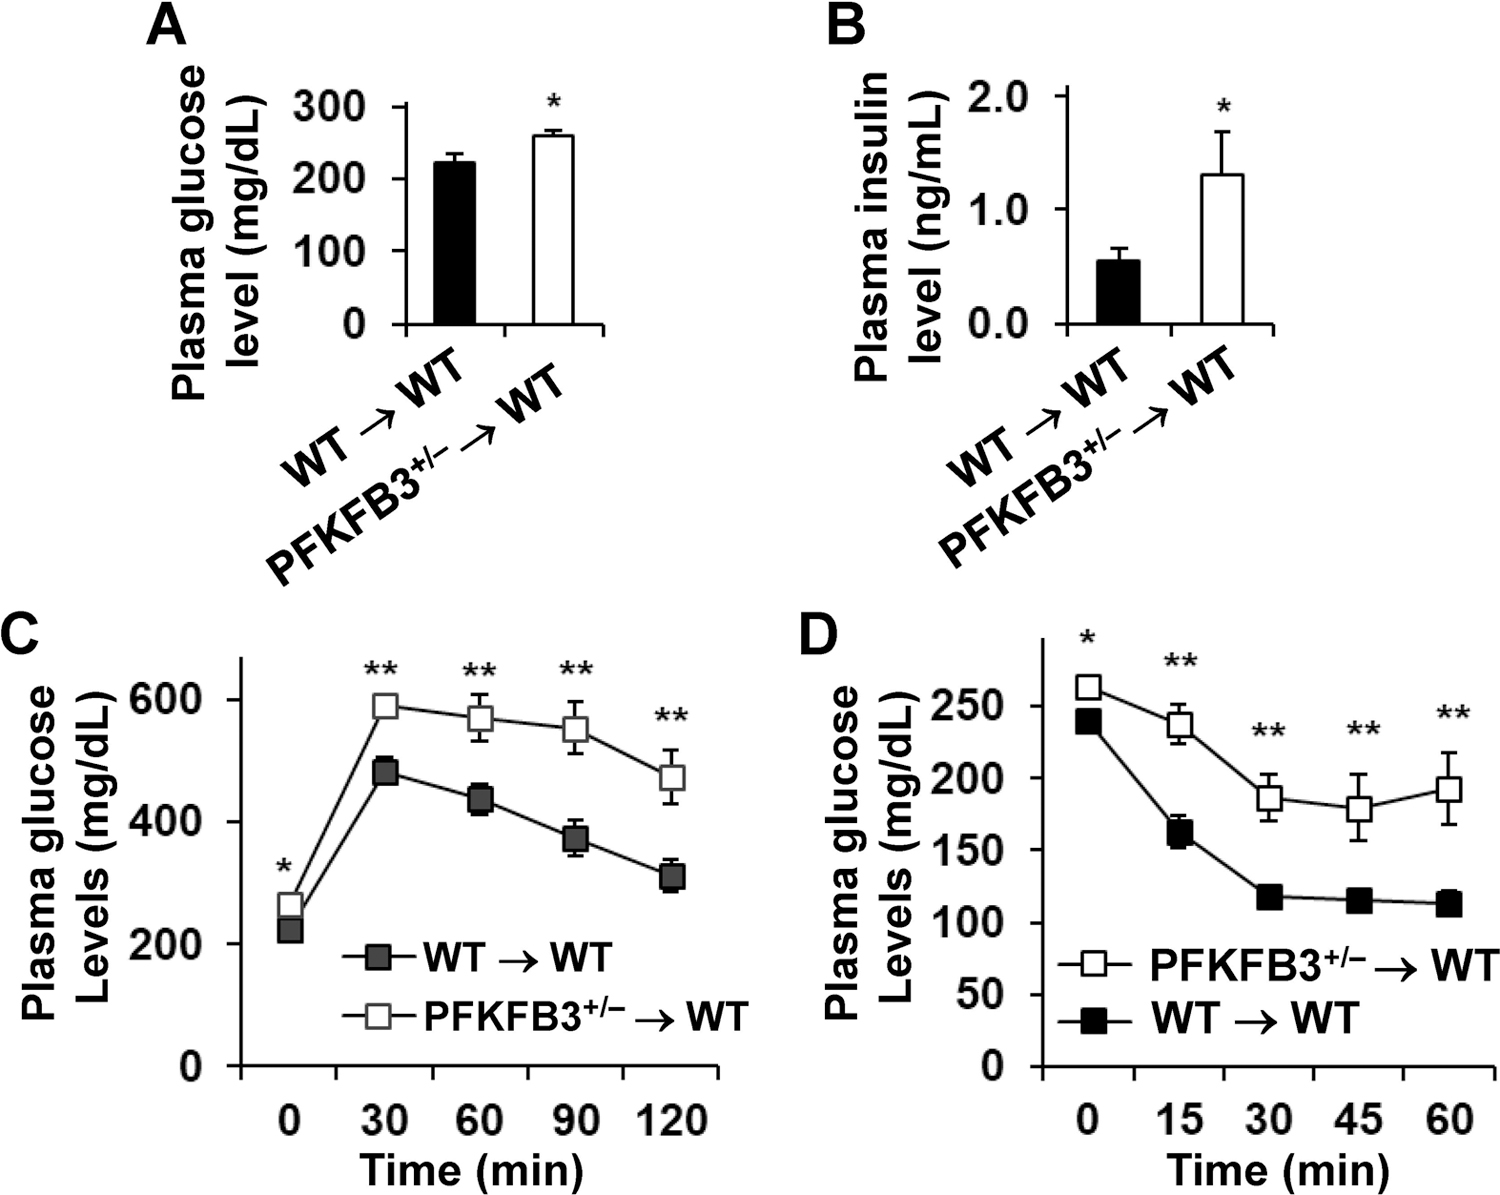
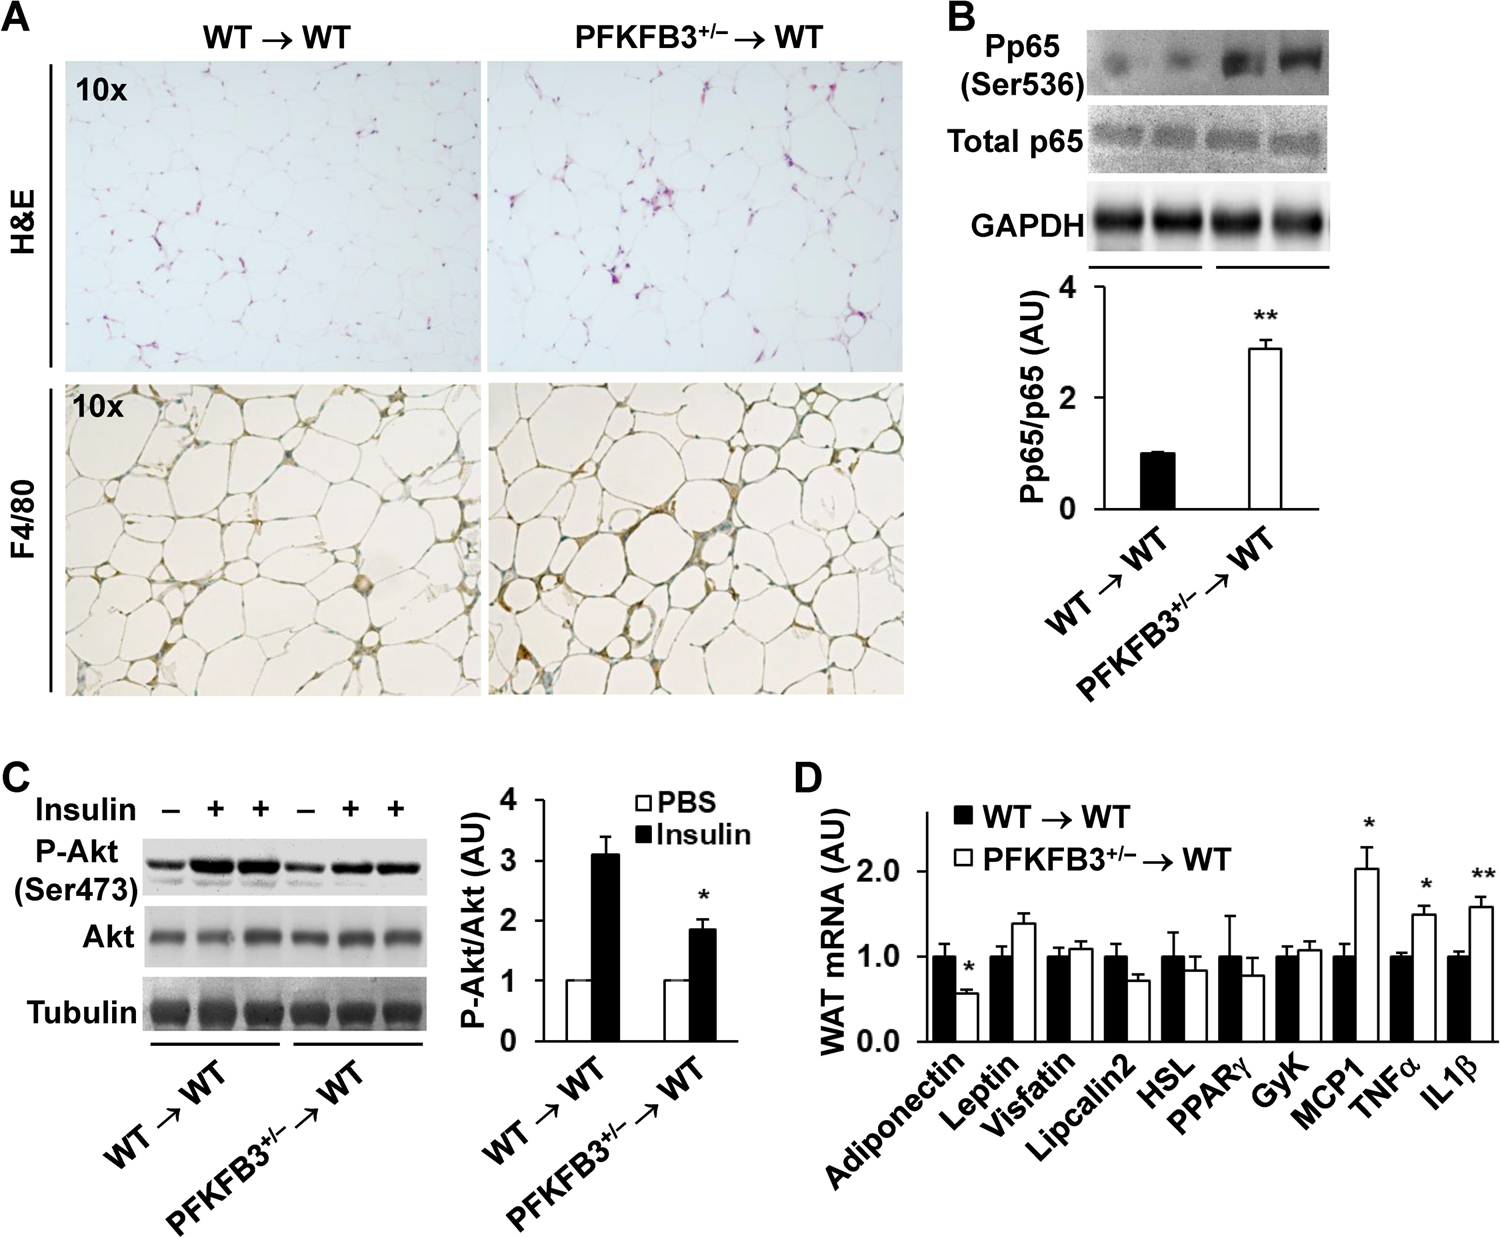
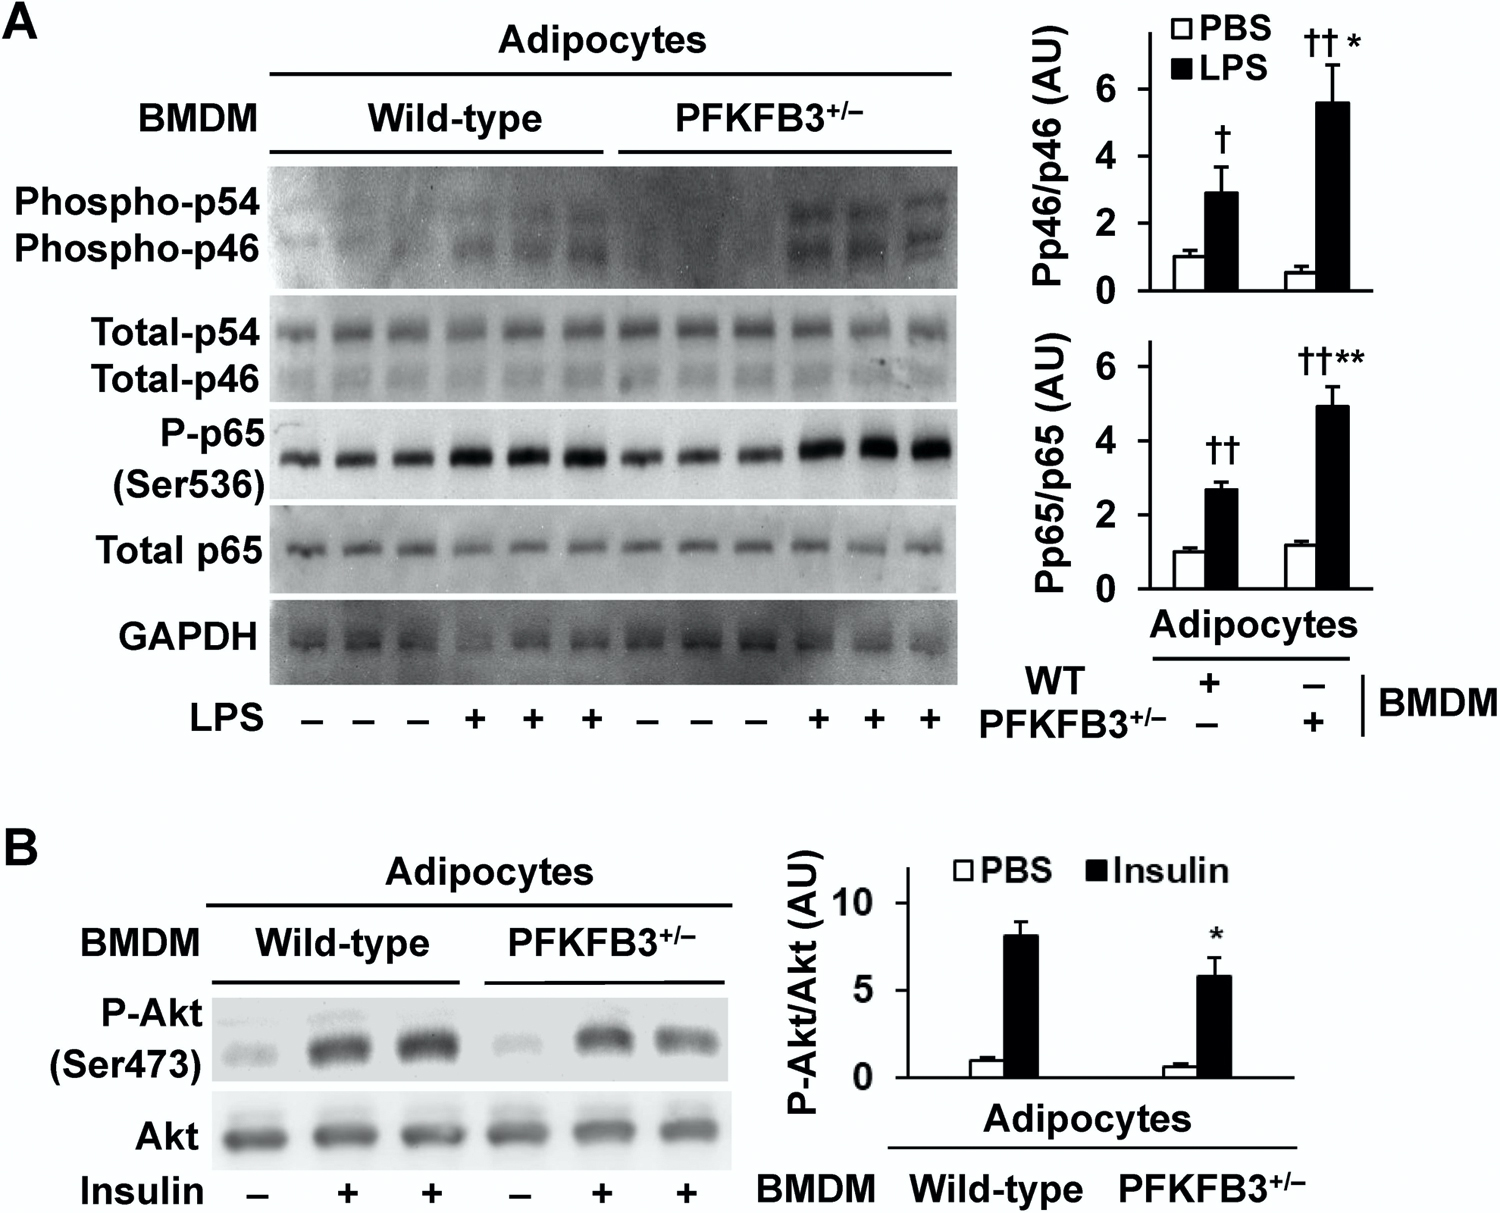
Obesity-associated inflammation in white adipose tissue (WAT) is a causal factor of systemic insulin resistance; however, precisely how immune cells regulate WAT inflammation in relation to systemic insulin resistance remains to be elucidated. The present study examined a role for 6-phosphofructo-2-kinase/fructose-2,6-bisphosphatase 3 (PFKFB3) in hematopoietic cells in regulating WAT inflammation and systemic insulin sensitivity. Male C57BL/6J mice were fed a high-fat diet (HFD) or low-fat diet (LFD) for 12 weeks and examined for WAT inducible 6-phosphofructo-2-kinase (iPFK2) content, while additional HFD-fed mice were treated with rosiglitazone and examined for PFKFB3 mRNAs in WAT stromal vascular cells (SVC). Also, chimeric mice in which PFKFB3 was disrupted only in hematopoietic cells and control chimeric mice were also fed an HFD and examined for HFD-induced WAT inflammation and systemic insulin resistance. In vitro, adipocytes were co-cultured with bone marrow-derived macrophages and examined for adipocyte proinflammatory responses and insulin signaling. Compared with their respective levels in controls, WAT iPFK2 amount in HFD-fed mice and WAT SVC PFKFB3 mRNAs in rosiglitazone-treated mice were significantly increased. When the inflammatory responses were analyzed, peritoneal macrophages from PFKFB3-disrputed mice revealed increased proinflammatory activation and decreased anti-inflammatory activation compared with control macrophages. At the whole animal level, hematopoietic cell-specific PFKFB3 disruption enhanced the effects of HFD feeding on promoting WAT inflammation, impairing WAT insulin signaling, and increasing systemic insulin resistance. In vitro, adipocytes co-cultured with PFKFB3-disrupted macrophages revealed increased proinflammatory responses and decreased insulin signaling compared with adipocytes co-cultured with control macrophages. These results suggest that PFKFB3 disruption in hematopoietic cells only exacerbates HFD-induced WAT inflammation and systemic insulin resistance.


Conflict of interest statement

The authors declare that they do not have conflict of interest.

Conflict of Interest

The authors do not have conflict of interest.

Figures

Figure 1.
Figure 1.. PFKFB3 expression is relevant to adipose tissue inflammation in mice with diet-induced obesity
Male C57BL/6J mice, at 5 – 6 weeks of age, were fed a high-fat diet (HFD, 60% of fat calories) or low-fat diet (LFD, 10% fat calories) for 12 weeks. Some HFD-fed mice were also treated with rosiglitazone (Rosi, 10 mg/kg/d) or control (phosphate-buffered saline (PBS)) for the last 4 weeks of HFD feeding period. (A) Glucose tolerance and insulin tolerance tests. After the feeding period, HFD- or LFD-fed mice were fasted for 4 hr and subjected to a bolus peritoneal injection of glucose (2 g/kg) or (1 U/kg). (B) Adipose tissue iPFK2 amount and proinflammatory signaling. After harvest, lysates of white adipose tissue (WAT) were measured for iPFK2 amount, as well as p46 and p65 amount and phosphorylation states using Western blot analysis. (C) WAT histology. WAT sections were stained with H&E or for F4/80 expression. (D) The expression of PFKFB3 and IL6 in WAT stromal vascular cells (SVC). After the feeding/treatment period, WAT of HFD-fed and rosiglitazone- or control-treated mice were digested for collection of SVC. The latter were subjected to measurement of PFKFB3 and IL-6 expression using real-time RT-PCR. For A, B, and D, numeric data are means ± SEM. n = 7 – 10. *, P < 0.05 and **, P < 0.01 HFD vs. LFD in A for the same point and in B for the same protein; , P < 0.05 and ††, P < 0.01 LPS vs PBS for the same cocultures (in A). , P < 0.05 and ††, P < 0.01 Rosi vs. PBS for the same gene in D.
Figure 2.
Figure 2.. Disruption of PFKFB3 enhances macrophage proinflammatory activation and impairs macrophage anti-inflammatory activation
(A,B) Validation of macrophage PFKFB3 disruption. (C,D) Macrophage activation. For A - D, peritoneal macrophages were isolated from LFD-fed male PFKFB3+/− mice and wild-type (WT) littermates and measured for the expression of PFKFB3 (A and B) and proinflammatory cytokines (TNFα and IL-6) and/or arginase 1 (C and D) using real-time RT-PCR. For A, representative PCR production of PFKFB3. For B, quantification of PFKFB3 mRNAs. For C, macrophage proinflammatory activation. Prior to harvest, macrophages were treated with or without lipopolysaccharide (LPS, 20 ng/mL) for the last 6 hr. For D, macrophage anti-inflammatory activation. Prior to harvest, macrophages were treated with or without interleukin 4 (IL-4, 10 ng/mL) in the presence or absence of pioglitazone (1 µM) for 48 hr. For B - D, data are means ± SEM. n = 4 – 6. *, P < 0.05 and **, P < 0.01 PFKFB3+/− vs. WT in B, under the same condition in C, and with these same treatment (IL-4 or IL-4 + Pio) in D; , P < 0.05 and ††, P < 0.01 LPS vs PBS within the same genotype in C or treatment with IL-4 + Pio vs. Pio alone.
Figure 3.
Figure 3.. PFKFB3 regulation of macrophage activation at the level of transcriptome
Bone marrow cells from myeloid cell-specific PFKFB3 disrupted (Mye-PFKFB3−/−) mice and control (Mye-PFKFB3+/+) mice were differentiated into macrophages (BMDMs). Prior to harvest, BMDMs were treated with LPS (20 ng/mL) for 6 hr and subjected to scRNAseq analysis. (A) t-SNE representation of cells showing the sample origin: Mye-PFKFB3−/− and Mye-PFKFB3+/+ (WT). (B) t-SNE representation showing clusters of cells: CD68high-Trem2high and CD68low-Trem2low. (C) Volcano plot of differentially expressed (DE) genes (fold-changes (FC=log2 transformed Mye-PFKFB3−/− to Mye-PFKFB3+/+ expression ratios) vs. log10-transformed p-values) in macrophages. Macrophages with high expression of markers such as CD68 and Trem2 were included in the differential expression analysis. Genes in oval are example genes with expression is upregulated in macrophages from Mye-PFKFB3−/− mice. (D) Results of GSEA analysis using the ranked list of DE genes, suggesting that the expression of genes related to metabolic and proinflammatory responses is up regulated by PFKFB3 disruption.
Figure 4.
Figure 4.. Disruption of PFKFB3 in hematopoietic cells does not alter diet-induced adiposity in mice
Bone marrow cells from PFKFB3+/− mice and/or wild-type (WT) littermates were transplanted into lethally irradiated wild-type mice. After recovery for 4 weeks, chimeric mice were fed an HFD for 12 weeks. PFKFB3+/− → WT mice, WT mice were transplanted with bone marrow cells from PFKFB3+/− mice; WT → WT mice, WT mice were transplanted with WT bone marrow cells. (A) Body weight of chimeric mice. (B) Food intake of the chimeric mice. For A and B, body weight was recorded weekly during the feeding period. Also, food amount was monitored weekly and used to calculate food intake. (C) Visceral fat mass. After the feeding period, mice were fasted for 4 hr and subjected to collection of fat pads. Abdominal fat mass was calculated as the sum of epididymal fat, mesenteric fat, and perinephric fat. For A - B, data are means ± SEM. n = 7 – 10.
Figure 5.
Figure 5.. Disruption of PFKFB3 in hematopoietic cells exacerbates diet-induced insulin resistance and glucose intolerance
Chimeric (PFKFB3+/− → WT mice and WT → WT) mice, described in Figure 3, were fed an HFD for 12 weeks. (A,B) Plasma levels of glucose (A) and insulin (B). Prior to collection of blood samples, HFD-fed mice were fasted for 4 hr. (C,D) Glucose (C) and insulin (D) tolerance tests. After the feeding period, chimeric mice were fasted for 4 hr and given a bolus intraperitoneal injection of glucose (2 g/kg) (C) or insulin (1 U/kg) (D) and subjected to the tests. For A - D, data are means ± SEM. n = 10. *, P < 0.05 and **, P < 0.01 PFKFB3+/− → WT vs. WT → WT in A and B and for the same time point in C and D.
Figure 6.
Figure 6.. Disruption of PFKFB3 in hematopoietic cells exacerbates diet-induced WAT inflammation and decreases WAT insulin signaling
Chimeric (PFKFB3+/− → WT mice and WT → WT) mice, described in Figure 3, were fed an HFD for 12 weeks. (A,B) WAT inflammation. After harvest, WAT sections were stained with H&E or for F4/80 expression (A). Also, WAT lysates were examined for the phosphorylation states of NFκB p65 (B). (C) WAT insulin signaling. Prior to harvest, HFD-fed chimeric mice were given a bolus injection of insulin into the portal vein for 5 min. WAT lysates were examined for the total amount and phosphorylation states of Akt. (D) WAT mRNA levels. For B and C, blots were quantified using densitometry. For D, WAT mRNA levels were quantified using real-time RT-PCR. For bar graphs in B - D, data are means ± SEM. n = 4 (B and C) or 6 (D). *, P < 0.05 and **, P < 0.01 PFKFB3+/− → WT vs. WT → WT in B and in C under the same condition (insulin) and in D for the same gene.
Figure 7.
Figure 7.. PFKFB3-disrupted macrophages enhance adipocyte proinflammatory responses and decrease adipocyte insulin signaling
Adipocytes, differentiated from 3T3-L1 cells, were co-cultured with BMDMs from PFKFB3+/− mice or WT mice. (A) Proinflammatory signaling. Prior to harvest, the co-cultures were treated with or without LPS (100 ng/mL) or PBS for the last 30 min. (B) Insulin signaling. Prior to harvest, the co-cultures were treated with insulin (100 nM) or PBS for the last 30 min. For A and B, cell lysates were subjected to Western blot analysis. Bar graphs, quantification of blots. Data are means ± SEM. n = 4 – 6. *, P < 0.05 and **, P < 0.01 cocultures with PFKFB3+/− BMDMs vs. cocultures with WT BMDMs under LPS-stimulated condition in A or insulin-stimulated condition in B; , P < 0.05 and ††, P < 0.01 LPS vs PBS for the same cocultures in A.

Similar articles

Cited by

References

    1. Huo Y, Guo X, Li H, et al. Disruption of inducible 6-phosphofructo-2-kinase ameliorates diet-induced adiposity but exacerbates systemic insulin resistance and adipose tissue inflammatory response. J Biol Chem 2010;285:3713–3721. - PMC - PubMed
    1. Xu H, Li H, Woo S-L, et al. Myeloid cell-specific disruption of Period1 and Period2 exacerbates diet-induced inflammation and insulin resistance. J Biol Chem 2014;289(23):16374–16388. - PMC - PubMed
    1. Pei Y, Li H, Cai Y, et al. Regulation of adipose tissue inflammation by adenosine 2A receptor in obese mice. J Endocrinol 2018;239(3):365–376. - PMC - PubMed
    1. Cai Y, Li H, Liu M, et al. Disruption of adenosine 2A receptor exacerbates NAFLD through increasing inflammatory responses and SREBP1c activity. Hepatology 2018;68(1):48–61. - PMC - PubMed
    1. Luo X, Li H, Ma L, et al. Expression of STING is increased in liver tissues from patients with NAFLD and promotes macrophage-mediated hepatic inflammation and fibrosis in mice. Gastroenterology 2018;155(6):1971–1984. - PMC - PubMed

Publication types

Substances