. 2021 Jan 18;11(1):1661.
doi: 10.1038/s41598-021-81308-2.

Effects of social distancing on the spreading of COVID-19 inferred from mobile phone data

Affiliations

Effects of social distancing on the spreading of COVID-19 inferred from mobile phone data

Hamid Khataee et al. Sci Rep. .

Abstract

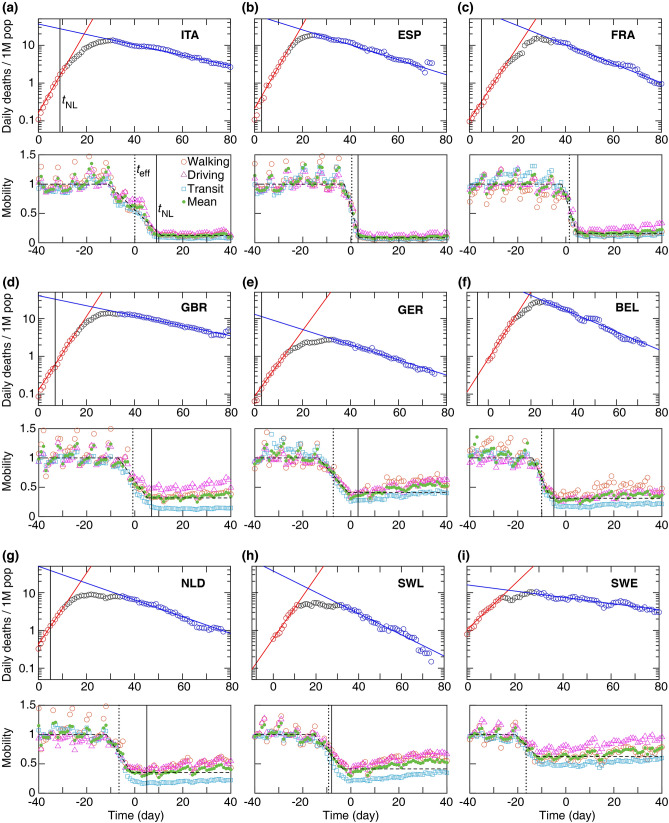
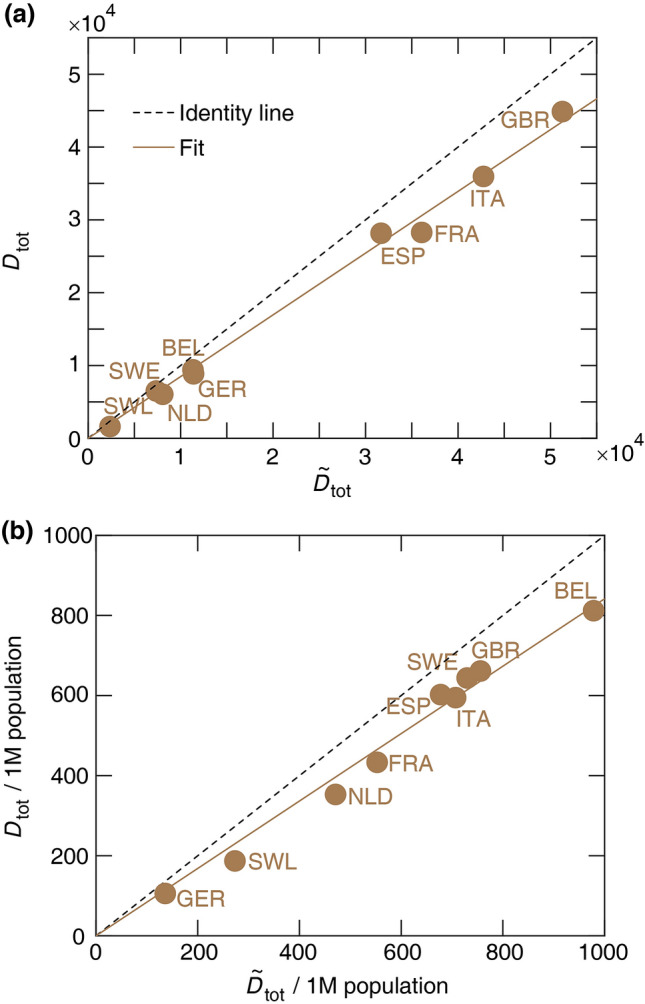
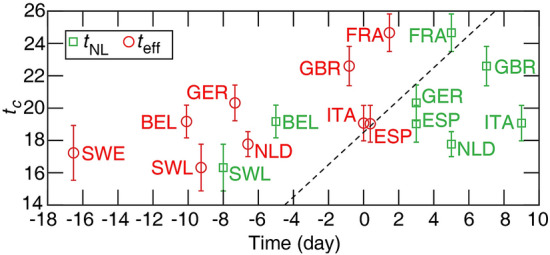
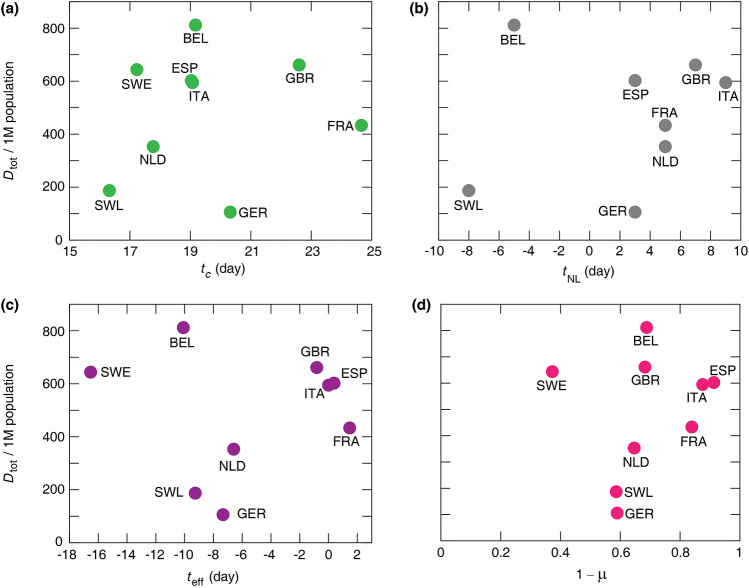
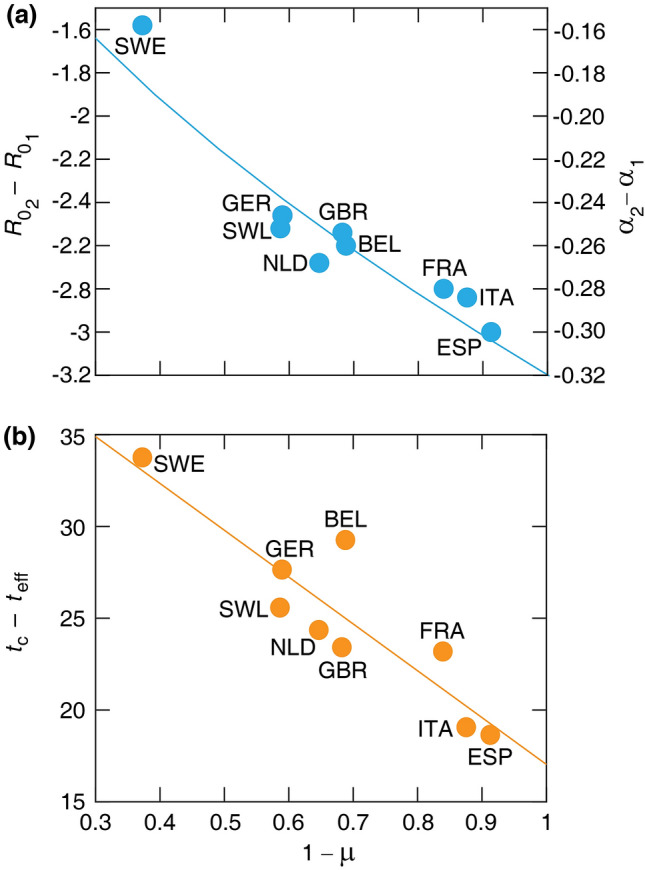
A better understanding of how the COVID-19 pandemic responds to social distancing efforts is required for the control of future outbreaks and to calibrate partial lock-downs. We present quantitative relationships between key parameters characterizing the COVID-19 epidemiology and social distancing efforts of nine selected European countries. Epidemiological parameters were extracted from the number of daily deaths data, while mitigation efforts are estimated from mobile phone tracking data. The decrease of the basic reproductive number ([Formula: see text]) as well as the duration of the initial exponential expansion phase of the epidemic strongly correlates with the magnitude of mobility reduction. Utilizing these relationships we decipher the relative impact of the timing and the extent of social distancing on the total death burden of the pandemic.


Conflict of interest statement

The authors declare no competing interests.

Figures

Figure 1
Figure 1
Daily death and mobility data for 9 European countries (ai). Time 0 corresponds to the day when a country first reported 5 daily deaths. Top: Growth and decay phases (red and blue lines) were fitted using Eq. (1) to the data points visually highlighted by red and blue, respectively. Vertical line: national lock-down date tNL. Bottom: Mobile phone tracking data, normalized by the average values before the epidemic (M1). Quantitative parameters were extracted by a fit (dashed line) to the mean mobility data (green circles, average of walking, driving, and transit data) calculated using Eq. (3). Dotted vertical line indicates the effective lock-down date teff calculated using Eq. (4). Fit parameters are summarised in Supplementary Tables 1 and 2.
Figure 2
Figure 2
Analytical estimate of the total number of COVID-19 deaths D~tot versus Dtot, the actual total death toll (a). (b) The same data are presented as per million (1M) population. The dashed and solid lines represent the identity and a linear regression, respectively. The slope of the linear regression is 0.85±0.01 (a) and 0.84±0.02 (b). Pearson coefficients of determination are (a) r2=0.99 (p<0.001) and (b) r2=0.98 (p<0.001). Statistical data analysis was performed using MATLAB (version 2017b, The MathWorks, Inc.).
Figure 3
Figure 3
The time of the peak in daily deaths tc versus the official national lock-down date tNL and the effective social distancing date teff. The correlation is weak with r2=0.45 (p=0.06) for teff, and r2=0.12 (p=0.37) for tNL. Neither correlations are statistically significant. Dashed line: time (identity line) with a delay of 18.5 days. Error bars indicate standard error (SE).
Figure 4
Figure 4
Actual total number of deaths per million (1M) population versus mean tc, the peak time of daily deaths (a), tNL national lock-down date (b), teff effective lock-down date (c), and 1-μ, the relative mobility drop (d). Pearson correlation coefficients are (a) r2=0.01 (p=0.77), (b) r2=0.06 (p=0.52), (c) r2=0.002 (p=0.92), and (d) r2=0.04 (p=0.62) indicating that there is no statistically significant correlation among these epidemic characteristics.
Figure 5
Figure 5
Relationships between key parameters of the COVID-19 pandemics and mobility data. (a) Change of basic reproductive number R02-R01 (left axis) and α2-α1 (right axis) versus the mobility drop 1-μ. Solid line indicates a power-law fit -ζ(1-μ)ρ, where ζ=3.18±0.11 and ρ=0.56±0.09. r2=0.85, (p=0.0005). (b) Elapsed time between the epidemic peak and the effective lock-down, tc-teff, versus the mobility drop 1-μ. Solid line indicates the linear fit Eq. (6), where τ0=17.04±1.62 and η=1.50±0.40.

References

    1. Brotons, C., Serrano, J., Fernandez, D., Garcia-Ramos, C., Ichazo, B., Lemaire, J., Montenegro, P. et al. Seroprevalence against COVID-19 and follow-up of suspected cases in primary health care in Spain. medRxiv (2020). - PMC - PubMed
    1. Jacqui W. Covid-19: surveys indicate low infection level in community. BMJ. 2020;369:m1992. - PubMed
    1. Tobías A. Evaluation of the lockdowns for the SARS-CoV-2 epidemic in Italy and Spain after one month follow up. Sci. Total Environ. 2020;725:138539. doi: 10.1016/j.scitotenv.2020.138539. - DOI - PMC - PubMed
    1. Salje H, Kiem CT, Lefrancq N, et al. Estimating the burden of SARS-CoV-2 in France [published online ahead of print, 2020 May 13] Science. 2020 doi: 10.1126/science.abc3517. - DOI - PMC - PubMed
    1. Hsiang S, et al. The effect of large-scale anti-contagion policies on the COVID-19 pandemic. Nature. 2020 doi: 10.1038/s41586-020-2404-8. - DOI - PubMed

Publication types