. 2021 Feb;23(2):160-171.
doi: 10.1038/s41556-020-00624-3. Epub 2021 Jan 18.

ALC1 links chromatin accessibility to PARP inhibitor response in homologous recombination-deficient cells

Affiliations

ALC1 links chromatin accessibility to PARP inhibitor response in homologous recombination-deficient cells

Priyanka Verma et al. Nat Cell Biol. 2021 Feb.

Abstract

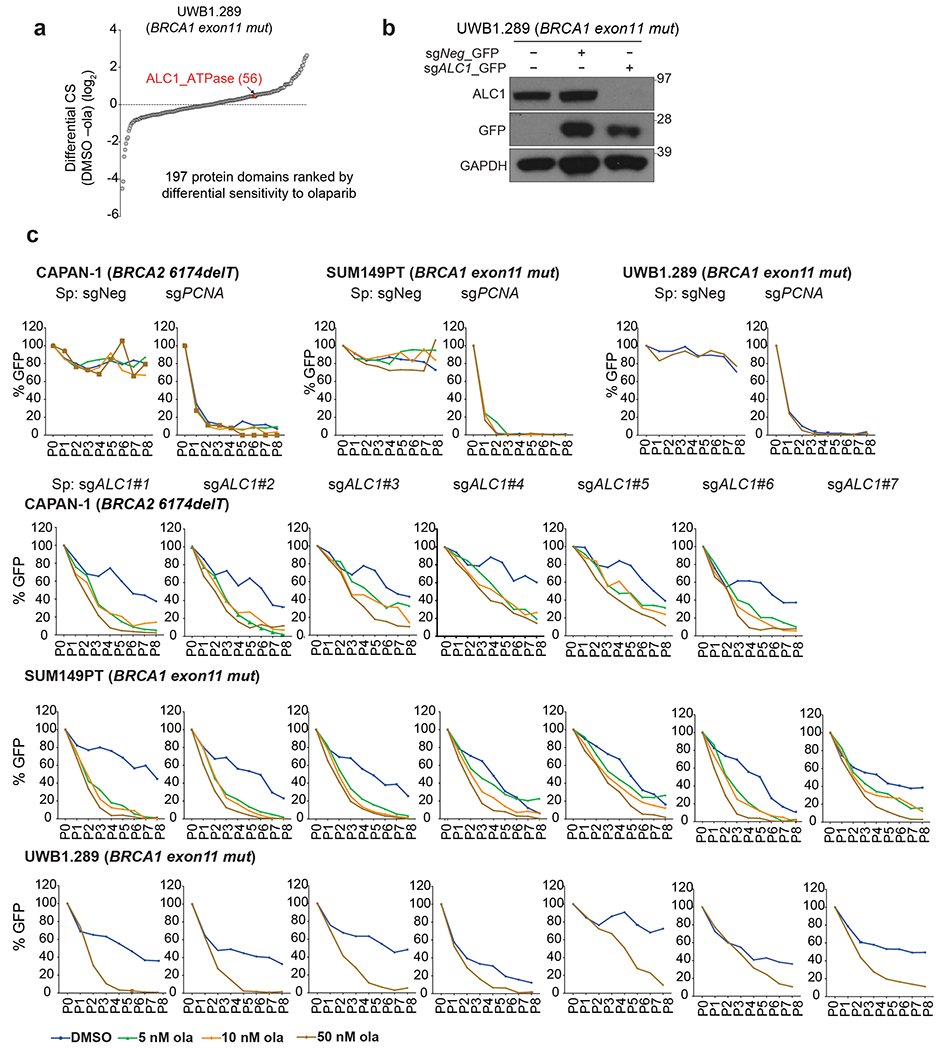
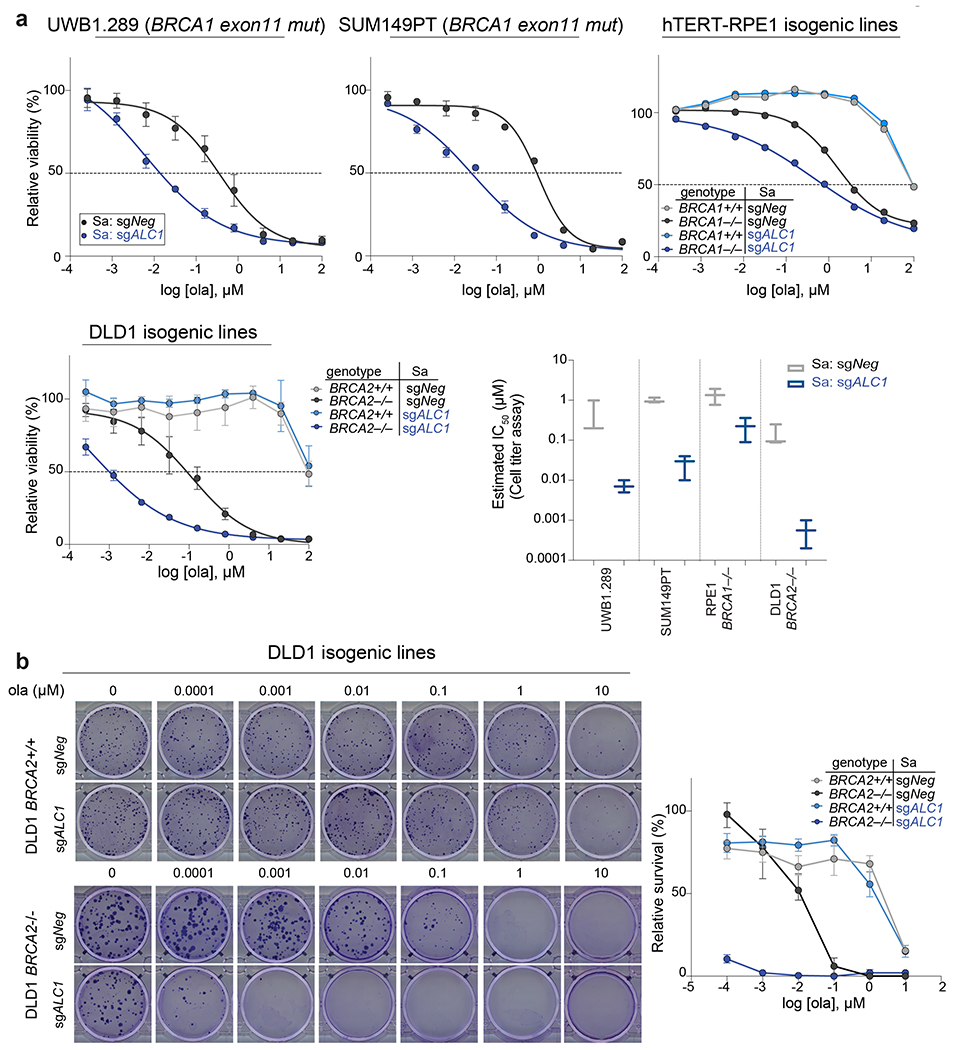
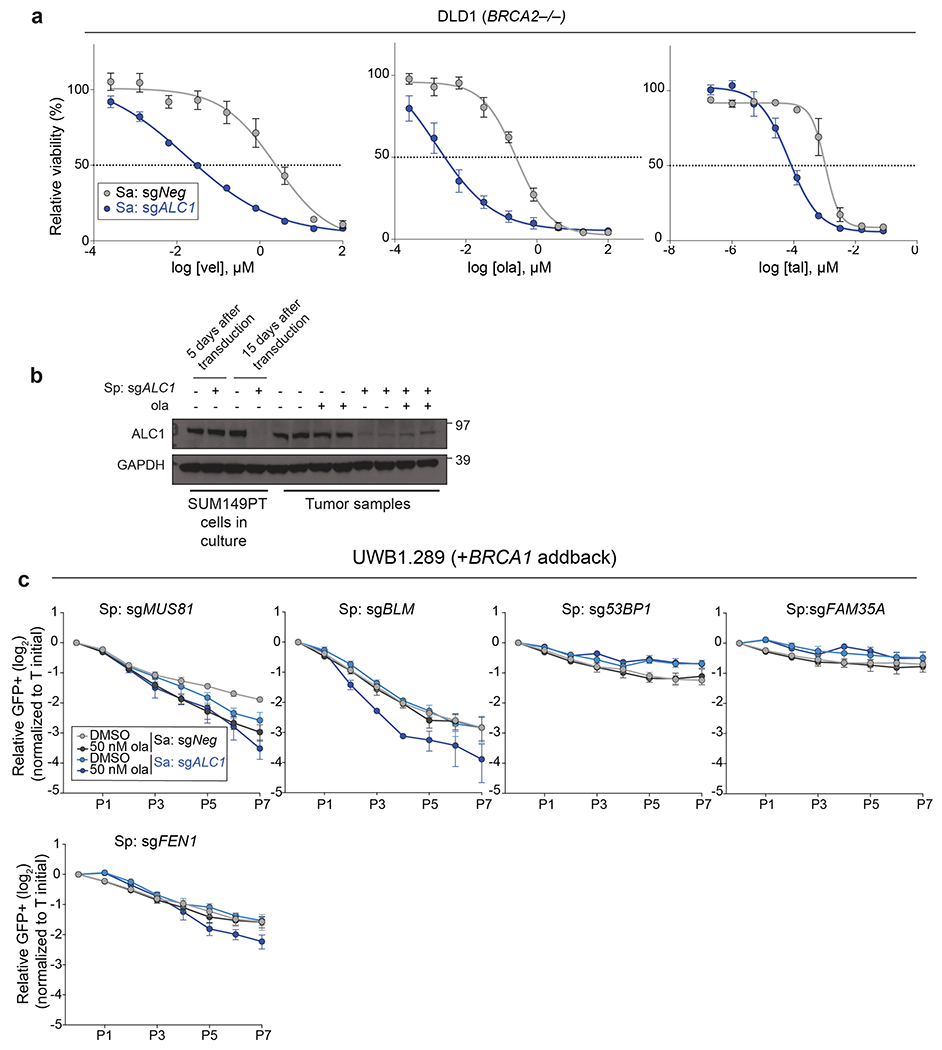
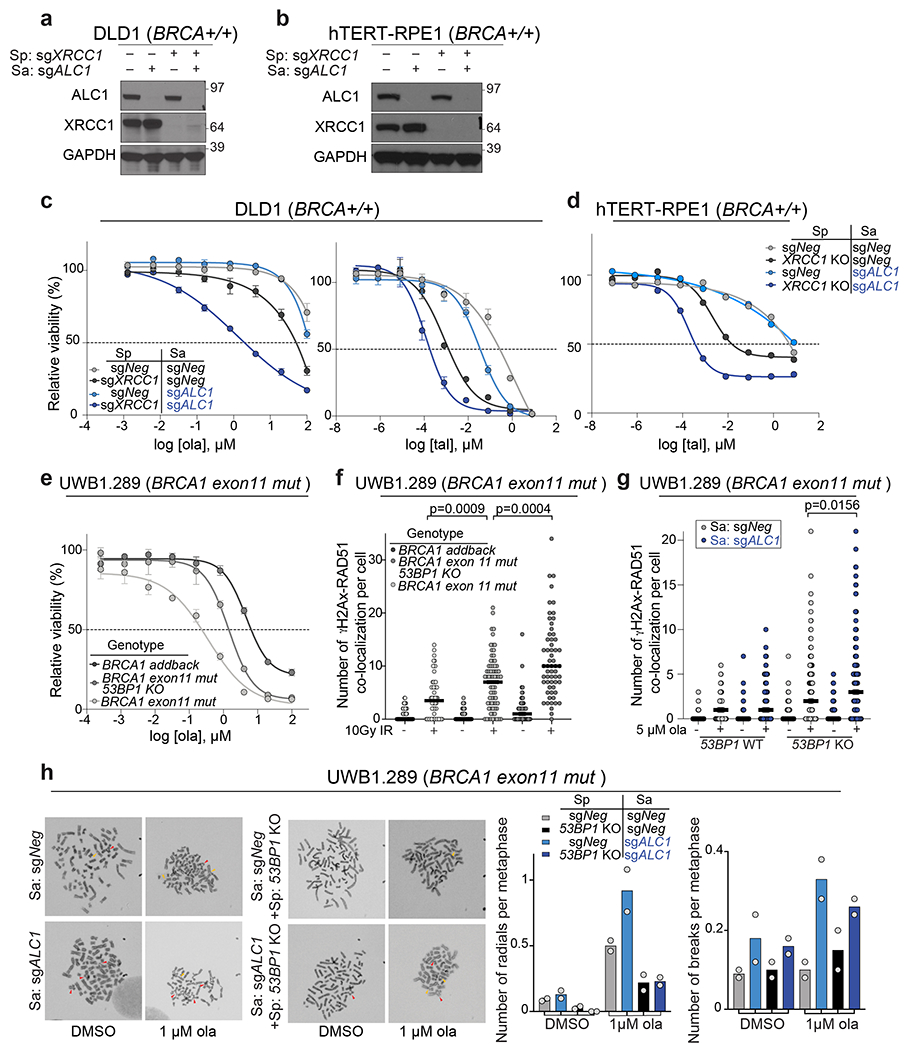
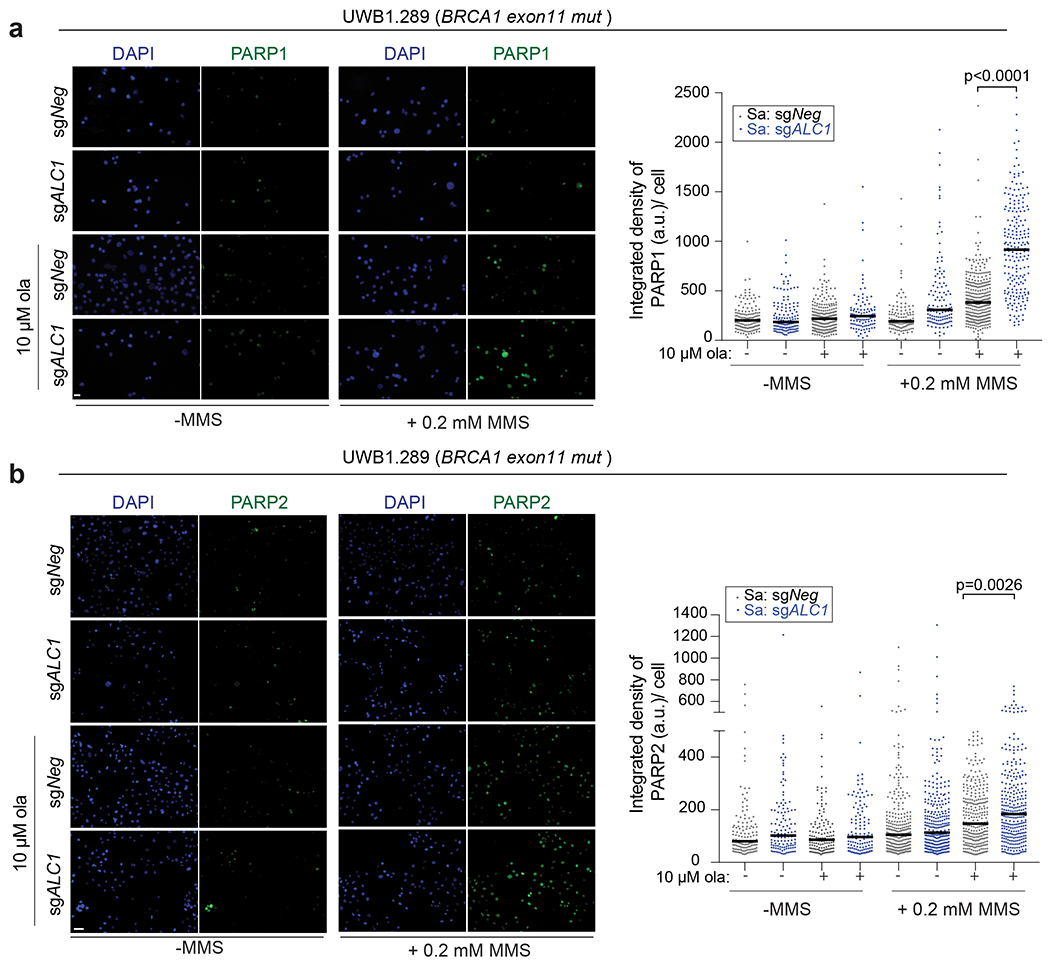
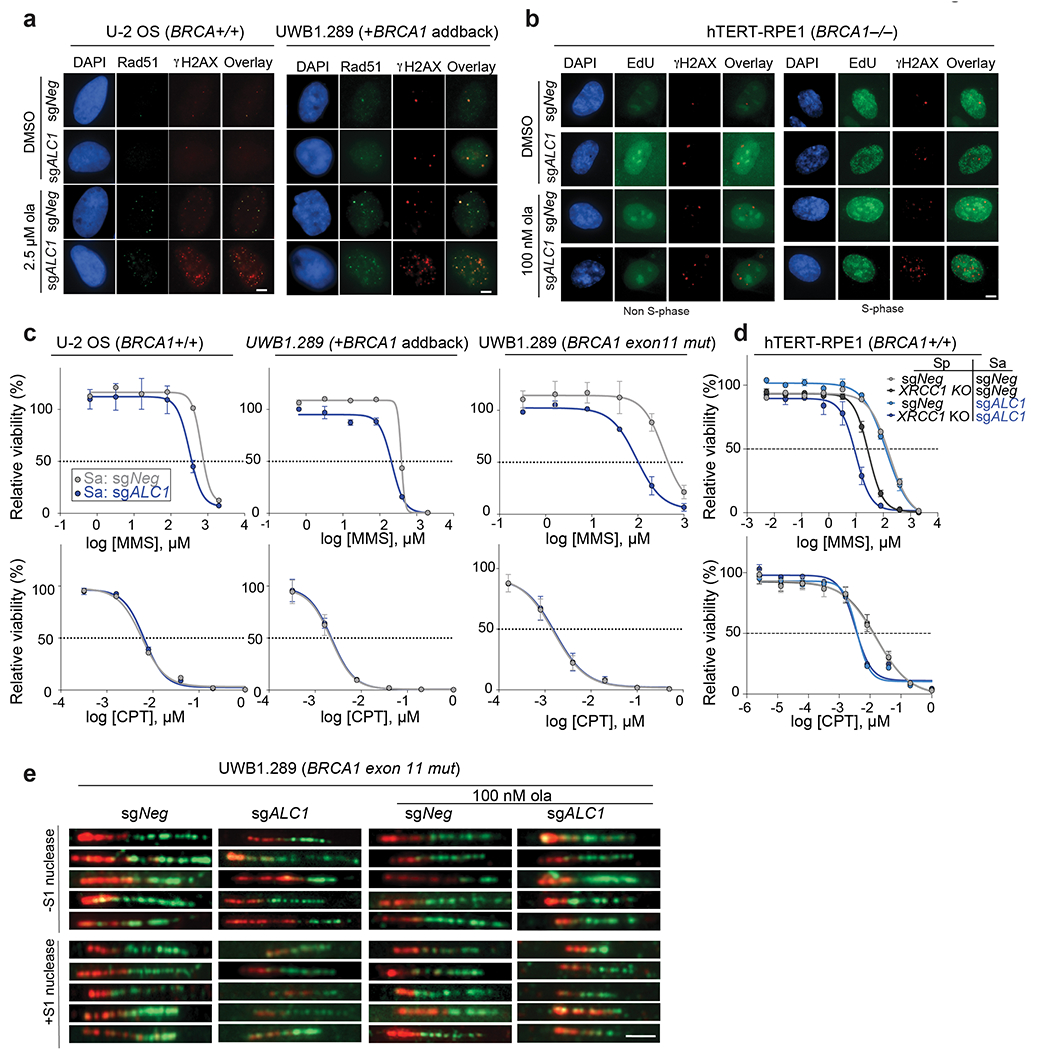
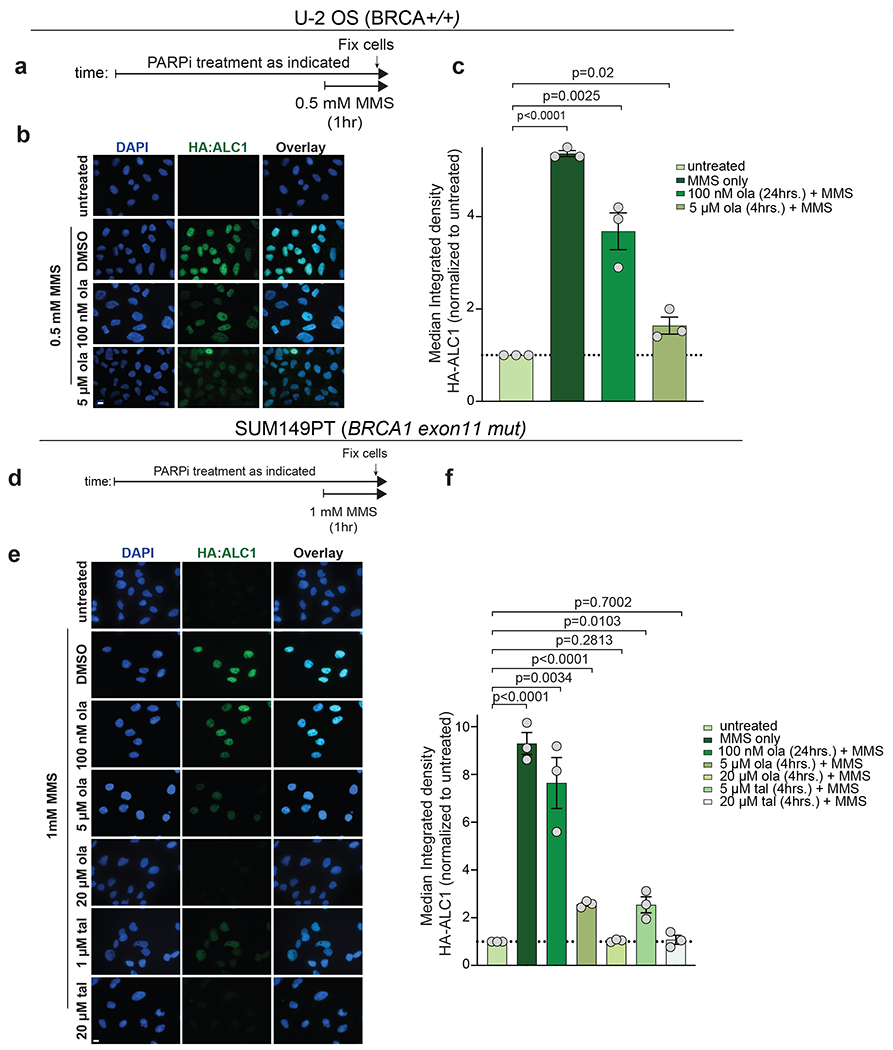
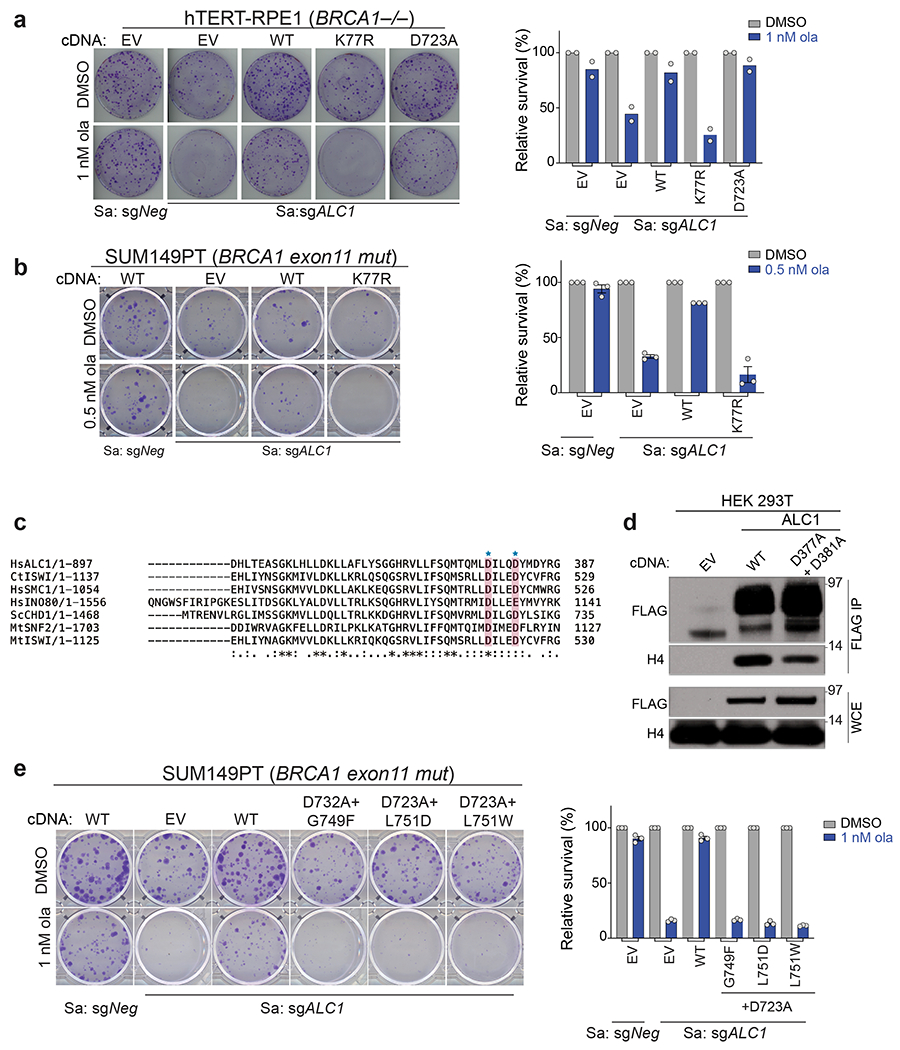
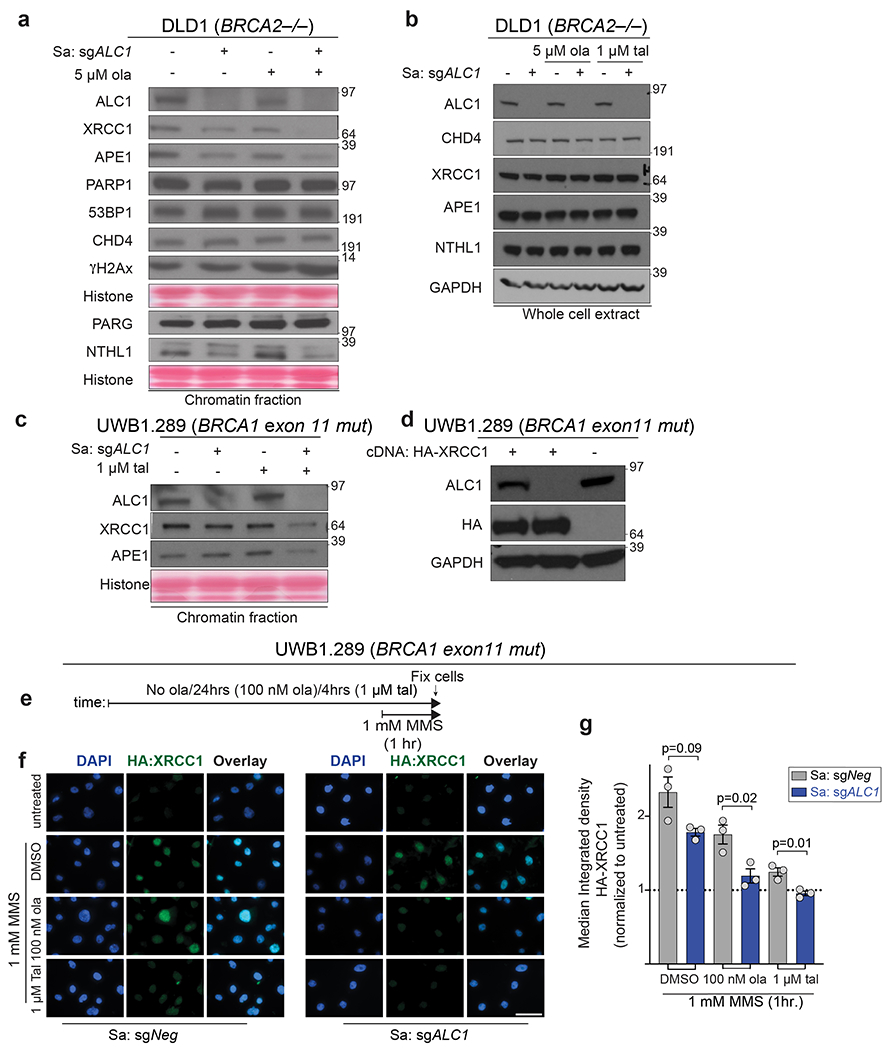
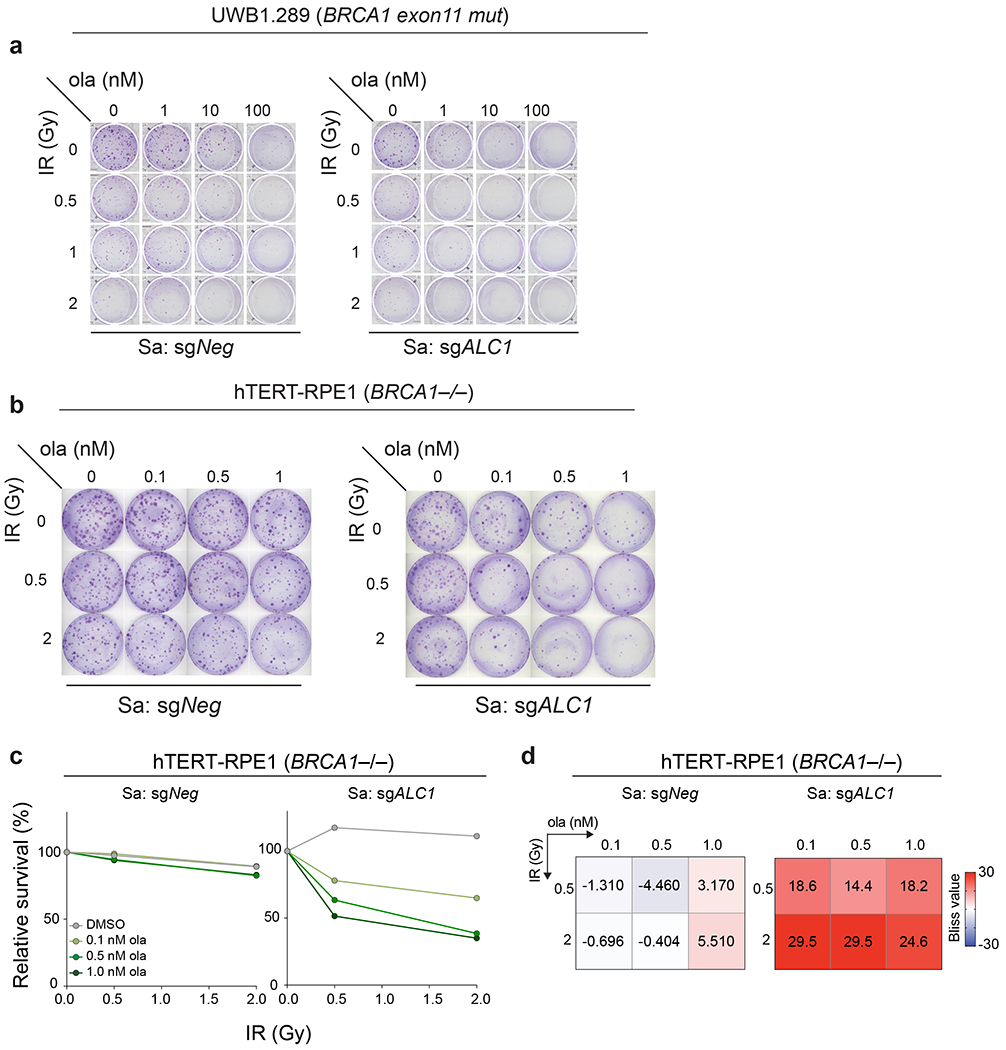
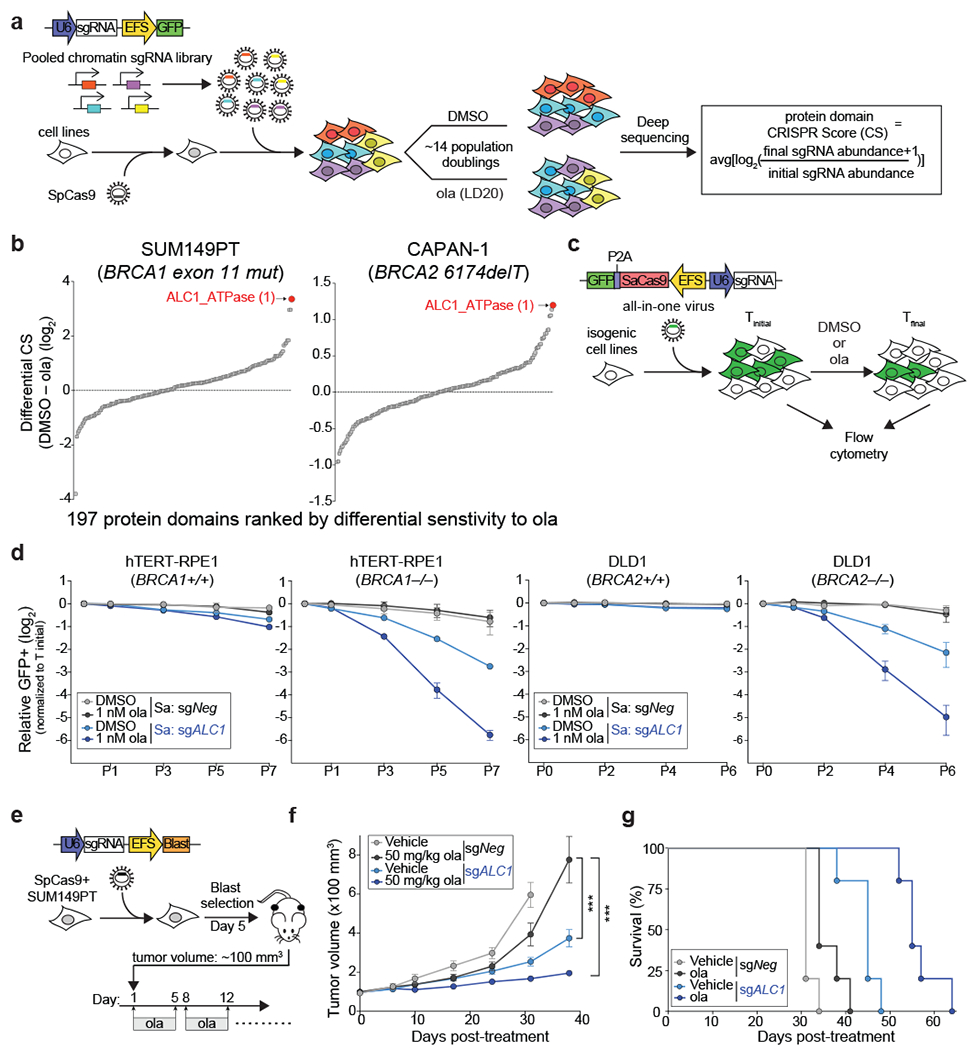
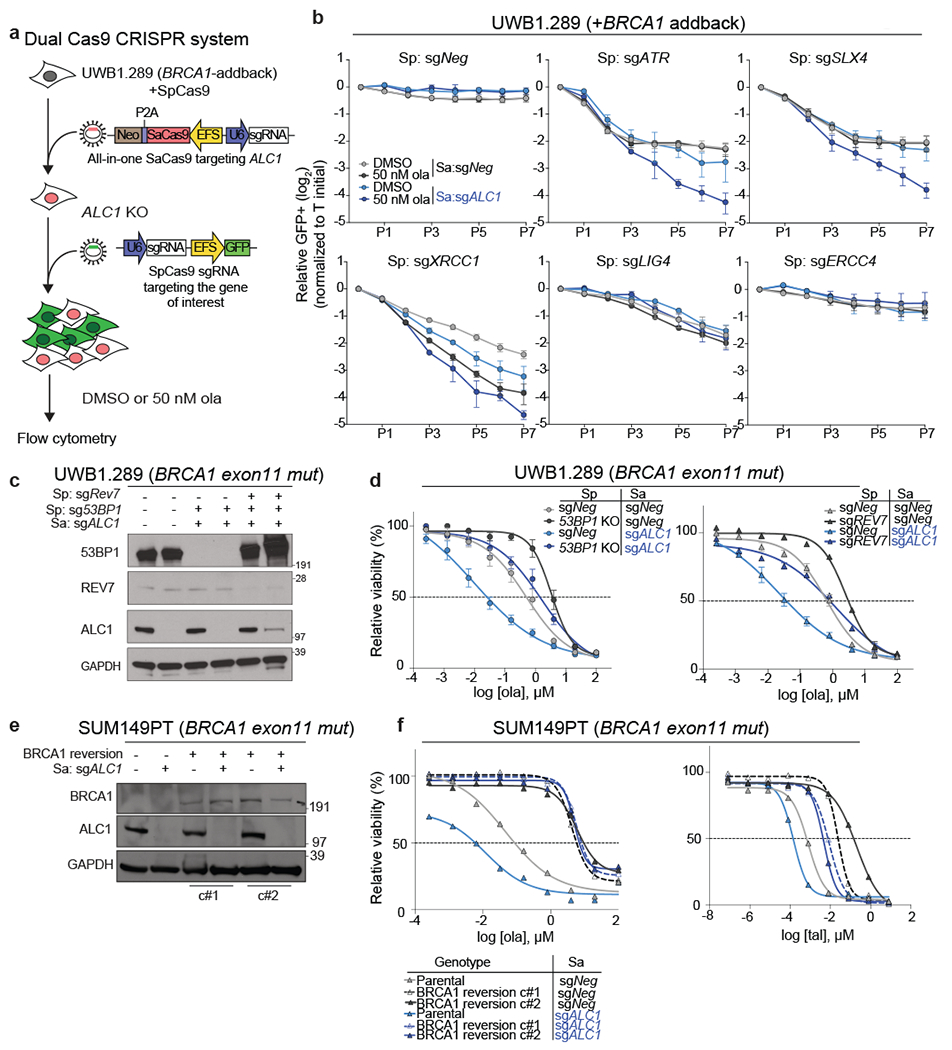
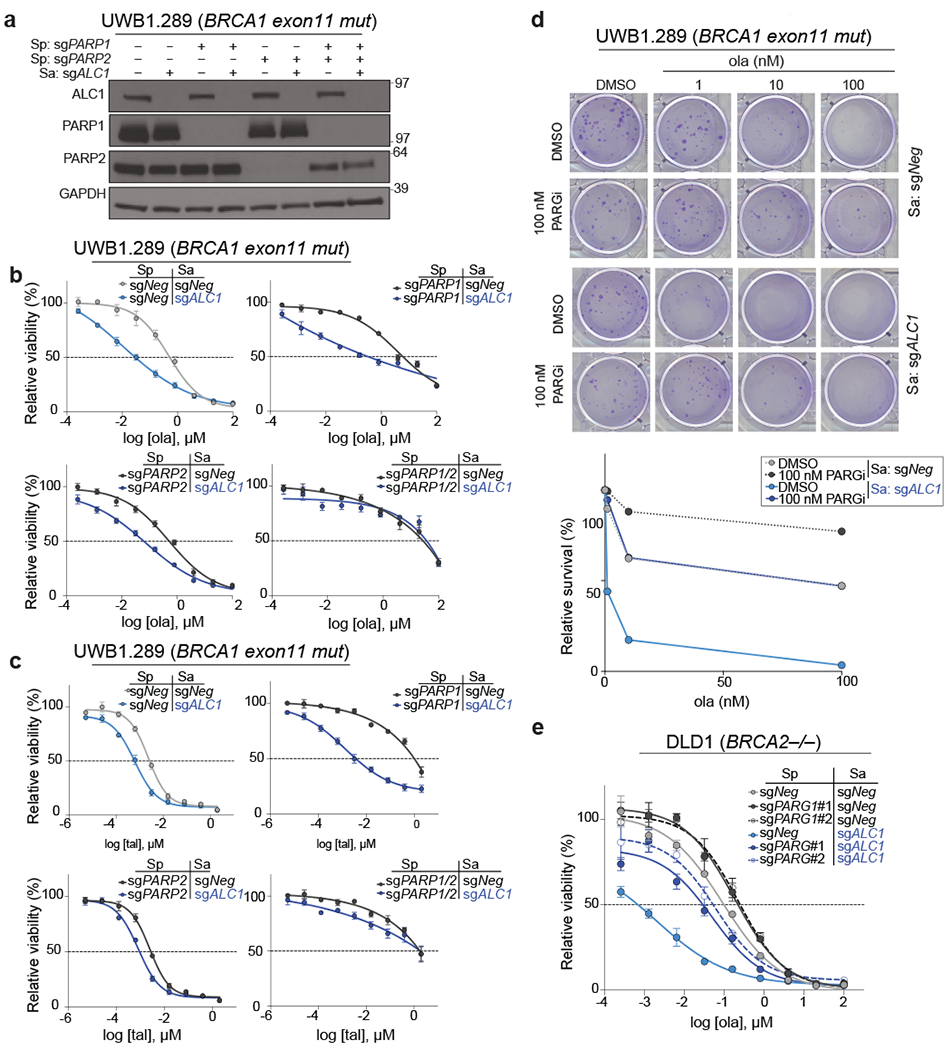
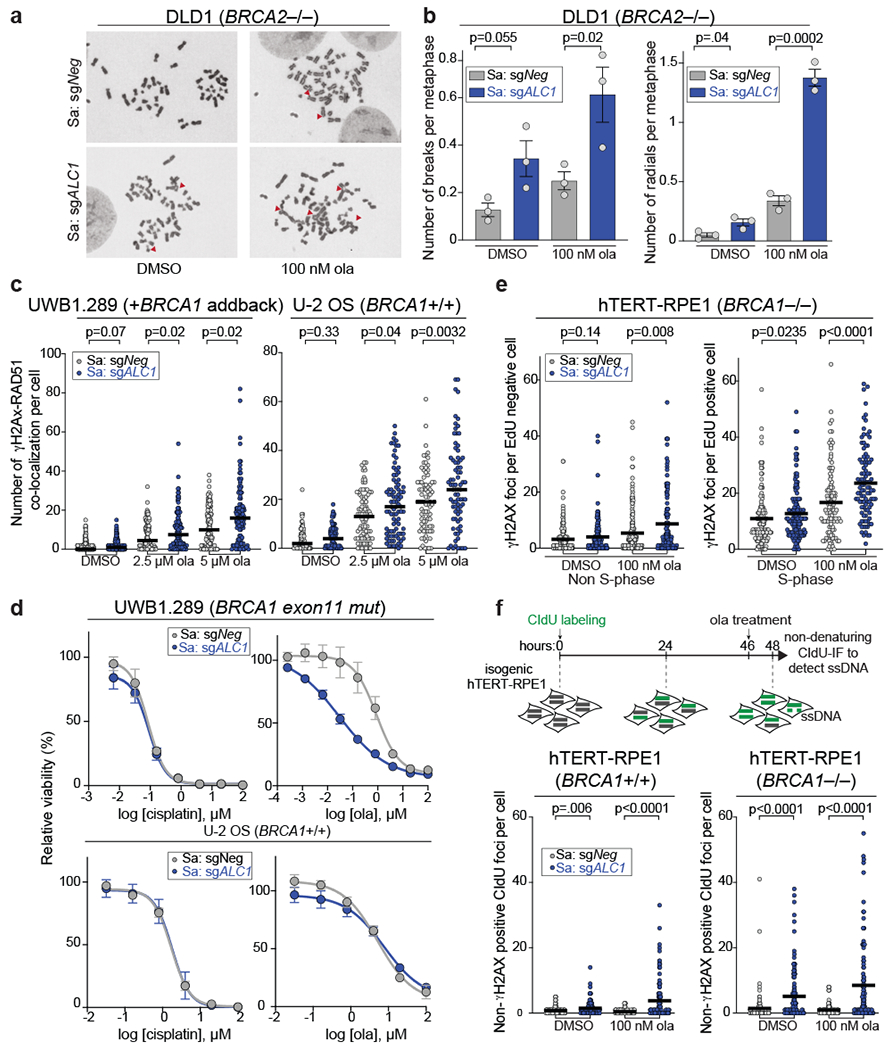
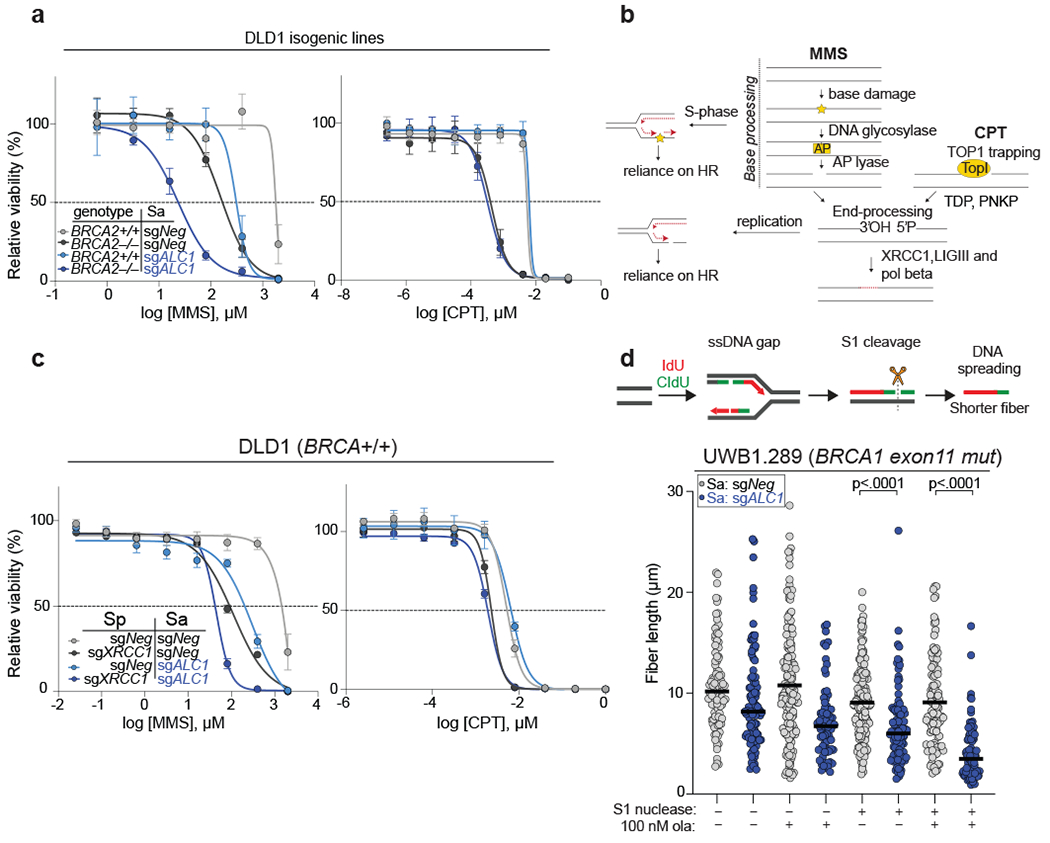
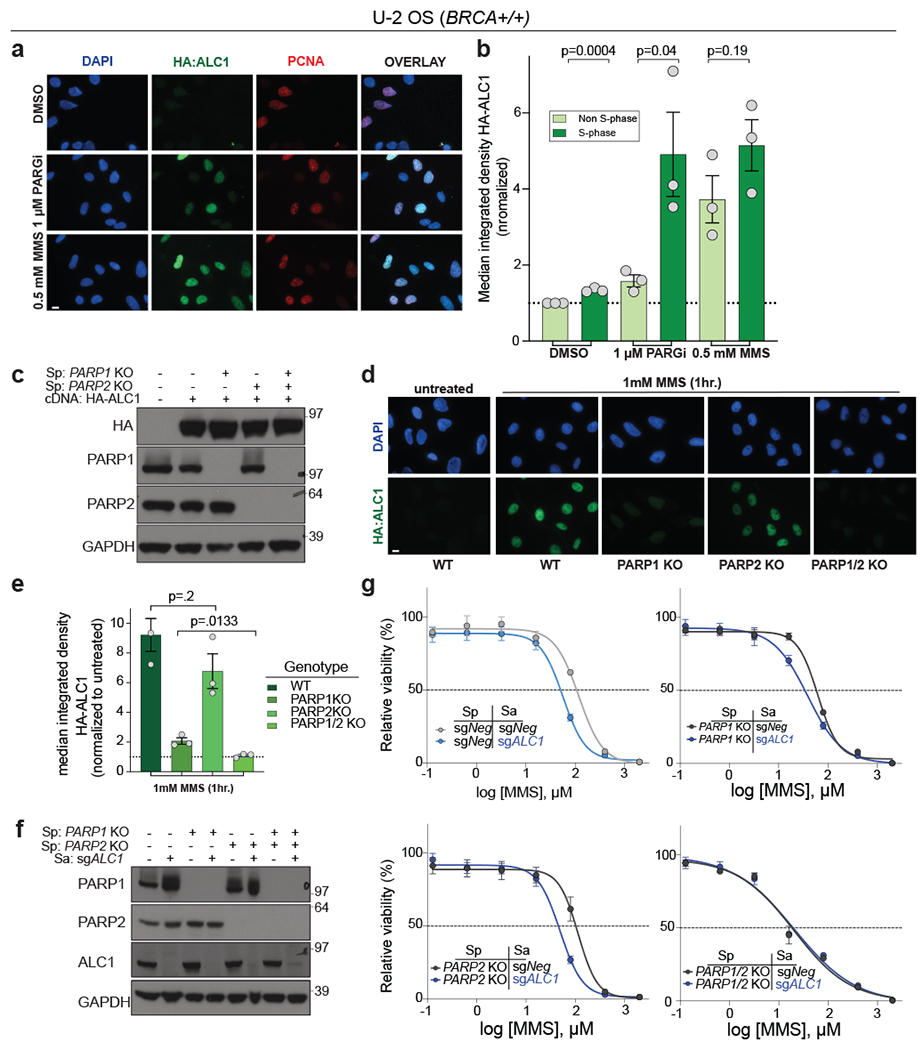
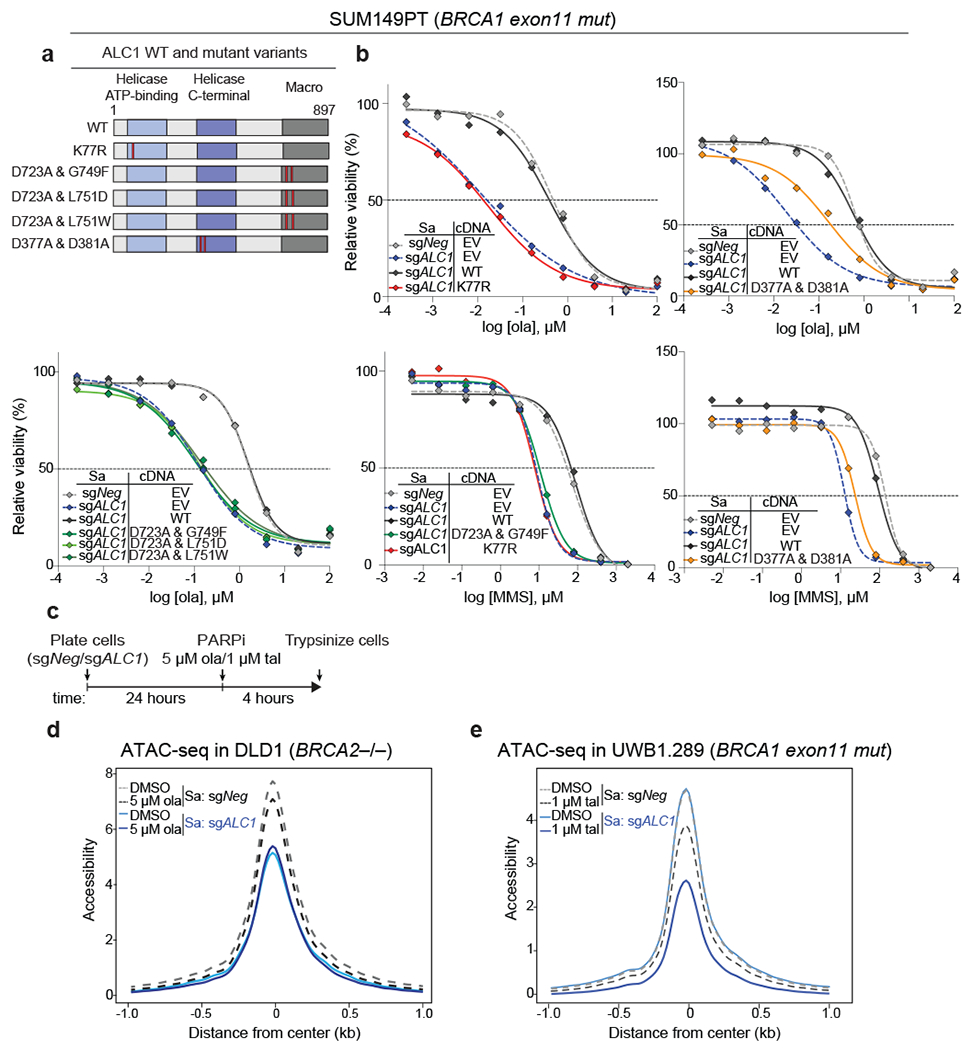
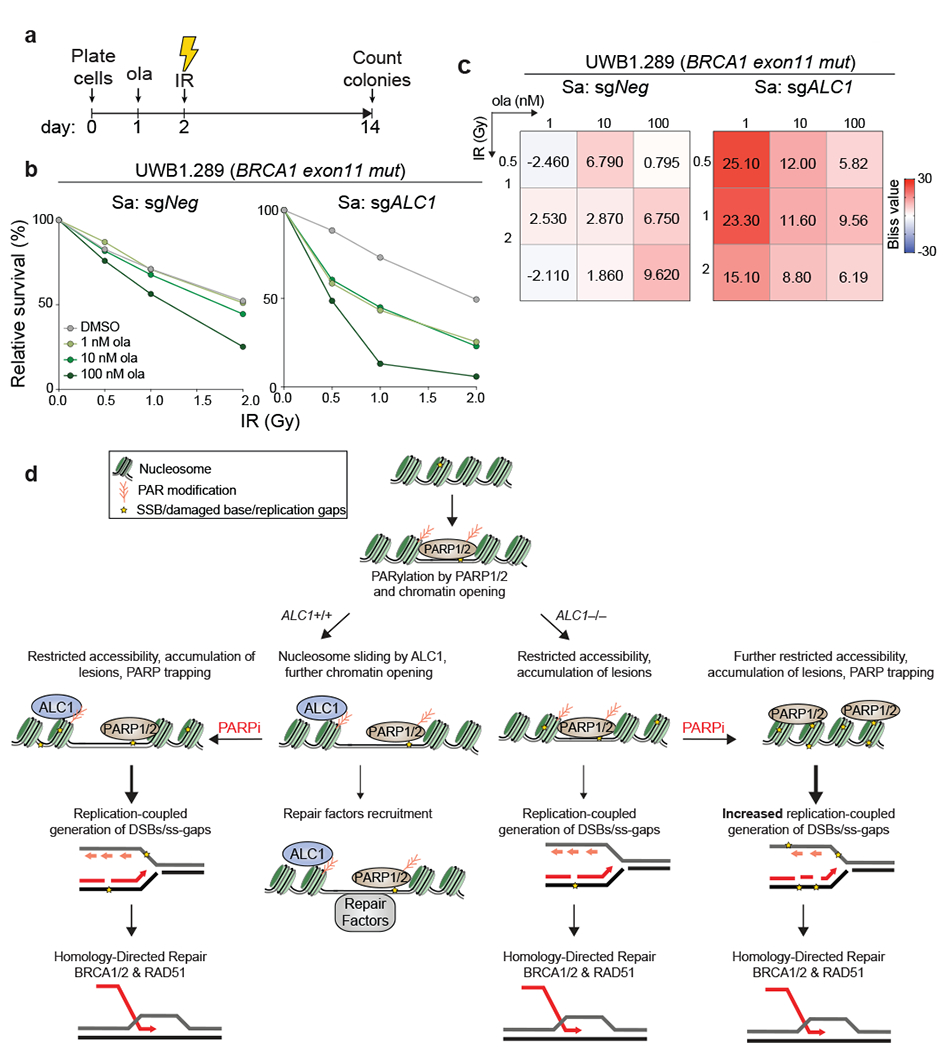
The response to poly(ADP-ribose) polymerase inhibitors (PARPi) is dictated by homologous recombination (HR) DNA repair and the abundance of lesions that trap PARP enzymes. It remains unclear, however, if the established role of PARP in promoting chromatin accessibility impacts viability in these settings. Using a CRISPR-based screen, we identified the PAR-binding chromatin remodeller ALC1/CHD1L as a key determinant of PARPi toxicity in HR-deficient cells. ALC1 loss reduced viability of breast cancer gene (BRCA)-mutant cells and enhanced sensitivity to PARPi by up to 250-fold, while overcoming several resistance mechanisms. ALC1 deficiency reduced chromatin accessibility concomitant with a decrease in the association of base damage repair factors. This resulted in an accumulation of replication-associated DNA damage, increased PARP trapping and a reliance on HR. These findings establish PAR-dependent chromatin remodelling as a mechanistically distinct aspect of PARPi responses and therapeutic target in HR-deficient cancers.


Conflict of interest statement

Competing interests

R.A.G. is a founder and scientific advisory board member of RADD Pharmaceuticals. No other authors declare any competing interests.

Figures

Extended Data Fig. 1
Extended Data Fig. 1. ALC1 loss renders olaparib hypersensitivity and proliferation defects in various BRCA-mutant lines.
a, Protein domains ranked on the basis of the CRISPR score (CS) for ola sensitivity in BRCA1-mutant UWB1.289 cells. b, Immunoblot showing depletion of ALC1 using a sgRNA vector with GFP selection marker. GFP positive cells were sorted and analyzed. The blot is a representative image of two biologically independent experiments. c, GFP competition assay to examine the effects of ALC1 depletion on ola sensitivity in CAPAN-1, SUM149PT and UWB1.289 cells. Ola sensitivity in CAPAN-1 and SUM149PT was confirmed using six and seven independent guides respectively and data for each guide are from one experiment performed at three different ola concentrations. Ola sensitivity in UWB1.289 was confirmed using seven independent guides and data for each guide is mean of two biologically independent experiments in the absence and presence of 50 nM ola concentration. Source data are provided.
Extended Data Fig. 2
Extended Data Fig. 2. ALC1 loss enhances the therapeutic window of olaparib sensitivity in BRCA-mutant cells.
a, Sensitivities of the indicated cell lines to ola using CellTiter-Glo. Data are mean of 2 (hTERT-RPE1) or mean ± s.e.m. of 3 (UWB1.289, SUM149PT and DLD1) biologically independent experiments. b, Representative images (left) and quantification (right) of the clonogenic survival of ALC1-depleted DLD1 WT and BRCA2-mutant cells grown in the presence of increasing concentrations of ola. Data are mean ± s.e.m. from 3 biologically independent experiments. Source data are provided.
Extended Data Fig. 3
Extended Data Fig. 3. Extended analysis of PARPi sensitivity upon ALC1 loss.
a, Sensitivities of the indicated DLD1 BRCA2−/− cells to vel (veliparib), ola and tal in CellTiter-Glo assay. Data are mean ± s.e.m. from n = 3 biologically independent experiments. b, Immunoblot showing ALC1 levels in cells used for xenograft studies (first four left lanes) and in tumors that reached >10.5 mm in any dimension, which is when the mice were euthanized. Data from two biologically independent tumors per condition are shown. c, GFP competition experiment in UWB1.289+BRCA1 addback line to examine the effects of the combined loss of ALC1 and the indicated DNA repair proteins on cell proliferation and ola sensitivity. Data are normalized to Tinitial and indicate mean ± s.e.m. After every two population doublings, cells were passaged (P) and GFP percent was recorded (n=4 independent transductions except for sgFEN1, where n = 6 independent transductions were performed). Source data are provided.
Extended Data Fig. 4
Extended Data Fig. 4. Genomic lesions in PARPi treated ALC1 deficient cells are repaired by SSBR and NHEJ.
a-b, Immunoblot showing levels of ALC1 and XRCC1 in indicated DLD1 (a) and hTERT-RPE1 (b) cells. The western samples were analyzed once to check the efficiency of the sgRNAs for protein depletion before drug sensitivity assays. c, Sensitivities of the indicated DLD1 cells lines to ola and tal using the CellTiter-Glo assay. Data are mean ± s.e.m. from n = 3 biologically independent experiments. d, Sensitivities of the indicated hTERT-RPE1 cells lines to tal using the CellTiter-Glo assay. Data are mean from n=2 biologically independent experiments. e, Sensitivities of the indicated UWB1.289 cell lines to ola using the CellTiter-Glo assay. Data are mean ± s.e.m. from n = 3 biologically independent experiments. f, Quantification of γH2AX-Rad51 foci in indicated cell lines. Cells were fixed 16 hrs. after treatment with 10 Gy ionizing radiation (IR). Median is indicated. p-value determined by Mann-Whitney was derived from n≥54 cells examined over two biologically independent experiments. g, Quantification of γH2AX-Rad51 foci in indicated cell lines. Cells were treated with 5 μM ola for 24 hrs. before fixation. Median is indicated. p-value determined by Mann-Whitney was derived from n≥114 cells examined over three biologically independent experiments. h, Representative images and quantification of radials (indicated by red arrow heads) and breaks (indicated by yellow arrowheads) in the indicated UWB1.289 cell lines, post treatment with 1 μM ola for 24 hrs. For each experiment, at least 50 spreads were analyzed per sample. Data are mean from two biologically independent experiments. Source data are provided.
Extended Data Fig. 5
Extended Data Fig. 5. ALC1 deficiency results in increased trapping of PARP1 and PARP2 by PARPi upon DNA damage.
a-b Representative images (left) and quantification (right) of PARP1(a) and PARP2 (b) trapping in UWB1.289 cells. Indicated treatments were performed for 4 hours. Median is indicated. p-value determined by Mann-Whitney was derived from n≥107 cells sampled over two biologically independent experiments.
Extended Data Fig. 6
Extended Data Fig. 6. ALC1 loss confers MMS sensitivity and results in replication-coupled gaps.
a, Representative images of Rad51-γH2AX foci in U-2 OS (left) and UWB1.289+BRCA1 (right) cell lines Scale bar: 10 microns. Images represent n≥67 cells examined over two biologically independent experiments. b, Representative images of γH2AX signal in EdU negative (left) and positive (right) hTERT-RPE1 BRCA1−/− cells. Scale bar: 10 microns. Images represent n≥99 cells examined over two biologically independent experiments. c, Sensitivities of the indicated cells lines to MMS and CPT using the CellTiter-Glo assay. Data are mean ± s.e.m. from n=3 biologically independent experiments. d, Sensitivities of the indicated hTERT-RPE1 cells lines to MMS and CPT using the CellTiter-Glo assay. Data are mean ± s.e.m. from n = three biologically independent experiments. e, Representative images of fibers from the S1 nuclease experiment. Scale bar: 2 microns. Images represent n≥75 fibers examined over two biologically independent experiments. Source data are provided.
Extended Data Fig. 7
Extended Data Fig. 7. ALC1 is recruited to the damaged chromatin under conditions of reduced PARylation.
a, Schematic of the experiment. b-c, Representative images (b) and quantification (c) of HA-ALC1 localization to chromatin upon indicated treatments in U-2 OS cells. d, Schematic of the experiment. e-f, Representative images (e) and quantification (f) of HA-ALC1 localization to chromatin upon indicated treatments in SUM149PT cells. Scale bar, 10 microns. The median value was normalized to untreated control. Data are mean ± s.e.m. from n = three biologically independent experiments, p-value, unpaired Student’s t-test. For each experiment, at least 50 cells were analyzed per sample. Source data are provided.
Extended Data Fig. 8
Extended Data Fig. 8. ATPase activity, H4 interaction and macrodomains of ALC1 are essential for protecting BRCA-mutant cells from ola hypersensitivity.
a, Representative images (left) and quantification (right) of the clonogenic survival assay using hTERT-RPE1 BRCA1−/− cells expressing sgALC1 and the indicated ALC1 mutants treated with ola (1 nM). Data are mean from two biologically independent experiments. b, Representative images (left) and quantification (right) of the clonogenic survival assay (left) using SUM149PT cells expressing sgALC1 and ALC1 K77R mutant treated with ola (0.5 nM). Data are mean ± s.e.m from n = three independent experiments. Number of colonies in the ola treated condition were normalized to its respective untreated counterpart. c, Sequence alignment of various chromatin remodelers using Clustal Omega. Histone H4 interacting residues as predicted by PDB:6PWF are highlighted and marked by a blue star. d, Immunoblots showing interactions of FLAG ALC1 WT and FLAG ALC1 D377A+ D381A with histone H4. Experiment was repeated twice with similar outcomes. e, Representative images of the clonogenic survival assay (left) and quantification (right) of SUM149PT cells expressing sgALC1 and indicated ALC1 macrodomain mutants treated with ola (1 nM). Data are mean ± s.e.m. from n = three independent experiments. Number of colonies in the ola treated condition were normalized to its respective untreated counterpart. Source data are provided.
Extended Data Fig. 9
Extended Data Fig. 9. ALC1 co-operates with PARP activity to permit association of repair proteins with chromatin.
a, DLD1 BRCA2−/− cells were fractionated and the chromatin-bound proteins were immunoblotted. Cells were treated with 5 μM ola for 4 hrs. Data for DLD1 BRCA2−/− cells are from the same sample, from two different western blots and the histone levels for each blot are shown by the ponceau staining. The data for XRCC1 is representative of 5 biologically independent experiments and the data for NTHL1 and APE1 is representative of 3 biologically independent experiments. b, Immunoblot of whole cell lysates of DLD1 BRCA2−/− cells showing total proteins levels upon ALC1 depletion and PARPi treatment. Cells were treated with indicated PARPi for 4 hrs. Data is representative of two biologically independent experiments. c, UWB1.289 cells were fractionated and the chromatin-bound proteins were immunoblotted. Cells were treated with 1 μM tal for 4 hrs. Data for XRCC1 is representative of 4 biologically independent experiments and the data for APE1 is representative of 3 biologically independent experiments. d, Immunoblot showing expression levels of HA-XRCC1. The blot was performed once to access the expression level of the tagged protein. e, Schematic of the IF experiment. f-g, Representative images (f) and quantification (g) of HA-XRCC1 localization to chromatin upon indicated treatments. Scale bar, 50 microns. Data are mean ± s.e.m. from n = three biologically independent experiments, p-value, unpaired Student’s t-test. For each cell line, the median value upon MMS treatment was normalized to its respective untreated control. Source data are provided.
Extended Data Fig. 10
Extended Data Fig. 10. ALC1 loss synergistically enhances IR sensitivity at low olaparib doses.
a-b Representative images of two independent clonogenic survival assay to monitor the effect of combining low doses of ola and IR upon ALC1 depletion in UWB1.289 (a) and hTERT-RPE1 BRCA1−/− cells (b). c-d, Quantification of clonogenic survival (c) and heat map of bliss scores (d) obtained from BRCA1−/− hTERT-RPE1 cells treated with the indicated doses of ola and IR. Data are mean from two biologically independent experiments. Bliss score >0, synergistic; Bliss score <0, antagonistic; Bliss score = 0, additive. Number of colonies in IR-treated conditions were normalized to their respective un-irradiated counterparts. Colonies with more than 50 cells were included in the analysis. Source data are provided.
Fig. 1
Fig. 1. Loss of ALC1 reduces proliferation and confers olaparib hypersensitivity in BRCA-mutant cells.
a, Schematic of the CRISPR screen to identify regulators of olaparib (ola) sensitivity. b, Protein domains ranked on the basis of CRISPR score (CS) for ola sensitivity in BRCA1-mutant SUM149PT cells (left) and BRCA2-mutant CAPAN-1 cells (right). c, Schematic of the GFP competition experiments. For a given cell line, Tinitial indicates the day when maximum GFP expression is achieved for a sgRNA targeting an essential gene. Tfinal indicates the final day of the data collection. d, GFP competition assay in isogenic BRCA-mutant lines upon transduction of sgNeg or sgALC1 (n=3-6 independent transductions). Data are mean ± s.e.m., normalized to Tinitial. After every two population doublings, cells were passaged (P) and percent GFP was recorded. e, Schematic of the xenograft experiment. f, Measurement of tumor volume after ola treatment was initiated (n=10 tumors for sgNeg + ola, sgALC1 + vehicle, sgALC1 + ola and n=8 tumors for sgNeg + vehicle). Data are mean ± s.e.m., p-values are derived from a 2-way ANOVA. g, Kaplan-Meier survival analysis (n=5 mice per group). A significantly improved survival was observed in vehicle (light blue) and ola (dark blue) treated sgALC1 xenografts compared to the ola treated sgNeg counterpart (black), p=0.04 and p=0.0015 respectively using Log-rank (Mantel-Cox) test. ***P ≤ 0.001. Cas9 from S. aureus (Sa) and S. pyogenes (Sp) was used as indicated. Source data are provided.
Fig. 2
Fig. 2. ALC1 loss causes PARPi hypersensitivity in HR-deficient cells.
a, Schematic of the dual Cas9 CRISPR system for the GFP competition experiments. b, GFP competition experiment in the UWB1.289+BRCA1 addback line to examine cell proliferation and ola sensitivity following the combined loss of ALC1 and the indicated DNA repair protein. Data are mean ± s.e.m., normalized to Tinitial. After every two population doublings, cells were passaged (P) and percent GFP was recorded (n=4 independent transductions, except for sgXRCC1 and sgERCC4, where n = 6 independent transductions were made). c, Immunoblot showing ALC1, 53BP1 and Rev7 depletion in UWB1.289 cells. Consistent results were obtained across two independent blots. d, Sensitivities of the indicated UWB1.289 cell lines to ola using the CellTiter-Glo assay; n=3 biologically independent experiments. Data are mean ± s.e.m. e, Immunoblot showing BRCA1 and ALC1 levels in the indicated SUM149PT cells. Consistent results were obtained across two independent blots. f, Sensitivities of the indicated SUM149PT cell lines to ola (left) and talazoparib (tal) (right) using the CellTiter-Glo assay. c#1 and c#2 indicate two different clones with restored BRCA1 reading frames. Data are mean from 2 biologically independent experiments. Source data are provided.
Fig. 3
Fig. 3. ALC1 loss mitigates PARPi resistance in BRCA-mutant cells that are deficient in PARP1 or PARG.
a, Immunoblot showing ALC1, PARP1 and PARP2 depletion in UWB1.289 cells. Consistent results were obtained across two independent blots. b-c, Sensitivities of the indicated UWB1.289 cell lines to ola (b) and tal (c) using the CellTiter-Glo assay. Data are mean ± s.e.m. from n = three biologically independent experiments. d, Representative images (top) and quantification (bottom) of the clonogenic survival assay of UWB1.289 cells treated with the indicated doses of ola and PARG inhibitor (PARGi). Colonies with more than 50 cells were included in the quantification. Data are mean from two biologically independent experiments. e, Sensitivities of the indicated DLD1 BRCA2−/− cell lines to ola using the CellTiter-Glo assay. sgPARG#1 and sgPARG#2 indicate two sgRNAs targeting PARG. Data are mean ± s.e.m. from n = three biologically independent experiments. Source data are provided.
Fig. 4
Fig. 4. Loss of ALC1 increases genomic instability.
a-b, Representative images (a) of the chromosomal aberrations (indicated by red arrow heads) and quantification (b) of breaks and radials per metaphase upon ALC1 depletion in DLD1 BRCA2−/− cells. Data are mean ± s.e.m. from n = three biologically independent experiments, p-value, unpaired t-test. For each experiment, at least 50 spreads were analyzed per sample. c, Quantification of γH2AX-RAD51 co-localization in indicated UWB1.289 + BRCA1 add back and U-2 OS cells. Median is indicated. p-value determined by Mann-Whitney was derived from n≥67 cells examined over two biologically independent experiments. d, Sensitivities of the indicated cell lines to cisplatin and ola as determined by CellTiter-Glo assay. Data are mean ± s.e.m. from n = three biologically independent experiments. e, Quantification of γH2AX foci in non-S-phase (left) and S-phase (right) cells. Median is indicated. p-value determined by Mann-Whitney was derived from n≥99 cells examined over two biologically independent experiments. f, Schematic and quantification of non-γH2AX positive CIdU foci in the indicated cell lines to specifically detect single strand (ss)-DNA that was not generated by end-resection at DSBs. Median is indicated. p-value determined by Mann-Whitney was derived from n≥105 cells sampled over two biologically independent experiments. Cells were incubated with the indicated concentrations of ola for either 2 hrs (f) or 24 hrs (b, c, e). Source data are provided.
Fig. 5
Fig. 5. ALC1 function in base damage repair is not epistatic with HR and single-strand break repair (SSBR).
a, Sensitivities of the indicated DLD1 isogenic lines to methyl methanesulfonate (MMS) and camptothecin (CPT) in the CellTiter-Glo assay. Data are mean ± s.e.m. from n = three biologically independent experiments. b, Schematic of SSBR pathway. While base damage requires processing events at the chromatin, CPT traps TOP1 on already nicked substrates. Replication of damaged bases results in gaps and SSBs, that increase reliance on HR for repair. c, Sensitivities of the indicated DLD1 cell lines to MMS and CPT in the CellTiter-Glo assay. Data are mean ± s.e.m. from n = three biologically independent experiments. d, Schematic and quantification of fiber length in the absence and presence of S1 nuclease in the indicated cell lines. Median is indicated. p-value determined by Mann-Whitney was derived from n≥75 fibers sampled over two independent experiments. Cells were incubated with 100 nM ola for 24 hrs. Source data are provided.
Fig. 6
Fig. 6. ALC1 function in the DNA damage response requires PARP1 and PARP2.
a-b, Representative images (a) and quantification (b) of HA-ALC1 localization to chromatin upon the indicated treatments. Scale bar, 10 microns. The median value was normalized to non-S-phase untreated control. Data are mean ± s.e.m. from n= three biologically independent experiments. p-value, unpaired Student’s t-test. For each experiment, at least 50 cells were analyzed per sample. c, Immunoblot showing stable expression of HA-ALC1 in indicated cell lines. Samples were analyzed once to examine the level of overexpression prior to localization experiments. d-e, Representative images (d) and quantification (e) of HA-ALC1 localization to chromatin, scale bar 10 microns. For each cell line, the median value upon MMS treatment was normalized to its respective untreated control. Data are mean ± s.e.m. from n=three biologically independent experiments, p-value, unpaired Student’s t-test. For each experiment, at least 50 cells were analyzed per sample. f, Immunoblot showing depletion of ALC1 in the indicated cell lines. Consistent results were obtained across two independent blots. g, Sensitivities of the indicated U-2 OS lines to MMS in the CellTiter-Glo assay. Data are mean ± s.e.m. from n=three biologically independent experiments. Source data are provided.
Fig. 7
Fig. 7. ALC1 PAR-recognition and chromatin-remodeling activities are essential for responses to PARPi and MMS.
a, Domain organization and mutants of ALC1 used in this study. The helicase ATP-binding (light blue), helicase C-terminal (dark blue), and macro domains (grey) are indicated. Red bars show the position of the residues that were mutated. b, Sensitivities of SUM149PT cells expressing various ALC1 mutants to ola and MMS using the CellTiter-Glo assay (EV: empty vector and WT: wild type). Data are mean from two biologically independent experiments. c, Schematic of the experiment used to examine the effects of ALC1 loss and PARPi treatment on chromatin accessibility d, ATAC-seq analysis in DLD1 BRCA2−/− cells to assess global accessibility of chromatin. Cells were treated with ola for 4 hours. Data is from three biologically independent replicates for each condition. e, ATAC-seq analysis in UWB1.289 cells to assess global accessibility of chromatin. Cells were treated with tal for 4 hrs. Data is from three biologically independent replicates of untreated sgNeg and sgALC1+tal and two biologically independent replicates of sgNeg+tal and untreated sgALC1 cells. For plotting of both the ATAC-seq graphs (d,e) the 2000 base-pairs flanking the center of the accessible sites (i.e. from −1 to 1 on x-axis) were divided into equally sized 20 bp regions. The differential accessibility was calculated at each of these 20 bp regions. Source data are provided.
Fig. 8
Fig. 8. Co-operation between ALC1 with PARP activity facilitates chromatin-directed DNA repair.
a, Schematic of the experiment to examine the effects of combining low doses of PARPi with ionizing radiation (IR) in ALC1 depleted cells. b-c, Quantification of clonogenic survival (b) and heat map of bliss scores (c) obtained from UWB1.289 cells treated with the indicated doses of ola and IR. Data are mean from two biologically independent experiments. Bliss score >0, synergistic; Bliss score <0, antagonistic; Bliss score = 0, additive. Number of colonies in IR-treated conditions were normalized to their respective un-irradiated counterparts. Colonies with more than 50 cells were included in the analysis. d, Model depicting cooperation between ALC1 and PARylation in response to DNA damage. PARylation results in ALC1 recruitment and chromatin decondensation. Nucleosome sliding by ALC1 further enhances chromatin accessibility. Combined loss of ALC1 and PARP activities reduces the access of base damage repair factors to the chromatin. Unrepaired base and SSBs result in the generation of replication-coupled ss-gaps and DSBs during S-phase that necessitate repair by BRCA-dependent HR. Source data are provided.

References

    1. Langelier M-F, Planck JL, Roy S & Pascal JM Structural basis for DNA damage-dependent poly(ADP-ribosyl)ation by human PARP-1. Science 336, 728–732 (2012). - PMC - PubMed
    1. Langelier M-F, Riccio AA & Pascal JM PARP-2 and PARP-3 are selectively activated by 5’ phosphorylated DNA breaks through an allosteric regulatory mechanism shared with PARP-1. Nucleic Acids Res. 42, 7762–7775 (2014). - PMC - PubMed
    1. Gupte R, Liu Z & Kraus WL PARPs and ADP-ribosylation: recent advances linking molecular functions to biological outcomes. Genes Dev. 31, 101–126 (2017). - PMC - PubMed
    1. Poirier GG, de Murcia G, Jongstra-Bilen J, Niedergang C & Mandel P Poly(ADP-ribosyl)ation of polynucleosomes causes relaxation of chromatin structure. Proc. Natl. Acad. Sci. U. S. A. 79, 3423–3427 (1982). - PMC - PubMed
    1. Krishnakumar R et al. Reciprocal binding of PARP-1 and histone H1 at promoters specifies transcriptional outcomes. Science 319, 819–821 (2008). - PubMed

Publication types

MeSH terms