. 2021 Mar;6(3):313-326.
doi: 10.1038/s41564-020-00837-0. Epub 2021 Jan 18.

Mucoricin is a ricin-like toxin that is critical for the pathogenesis of mucormycosis

Affiliations

Mucoricin is a ricin-like toxin that is critical for the pathogenesis of mucormycosis

Sameh S M Soliman et al. Nat Microbiol. 2021 Mar.

Abstract

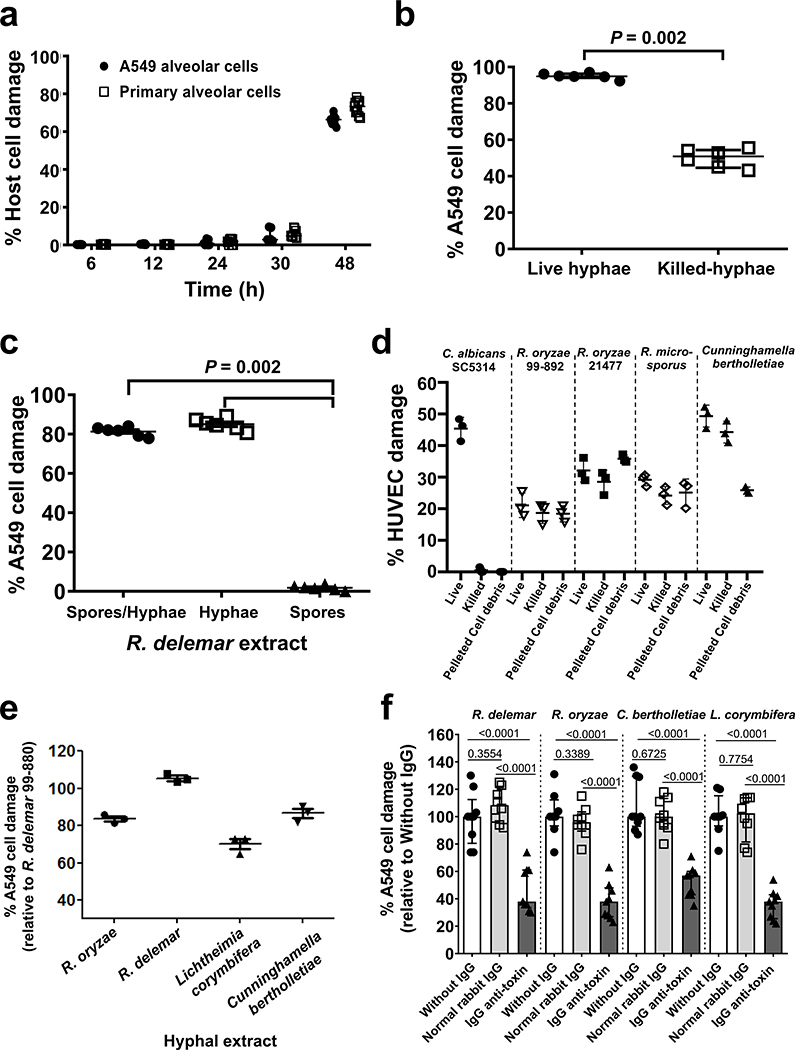
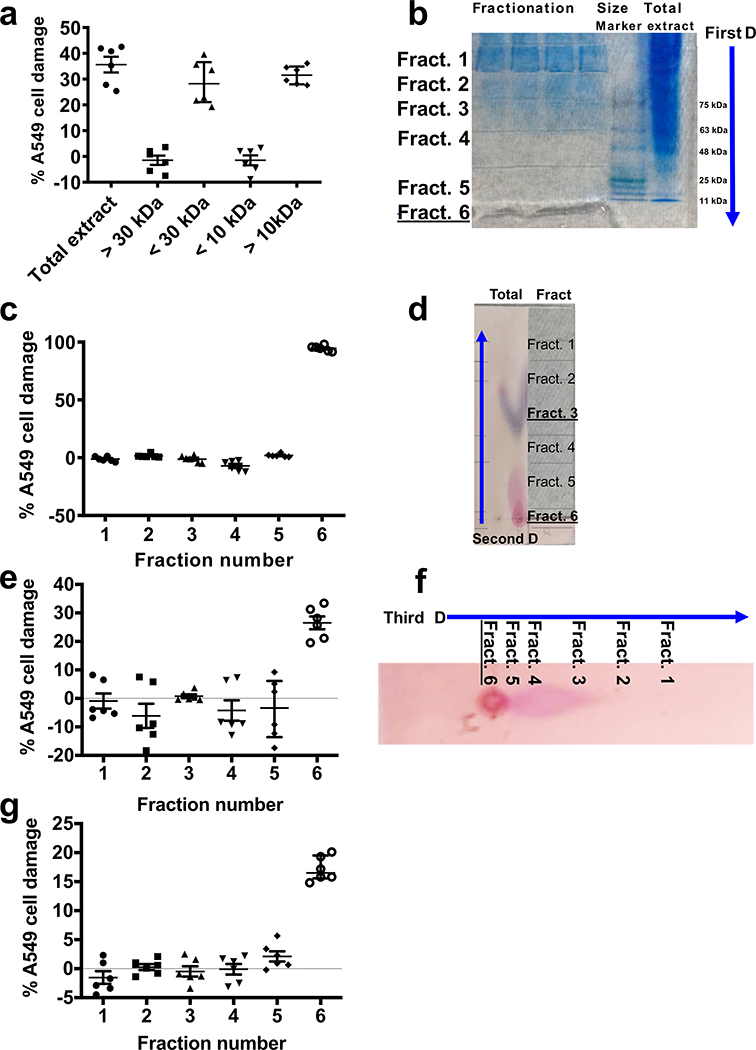
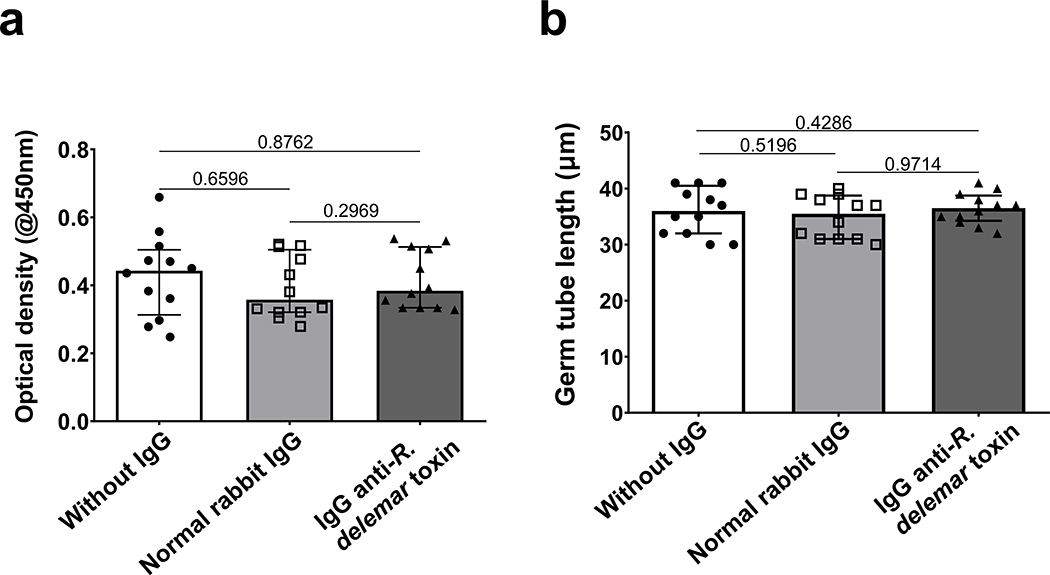
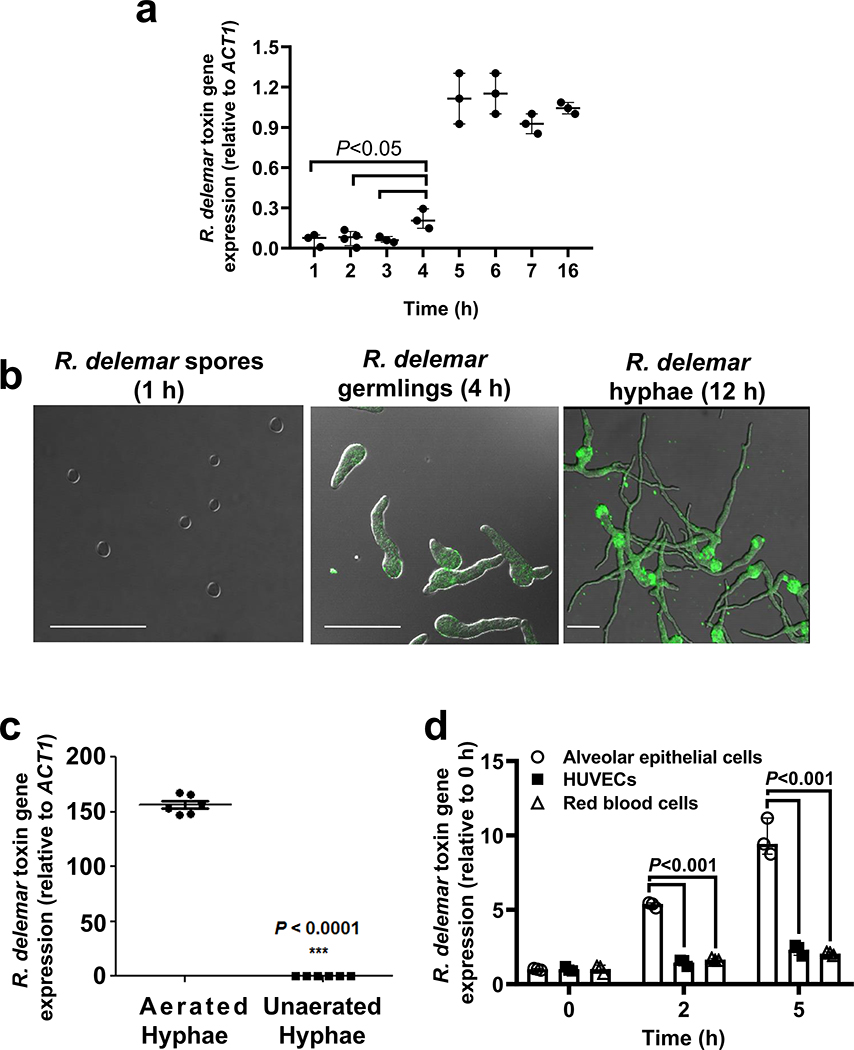
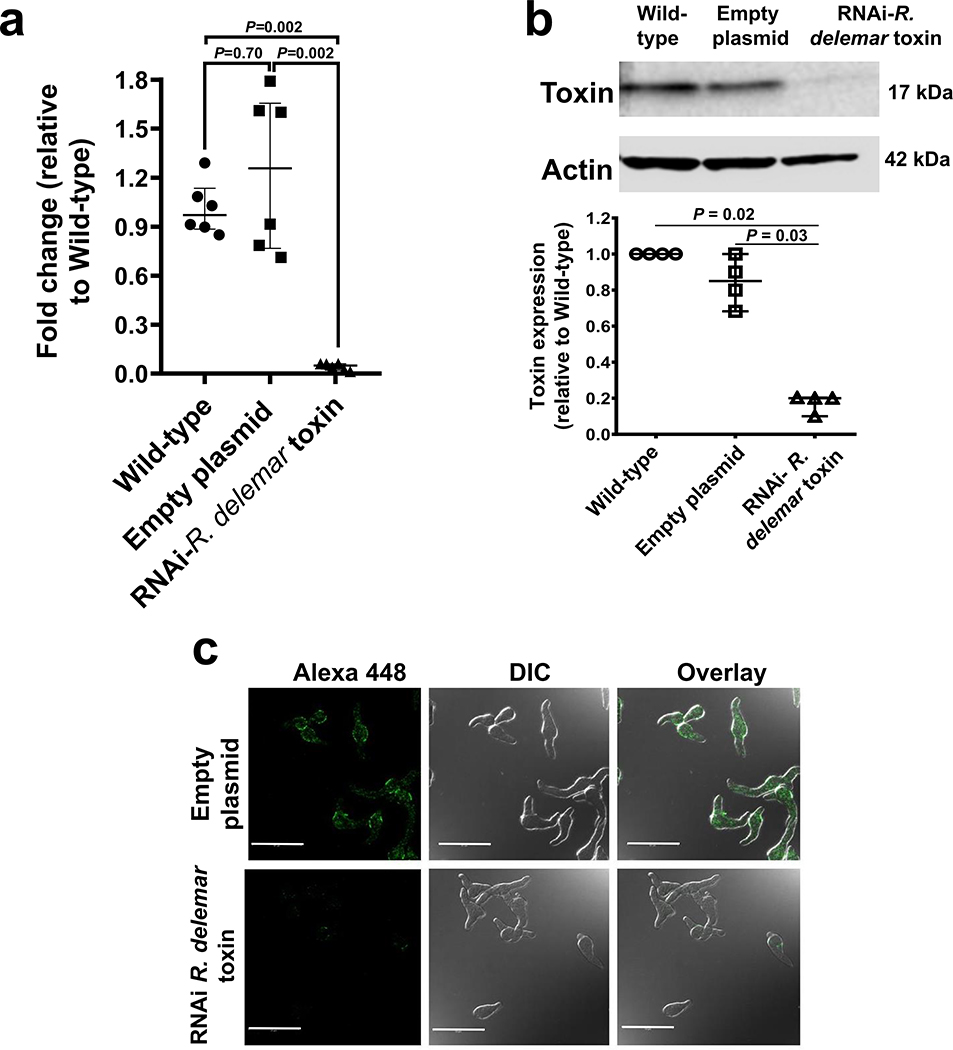
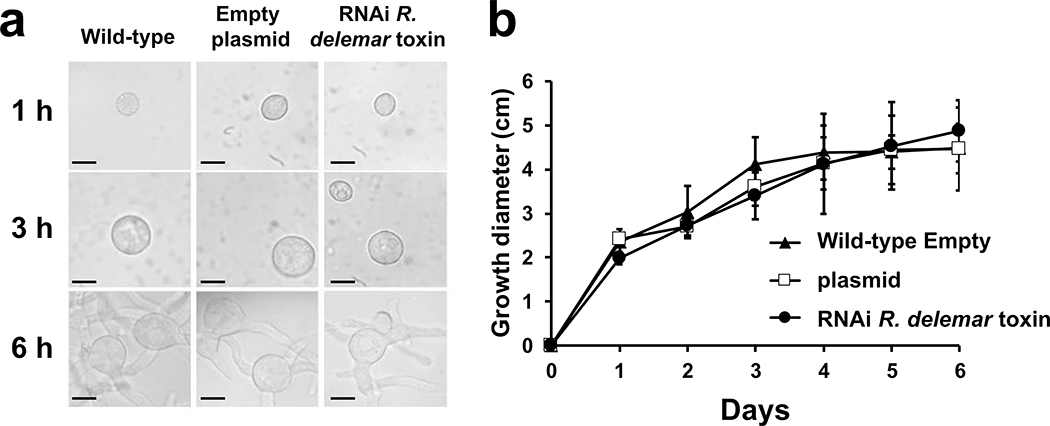
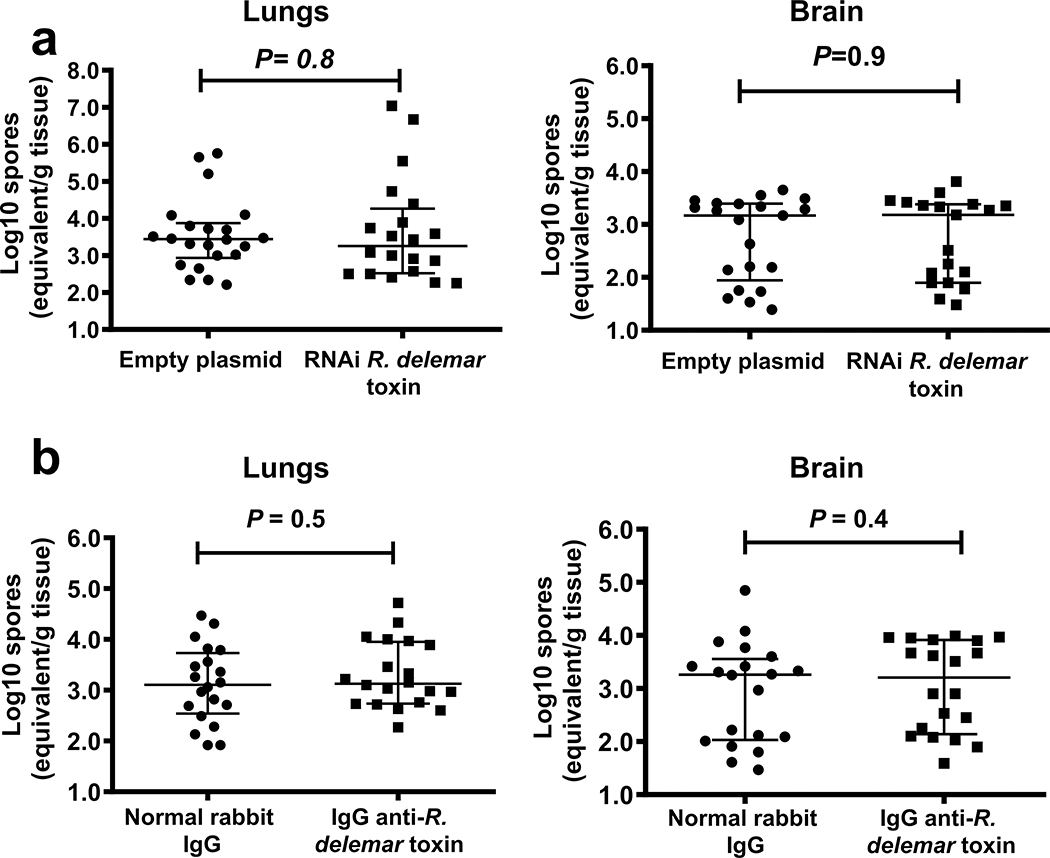
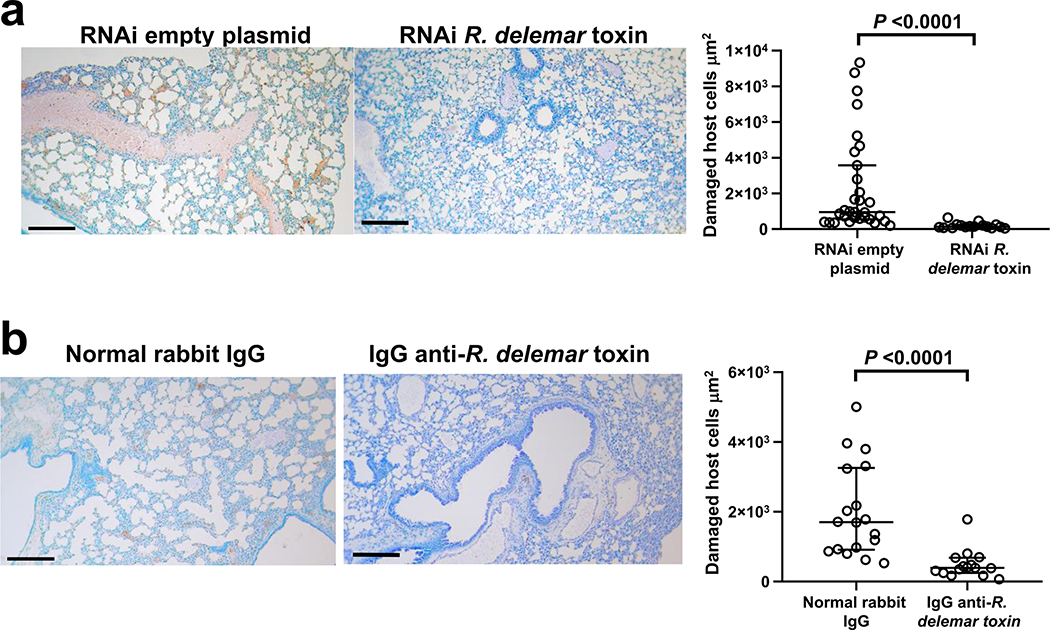
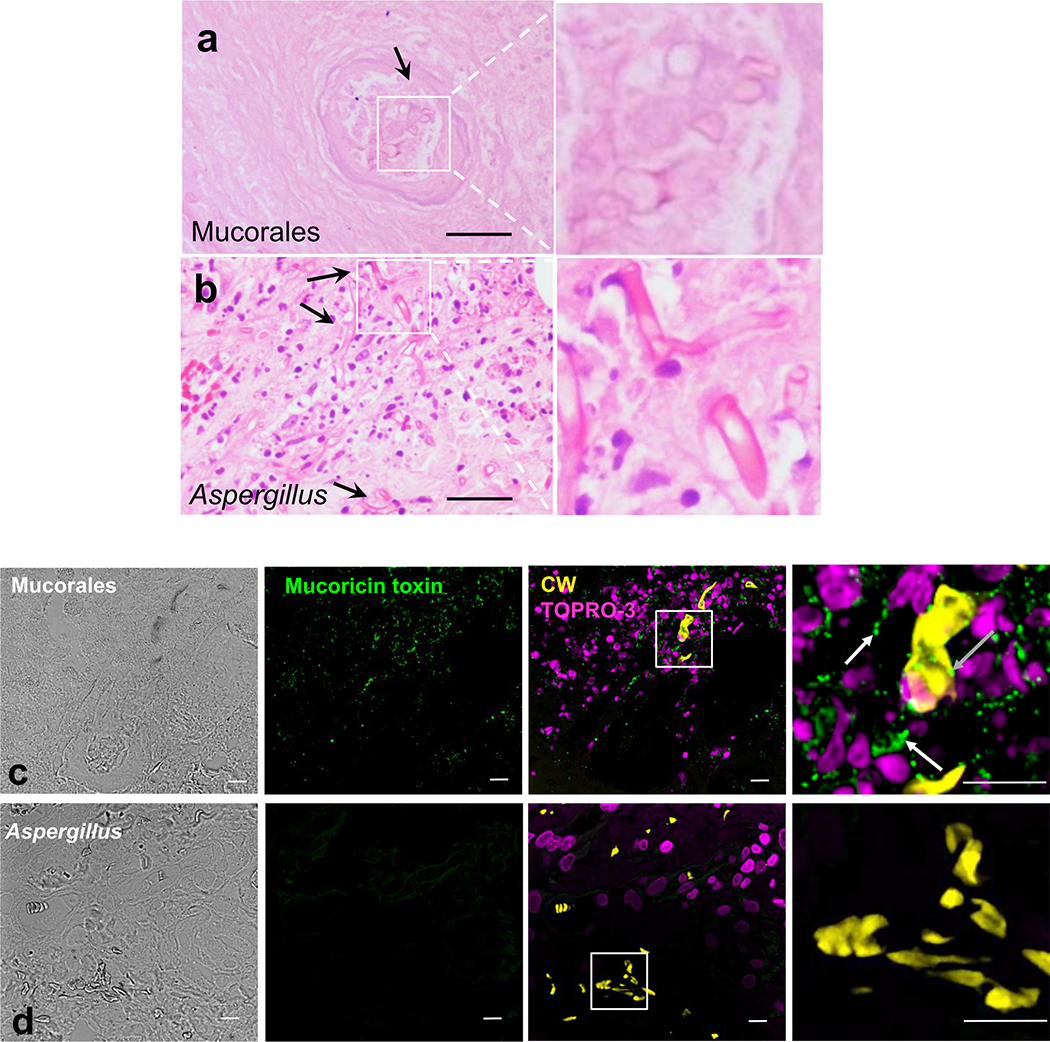
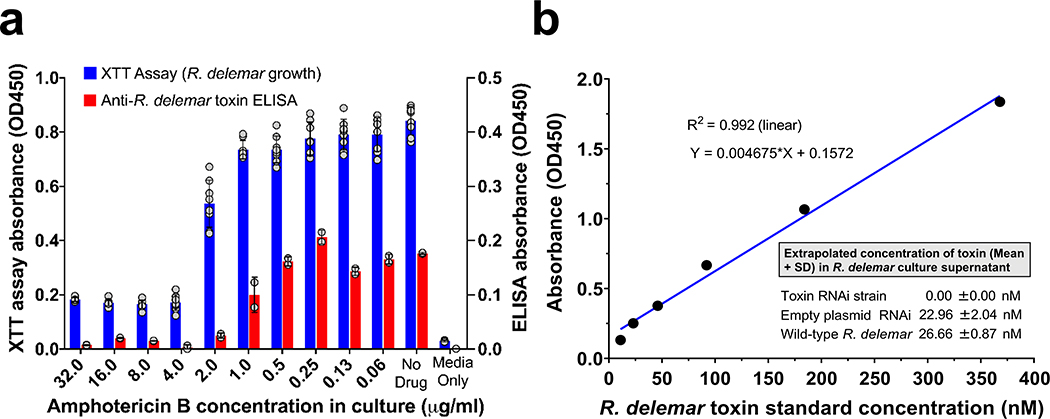
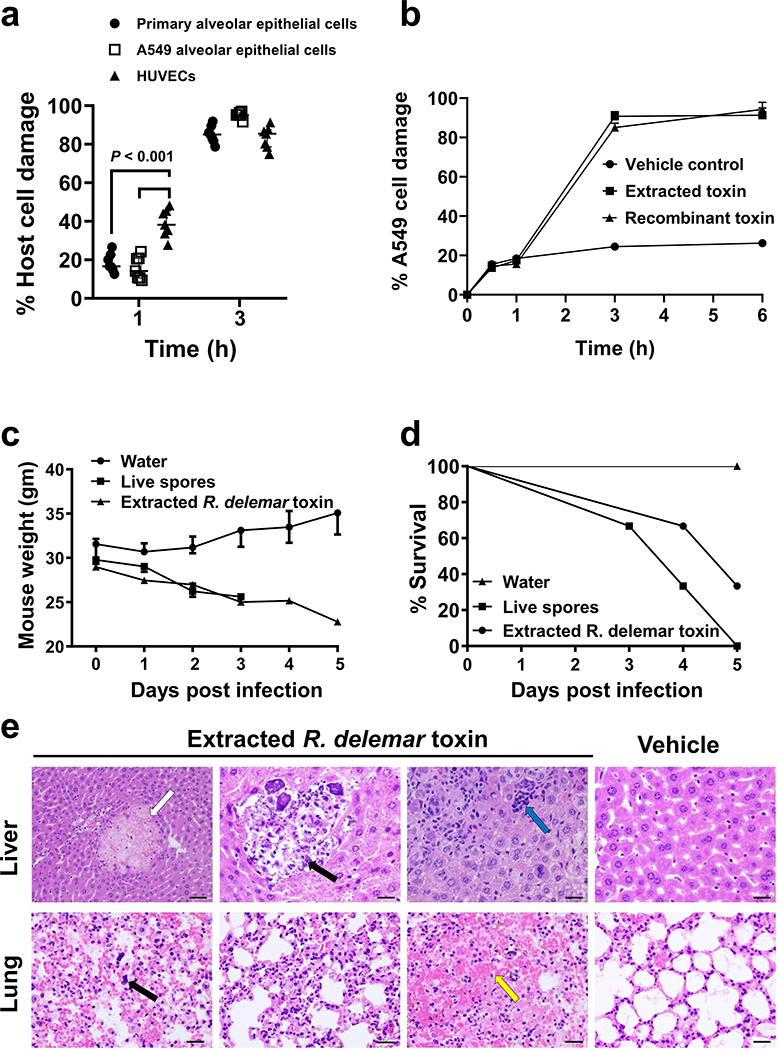
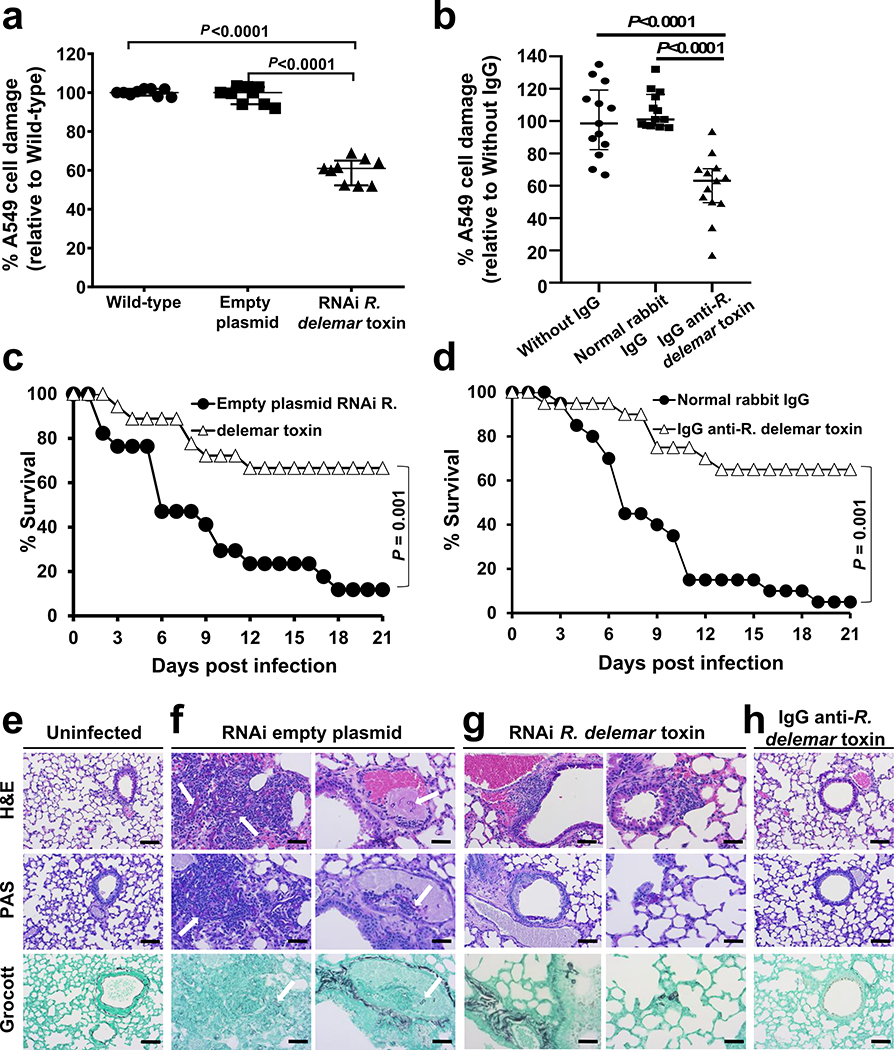
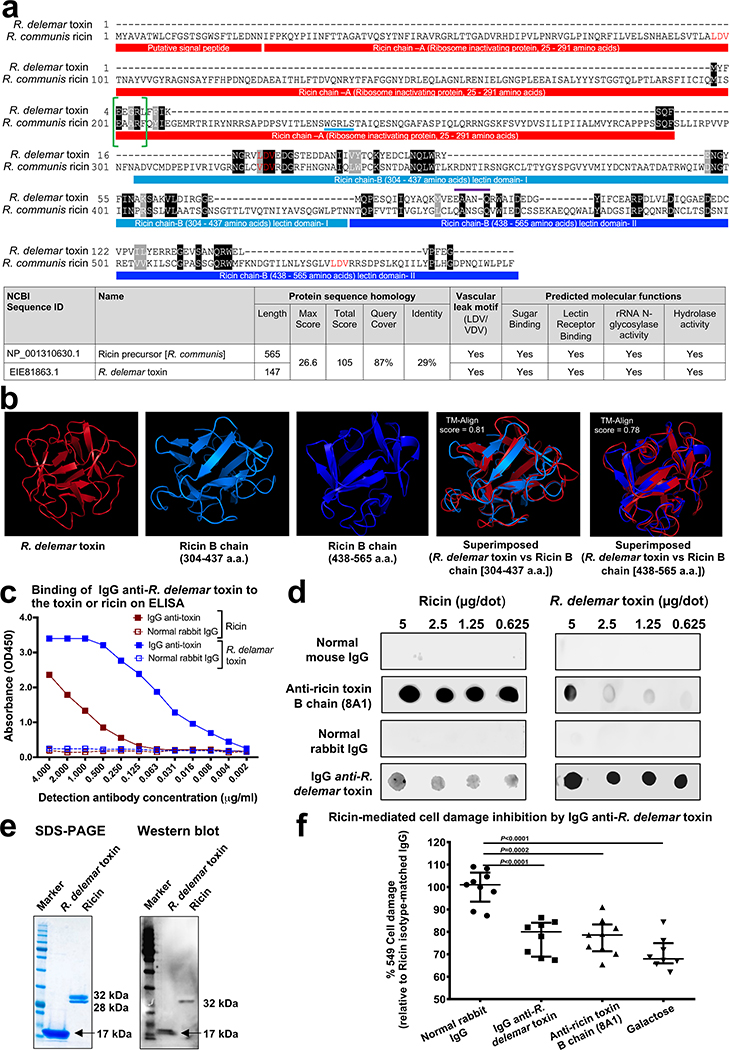
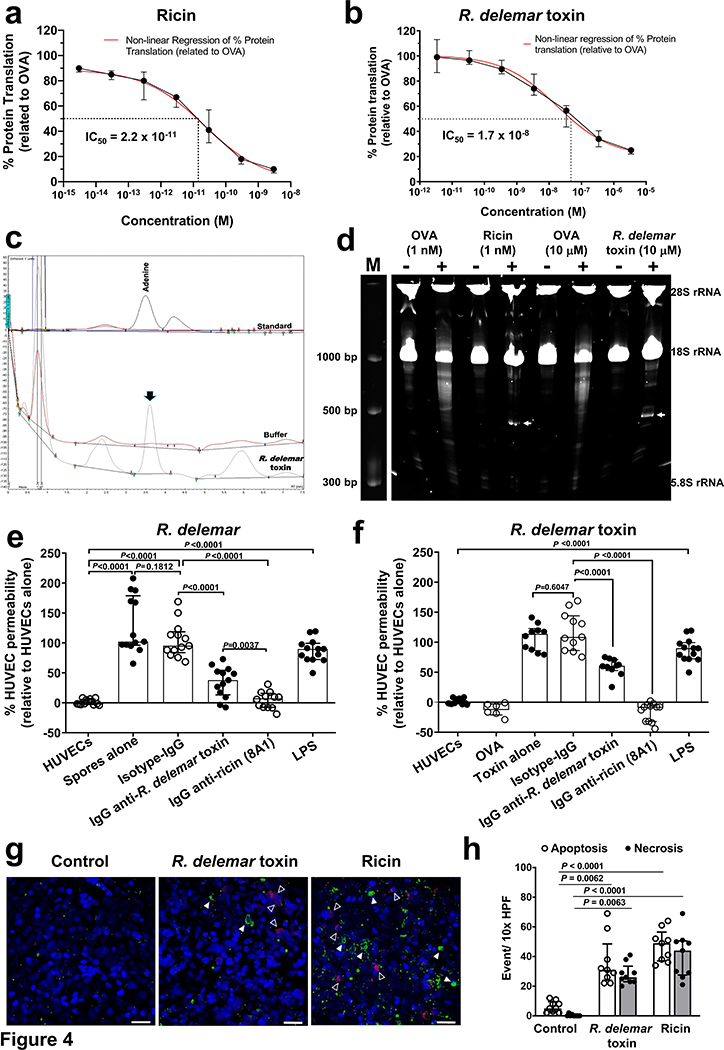
Fungi of the order Mucorales cause mucormycosis, a lethal infection with an incompletely understood pathogenesis. We demonstrate that Mucorales fungi produce a toxin, which plays a central role in virulence. Polyclonal antibodies against this toxin inhibit its ability to damage human cells in vitro and prevent hypovolemic shock, organ necrosis and death in mice with mucormycosis. Inhibition of the toxin in Rhizopus delemar through RNA interference compromises the ability of the fungus to damage host cells and attenuates virulence in mice. This 17 kDa toxin has structural and functional features of the plant toxin ricin, including the ability to inhibit protein synthesis through its N-glycosylase activity, the existence of a motif that mediates vascular leak and a lectin sequence. Antibodies against the toxin inhibit R. delemar- or toxin-mediated vascular permeability in vitro and cross react with ricin. A monoclonal anti-ricin B chain antibody binds to the toxin and also inhibits its ability to cause vascular permeability. Therefore, we propose the name 'mucoricin' for this toxin. Not only is mucoricin important in the pathogenesis of mucormycosis but our data suggest that a ricin-like toxin is produced by organisms beyond the plant and bacterial kingdoms. Importantly, mucoricin should be a promising therapeutic target.


Figures

Extended Data Fig. 1
Extended Data Fig. 1. A heat stable and hyphae-associated Mucorales extract damages mammalian host cells in vitro.
(a) R. delemar caused time dependent alveolar epithelial cell damage (n=9 wells/time point, pooled from three independent experiments). Data are median ± interquartile range. (b) Heat-killed R. delemar hyphae showed ~50% damage to mammalian cells compared to ~100% damage caused by living hyphae (n=6 wells/group, pooled from three independent experiments). Data are median ± interquartile range. Statistical analysis was performed by using Mann-Whitney non-parametric (two-tailed) test comparing live vs killed hyphae. (c) Extracts from comparable wet weight of R. delemar hyphae/spores, or hyphae, but not spores, damaged alveolar epithelial cells (n=6 wells/group, pooled from three independent experiments). Data are median ± interquartile range. Statistical analysis was performed by using Mann-Whitney non-parametric (two-tailed) test comparing spores vs spore/hyphae or hyphae. (d) Disrupted pellet from Mucorales germlings containing the cell-associated fraction was compared to live or heat-killed cells in causing injury to HUVECs (n= 3 wells/group, pooled from three independent experiments). Data are median ± interquartile range. (e) Fungal hyphae from representative clinical Mucorales isolates ground in liquid nitrogen and extracted with mammalian cell culture caused significant A549 alveolar epithelial cell damage (n= 3 wells/Mucorales, pooled from three independent experiments). Data are median ± interquartile range. (f) IgG anti-R. delemar toxin but not normal rabbit IgG (50 μg/ml) blocked host cell damage caused by heat-killed hyphae from different Mucorales (n=8 or 9 replicates/treatment/Mucorales, pooled from three independent experiments). Data presented as median ± interquartile range. Statistical analysis was performed by Mann-Whitney non-parametric (two-tailed) test comparing IgG anti-toxin vs. without IgG or normal rabbit IgG.
Extended Data Fig. 2
Extended Data Fig. 2. Fractionation and purification of R. delemar toxin.
(a) Size exclusion of hyphae extracts indicating a 10–30 kDa fraction causing A549 cell damage (n=6 wells/fraction, pooled from three independent experiments). Data are median ± interquartile range. (b) Native polyacrylamide fractionation of hyphae extract and (c) its corresponding A549 cell damage, showing fraction # 6 causing injury. (n=6 wells/fraction, pooled from three independent experiments). Data are median ± interquartile range. (d) Cellulose plate separation of fraction # 6 purified from the polyacrylamide gel and (e) its corresponding A 549 cell damage, showing a high polar fraction #6 causing injury. Data are n=6 wells/fraction, and pooled from three independent experiments. Data are median ± interquartile range. (f) Third dimension fractionation of the previous fraction # 6 on cellulose plates and (g) its corresponding A549 cell injury (n=6 wells/fraction, pooled from three independent experiments). Data are median ± interquartile range.
Extended Data Fig. 3
Extended Data Fig. 3. IgG anti-toxin had no effect on growth or germination of R. delemar.
(a) Fungal spores (104/ml) were inoculated in 96-well plates with or without 50 μg/ml IgG anti-toxin or normal rabbit IgG for 6 h prior to measuring absorbance at 450 nm. (n=12 wells, data pooled from three independent experiments) Data presented as median + interquartile range. Statistical analysis was performed by Mann-Whitney non-parametric (two-tailed). (b) R. delemar spores (104/ml) were germinated at 37oC for 6 h prior to measuring the germ tube length using light microscopy equipped with a micometer lens. Each data point represents 20–50 germ tubes/HPF. (n=12 wells, data pooled from three independent experiments) Data presented as median + interquartile range from three experiments. Statistical analysis was performed by Mann-Whitney non-parametric (two-tailed).
Extended Data Fig. 4
Extended Data Fig. 4. Putative toxin gene expression is cell-, time- and oxygen-dependent.
(a) Toxin gene expression in R. delemar germinating cells in YPD medium. Data (n=3 wells/timepoint, pooled from three independent experiments) are presented as median ± interquartile range. Statistical analysis was performed by using unpaired t-test (two-tailed). (b) Confocal imaging of Alexa Flour 488-labelled IgG anti-toxin (green) during the growth of R. delemar from spores to hyphae. Scale bar is 50 μm. (c) Toxin gene expression from R. delemar hyphae grown in YPD culture in sufficient versus limited oxygen (n=6 wells, data pooled from three independent experiments). Data presented as median ± interquartile range. Statistical analysis was performed by using unpaired t-test (two-tailed). (d) Toxin gene expression analysis of fungal germlings on different cell types showed a time dependent expression on alveolar epithelial cells compared to HUVECs and erythrocytes (n=3 wells/group, pooled from three independent experiments). Data presented as median ± interquartile range. Statistical analysis was performed by using unpaired t-test (two-tailed).
Extended Data Fig. 5
Extended Data Fig. 5. RNAi targeting the putative R. delemar toxin inhibits its expression.
(a) R. delemar spores were transformed with RNAi plasmids targeting the putative toxin (RNAi-toxin) or empty plasmid (Empty-plasmid) using biolistic delivery system. Cells were grown in minimal medium without uracil for 24 h prior to extracting RNA (n=6/group, pooled from three independent experiments). Data presented as median ± interquartile range. Statistical analysis was performed by using Mann-Whitney non-parametric (two-tailed) test comparing RNAi- R. delemar toxin vs wild-type or empty plasmid (b) Representative Western blot and densitometry analyses of the wild-type, empty plasmid, or RNAi toxin strains (n=4 pictures data pooled from four independent experiments) Data presented as median ± interquartile range. Statistical analysis was performed by using Mann-Whitney non-parametric (two-tailed) test comparing RNAi- R. delemar toxin vs. wild-type or empty plasmid. (c) confocal images showing reduced expression of the toxin in the RNAi toxin mutant. Scale bar is 50 μm.
Extended Data Fig. 6
Extended Data Fig. 6. Down regulation of R. delemar toxin by RNAi did not affect germination or the growth of the fungus.
(a) Wild-type R. delemar, RNAi empty plasmid, or RNAi toxin strains were germinated in minimal medium without uracil at 37oC with shaking. At times, samples were taken from the medium and examined by light microscopy. Scale bar is 5 μm. (b) 105 spores of wild-type R. delemar, RNAi empty plasmid, or RNAi toxin strains were plated in the middle of the minimal medium without uracil agar plates for several days at 37oC and the colony diameter measured (n=6 plates/group, pooled from three independent experiments). Data are presented as median ± interquartile range.
Extended Data Fig. 7
Extended Data Fig. 7. Effect of blocking the expression or the function of R. delemar toxin on fungal burdens in mice.
(a) Inhibition of the toxin by RNAi did not affect the fungal burden in the lungs or brain of mice harvested on Day +4 post infection (average inoculum from two experiments of 1.4 × 10⁴ for empty plasmid [n=22 mice] vs. 1.3 × 10⁴ for RNAi toxin mutants [n=20 mice]). Data are pooled from two independent experiments and presented as median ± interquartile range. Statistical analysis was performed by using Mann-Whitney non-parametric (two-tailed) test comparing RNAi-R.delemar toxin vs. Empty plasmid. (b) The IgG anti-R. delemar toxin had no effect on the fungal burden of lungs or brains of DKA mice harvested on Day +4 post intratracheal infection with wild-type R. delemar (average inhaled inoculum of 5.6 × 10³ spores from two experiments [n=20 mice]). Data are pooled from two independent experiments and presented as median ± interquartile range). Statistical analysis was performed by using Mann-Whitney non-parametric (two-tailed) test comparing IgG anti-R.delemar toxin vs. normal rabbit IgG.
Extended Data Fig. 8
Extended Data Fig. 8. Histology of organs showing involvement of the toxin in tissue damage.
(a) Damaged lung tissues (brown color) of mice infected with R. delemar transformed with RNAi empty plasmid (n=31 field counts) or RNAi toxin. Statistical analysis was performed by using Mann-Whitney non-parametric (two-tailed) test. Scale bar is 200 μm. (b) Damaged lung tissues from mice infected with wild-type R. delemar and treated with either normal rabbit IgG (n= 18 field counts) or IgG anti-toxin (n= 18 field counts) were quantified by ApopTag kit. Data were pooled from two independent experiments, are presented as median + interquartile range. Statistical analysis was performed by using Mann-Whitney non-parametric (two-tailed) test. Scale bar is 200 μm.
Extended Data Fig. 9
Extended Data Fig. 9. R. delemar toxin is expressed in lung tissue collected from a mucormycosis patient but not in lung samples from an aspergillosis patient.
H&E staining of lung tissues from mucormycosis (a) or aspergillosis (b) patients showing broad aseptate hyphae with angioinvasion (Mucorales) and thinner septated hyphae of Aspergillus. Scale bar is 10 μm. Box magnification 1400 X. Staining of a mucormycosis (c) or aspergillosis (d) patient lungs using IgG anti-toxin (green color). Mucorales or Aspergillus hyphae are shown in yellow (stained with calcofluor white) and nuclei are shown in magenta. R. delemar toxin staining is shown in association with hyphae (grey arrow) and released in the tissue (white arrow). Scale bar is 10 μm in all micrographs.
Extended Data Fig. 10
Extended Data Fig. 10. Secretion/shedding of R. delemar toxin in culture supernatant of growth media.
(a) Cell-free culture supernatants were collected from R. delemar hyphae grown in the presence or absence of 2-fold dilutions of amphotericin B. The XTT assay was used to determine growth of R. delemar (left axis, blue bar, n=8 wells/amphotericin B concentration), while toxin release assayed by sandwich ELISA using anti-R. delemar mouse monoclonal IgG1 as the capture antibody and rabbit anti-R. delemar toxin IgG as the detector antibody (right axis, red bar, n=2 wells/amphotericin B concentration). Data in are representative of three independent experiments and presented as mean ± SD. (b) The released toxin concentration from R. delemar wild-type, R. delemar transformed with empty plasmid RNAi or R. delemar with RNAi-toxin was extrapolated from a standard curve using recombinant toxin in the same ELISA assay. Toxin concentrations (n= 3 samples from three independent experiments tested in duplicate in ELISA for each strain) are presented as mean ± SD.
Figure 1.
Figure 1.. R. delemar toxin is sufficient to cause damage in vitro and in vivo.
(a) The effect of toxin on different cell lines (n=7 wells /time point pooled from three independent experiments). Data are median ± interquartile range. Statistical analysis was performed by using the non-parametric Mann-Whitney (two-tailed) test comparing HUVECs vs. primary alveolar epithelial cells or A549 alveolar cells. (b) Damage of extracted or recombinant toxin (~ 500 μg/ml or 29.4 μM) on epithelial cells at different time points (n=3 wells/time point). Data are representative of three independent experiments and presented as median ± interquartile range. (c) Mouse (n=3 mice/group) weight loss (data are median ± interquartile range) and (d) percent survival (n=3 mice/group) following intravenous injection with 0.1 mg/ml (5.9 μM) toxin QOD × 3. (e) Mouse organ H&E histomicrographs showing the effects of the toxin. Livers showed necrosis (white arrow), infiltration and calcification of PMNs (black arrow) due to inflammation and a cluster of mononuclear cells (cyan arrow). Lungs showed megakaryocytes (black arrow) and hemorrhage (yellow arrow). Data in each group are representative of 2 mice. Scale bar 50 μm for first liver micrograph and 100 μm for all other. For lung micrographs scale bar 50 μm.
Figure 2.
Figure 2.. Inhibition of R. delemar toxin attenuates virulence of R. delemar.
(a) RNAi toxin shows reduced damage to A549 cells compared to wild type or empty plasmid R. delamar (n=6 wells/group pooled from three independent experiments). Data are median ± interquartile range. Statistical comparisons are by the non-parametric Mann-Whitney (two-tailed) test. (b) IgG anti-toxin antibodies reduced R. delemar-induced injury of A549 cells compared to R. delamar without IgG or normal rabbit IgG (n = 13 wells/group pooled from three independent experiments). Data are median ± interquartile range. Statistical comparisons are by the non-parametric Mann-Whitney (two-tailed) test. (c) RNAi toxin inhibition prolonged survival of mice (n= 18 mice) compared to R. delamar with empty plasmid (n= 17 mice). Data were pooled from two independent experiments. Survival data were analyzed by Log-rank (Mantel-Cox) test. (d) IgG anti-toxin prolonged survival of mice compared to normal rabbit IgG (n=20 mice/group). Data were pooled from two independent experiments. Survival data were analyzed by Log-rank (Mantel-Cox) test. (e) Histopathological sections of lungs from uninfected mice, (f) mice infected with the RNAi empty plasmid R. delemar strain showed hyphae and granulocyte infiltration (left panel, arrows) and angioinvasion (right panel, arrow), vs. (g) mild signs of inflammation and no angioinvasion for mice infected with RNAi toxin. (h) IgG anti-toxin group had normal lung tissue architecture. Data in e-h are representative of 3 mice and scale bar is 20 μm.
Figure 3.
Figure 3.. R. delemar toxin and ricin share structural features.
(a) R. delemar toxin has 29% amino acid sequence identity with ricin. Both toxins share similar motifs and molecular functions. (b) 3-D structure model of R. delemar toxin shows similarities to ricin B chain. Protein 3D structure models of R. delamar toxin and ricin chain B (amino acids 304–437, and 338–565) were aligned residue-to-residue based on structural similarity using heuristic dynamic programming iterations and sequence independent TM-align score (0–1) were calculated based on structural similarity. TM-align score >0.5 considered significant similarity. (c) IgG anti-R. delemar toxin binds to ELISA plates coated with either R. delemar toxin or ricin. (d) Ricin is recognized on a dot blot by IgG anti-R. delemar toxin. (e) Western blot of R. delemar toxin and ricin using IgG anti-R. delemar toxin IgG. (f) IgG anti-R. delemar toxin, IgG anti-ricin (8A1 clone) (10 μg/ml each) or galactose (10 mM) inhibit ricin (77 nM)-mediated A549 cell damage (n=9 wells for normal rabbit IgG and Anti-ricin toxin B chain (8A1) group, n=8 for IgG anti-R. delemar toxin and galactose group pooled from three independent experiments). Data are median ± interquartile range. Statistical comparisons were made by using the non-parametric Mann-Whitney (two-tailed) test.
Figure 4.
Figure 4.. R. delemar toxin and ricin have functional similarities.
(a,b) Cell-free rabbit reticulocyte assay showing protein synthesis inhibition by ricin (IC50 of 2.2 × 10⁻¹¹ M) (a) and R. delemar toxin (IC50 of 1.7 × 10⁻⁸ M) (b). Data (n=7 wells/concentrations for ricin; and n=6 wells/concentration for R. delemar toxin, pooled from three experiments) are presented as median ± interquartile range. (c) Representative HPLC chromatograms demonstrating the depurination activity of R. delemar toxin of A549 RNA at 3.6 min similar to adenine standard. (d) A representative gel (from three experiments) showing rRNA glycosidase activity of R. delemar toxin (1 μM) compared to ricin (1 nM) and control OVA (1 nM or 1 μM). Ribosomes were treated with ricin for 1 h or R. delemar toxin for 4 h. Extracted RNA were treated with (+) or without (−) aniline prior to running the gel. Arrows point to endo fragment at ~500 bp. (e, f) R. delemar induces HUVEC permeability via its toxin. R. delemar (e) or recombinant toxin (2.9 μM) (f) were incubated with HUVEC for 5 h with or without 50 μg/ml of IgG isotype-matched or anti-R. delemar toxin or 10 μg/ml of IgG anti-ricin chain B (clone 8A1). LPS or OVA were added as a positive and negative controls, respectively. For e, n= 13 wells except for IgG anti-ricin 8A1 which n=12 wells pooled from three independent experiments. For f, n= 6 wells for Ova, n=10 wells for R. delamar toxin alone and R. delamar toxin ± IgG anti-R. delmar toxin, n=11 wells for R. delamar toxin ± Isotype IgG, n=12 wells for R. delamar toxin +IgG anti-ricin (8A1), and n=13 wells for HUVECs and LPS. Data in e and f were pooled from three independent experiments and presented as median ± interquartile range. (g) Detection of apoptosis/necrosis of A549 cells incubated for 2 h with 50 μg/ml (2.9 μM) of R. delemar toxin or 5 μg/ml (77 nM) ricin. Apoptotic cells (closed triangle) were identified by green fluorescence while necrotic cells (open triangle) are shown in red. Scale bar is 50 μm. (h) The number of apoptotic and necrotic events per high-power field (HPF) was determined, counting 10 HPF per coverslip. The data is combined from 3 independent experiments with each group in triplicate (total n=9 wells) and presented as median ± interquartile range. Kruskal-wallis test was used to compare control vs. R. delamar toxin or ricin.

References

    1. Gleissner B, Schilling A, Anagnostopolous I, Siehl I & Thiel E Improved outcome of zygomycosis in patients with hematological diseases? Leuk Lymphoma 45, 1351–1360 (2004). - PubMed
    1. Kauffman CA Zygomycosis: reemergence of an old pathogen. Clin Infect Dis 39, 588–590 (2004). - PubMed
    1. Kontoyiannis DP, Wessel VC, Bodey GP & Rolston KV Zygomycosis in the 1990s in a tertiary-care cancer center. Clin Infect Dis 30, 851–856 (2000). - PubMed
    1. Marr KA, Carter RA, Crippa F, Wald A & Corey L Epidemiology and outcome of mould infections in hematopoietic stem cell transplant recipients. Clin Infect Dis 34, 909–917 (2002). - PubMed
    1. Siwek GT et al. Invasive zygomycosis in hematopoietic stem cell transplant recipients receiving voriconazole prophylaxis. Clin Infect Dis 39, 584–587 (2004). - PubMed

Publication types

MeSH terms

Supplementary concepts