. 2021 Feb;22(2):179-192.
doi: 10.1038/s41590-020-00848-3. Epub 2021 Jan 18.

Distinct metabolic programs established in the thymus control effector functions of γδ T cell subsets in tumor microenvironments

Affiliations

Distinct metabolic programs established in the thymus control effector functions of γδ T cell subsets in tumor microenvironments

Noella Lopes et al. Nat Immunol. 2021 Feb.

Abstract

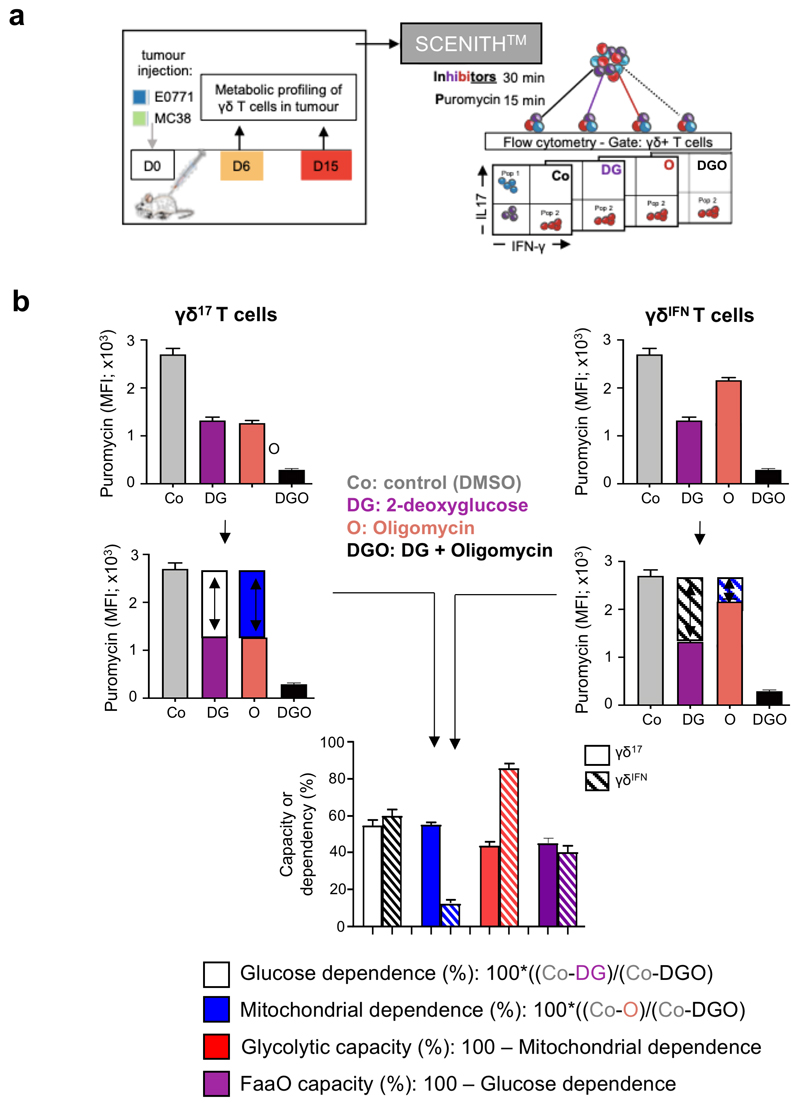
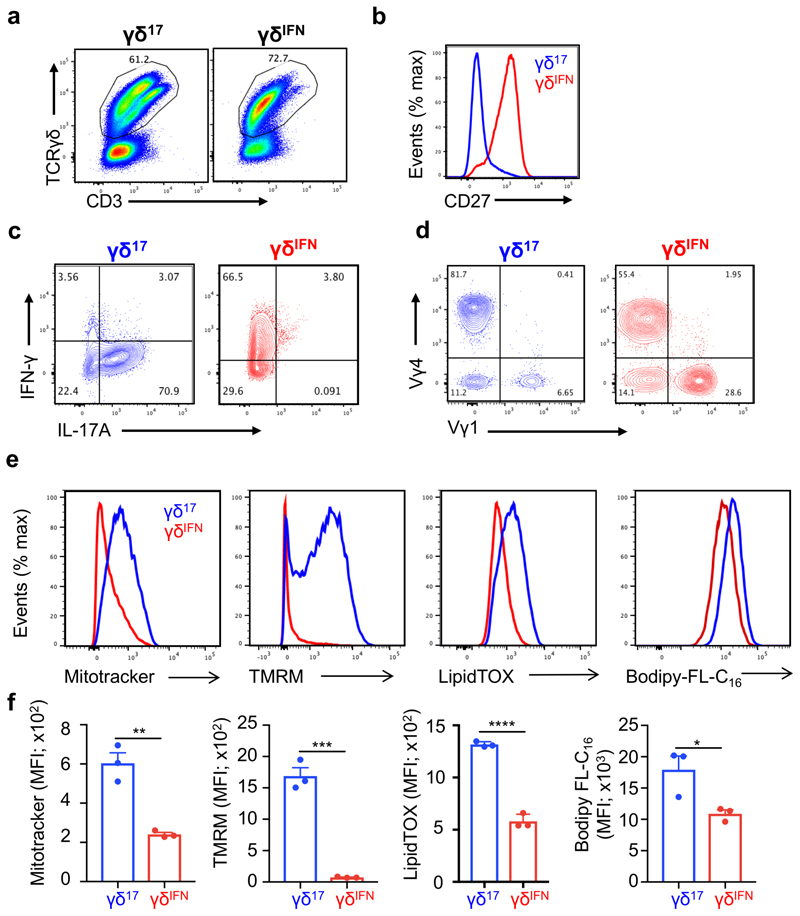
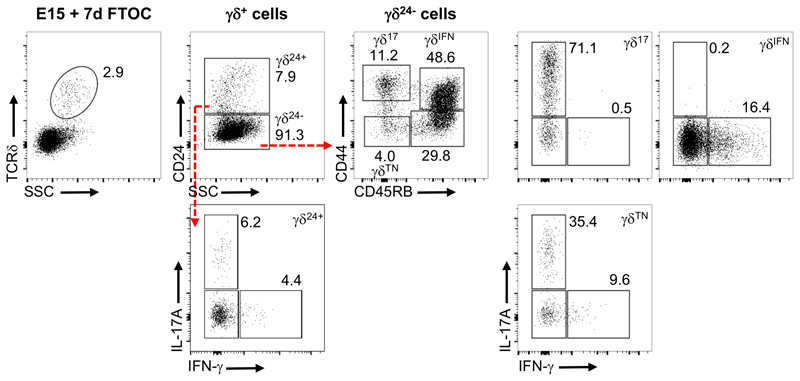
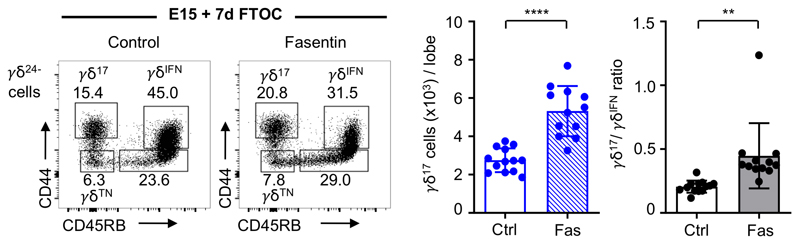
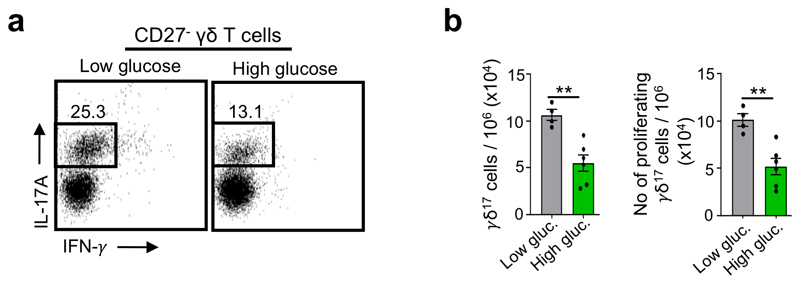
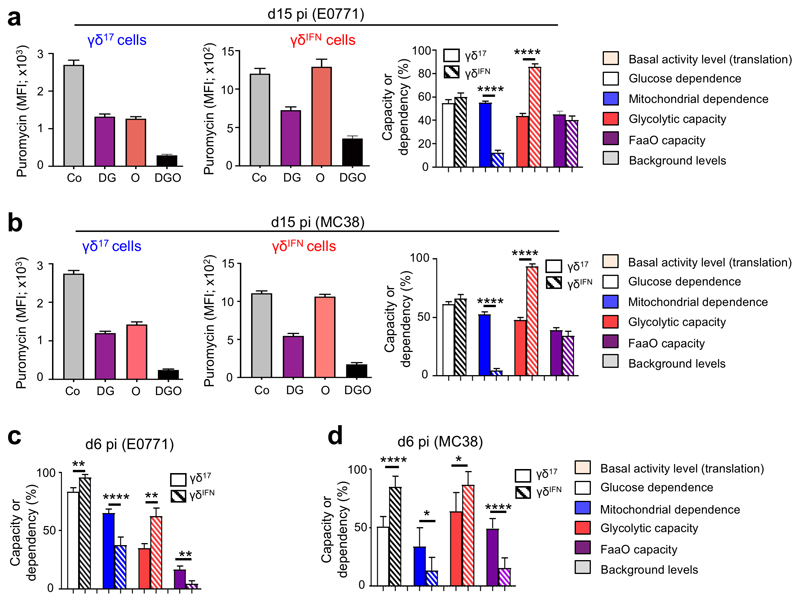
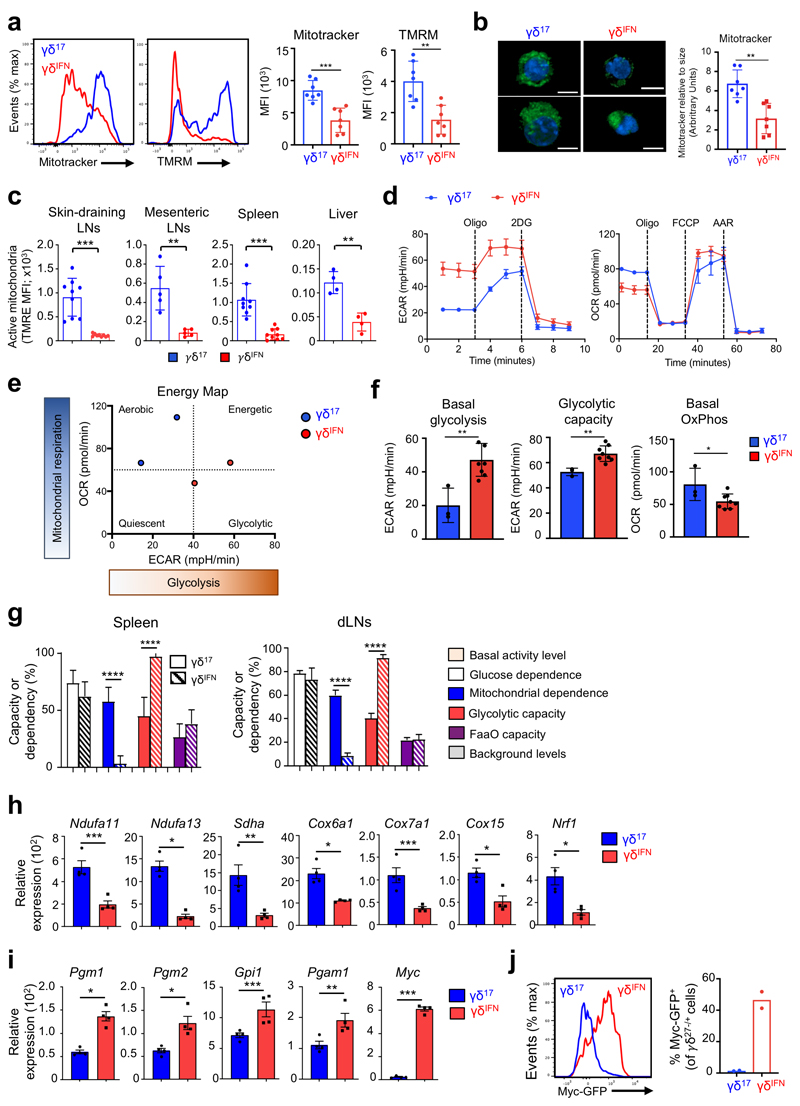
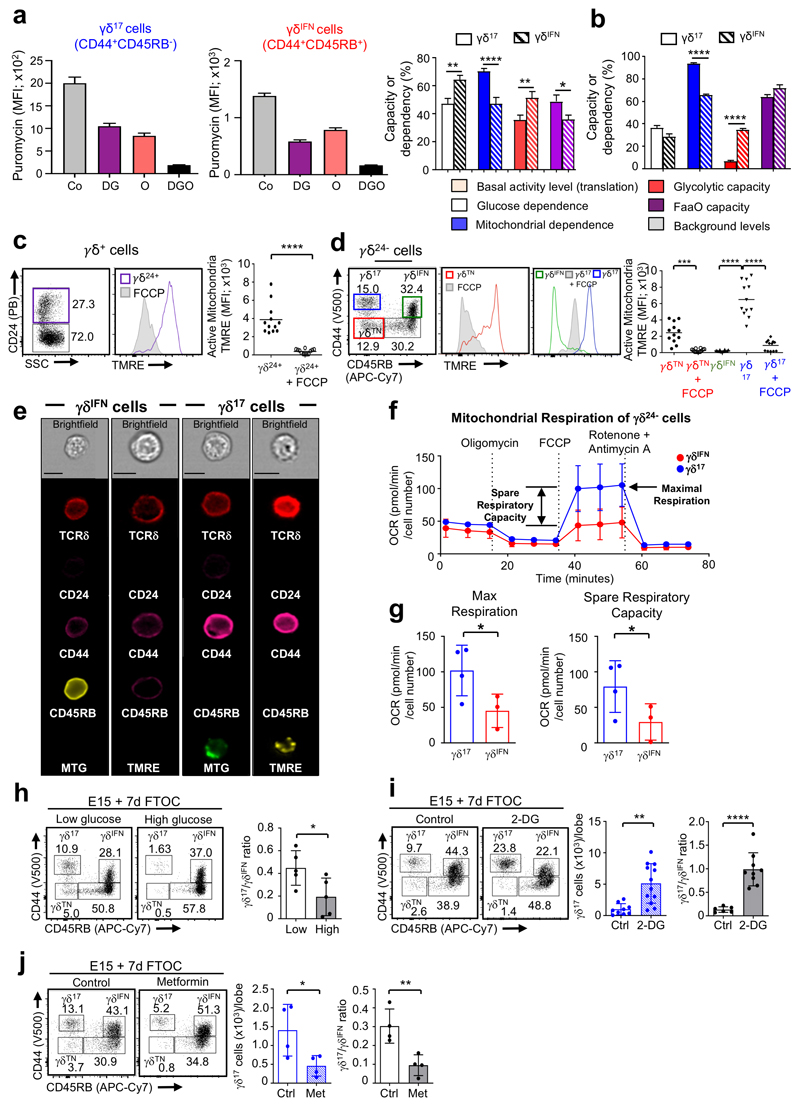
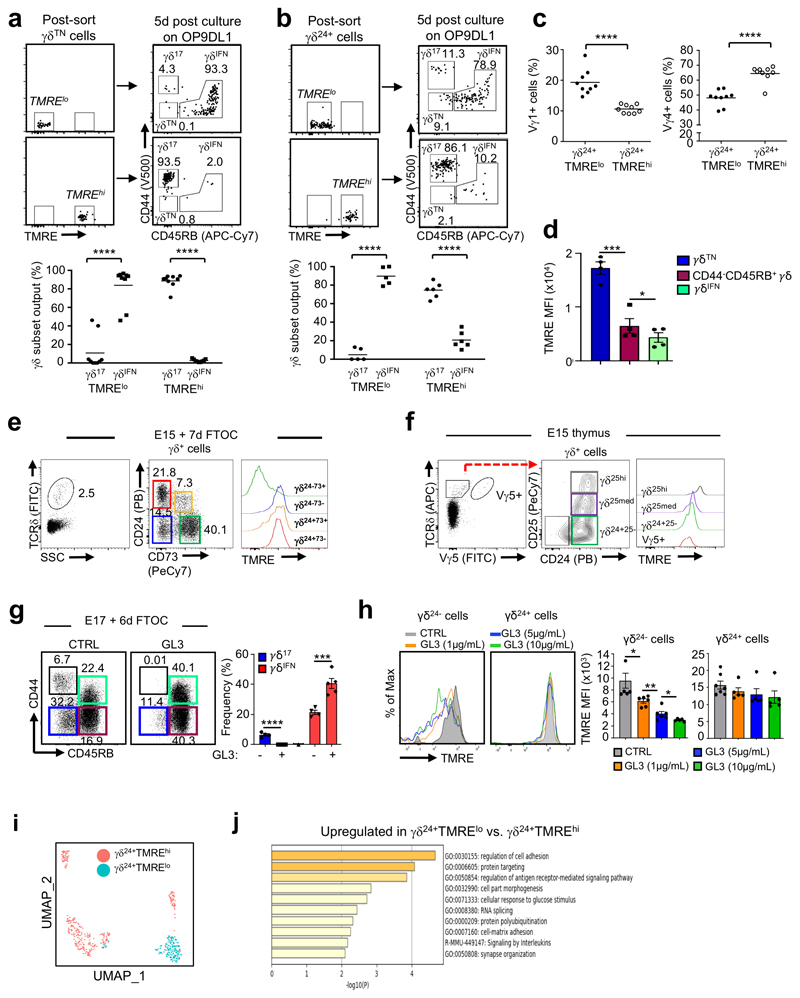
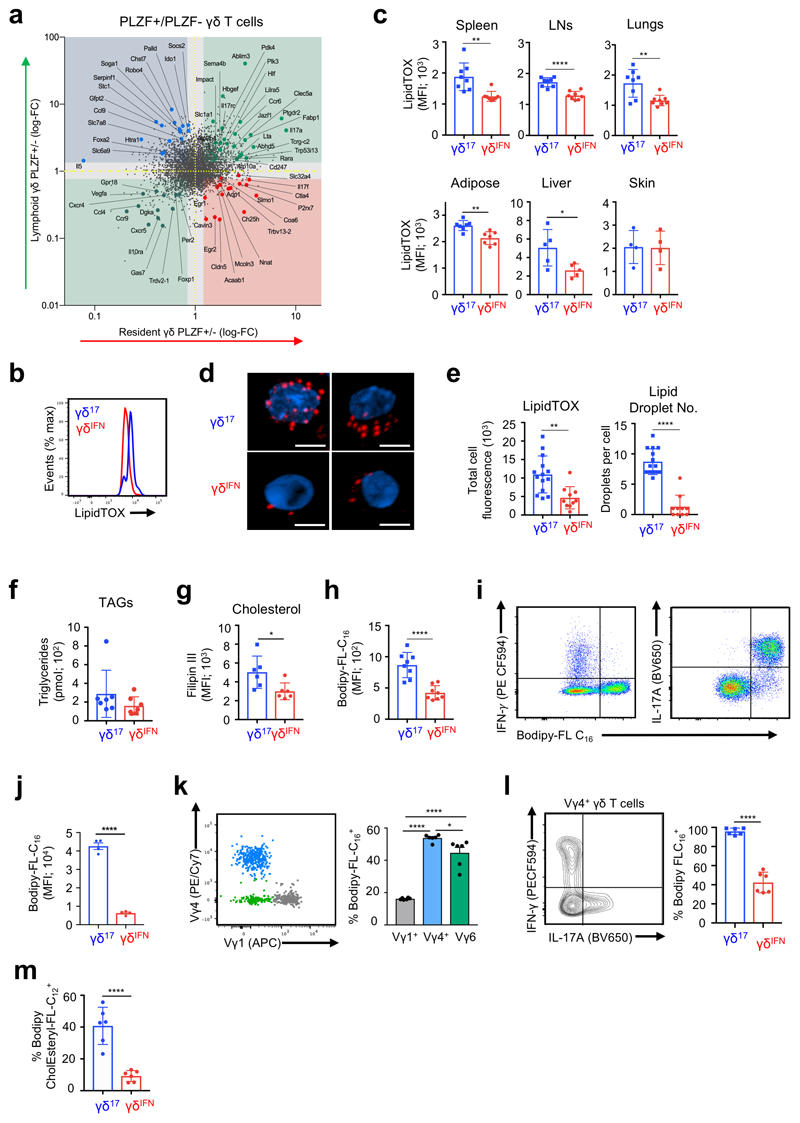
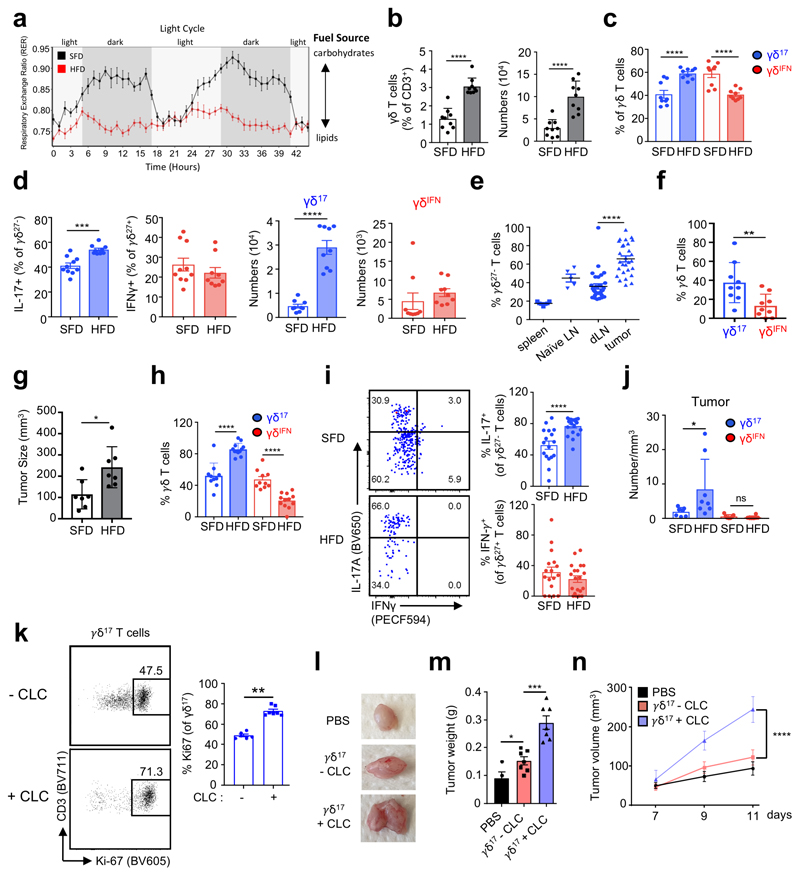
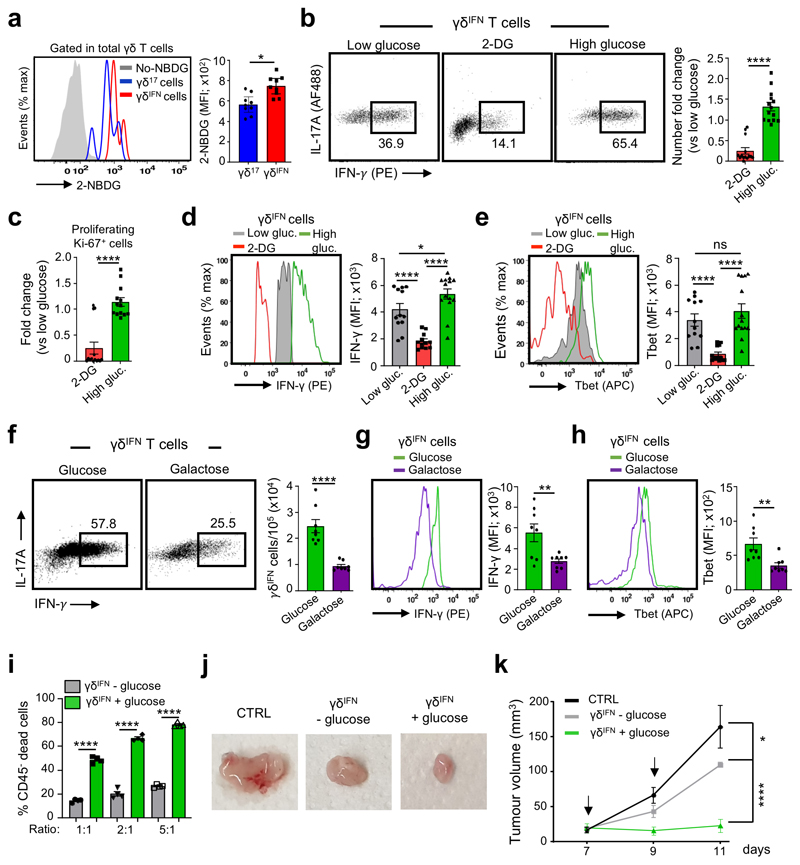
Metabolic programming controls immune cell lineages and functions, but little is known about γδ T cell metabolism. Here, we found that γδ T cell subsets making either interferon-γ (IFN-γ) or interleukin (IL)-17 have intrinsically distinct metabolic requirements. Whereas IFN-γ+ γδ T cells were almost exclusively dependent on glycolysis, IL-17+ γδ T cells strongly engaged oxidative metabolism, with increased mitochondrial mass and activity. These distinct metabolic signatures were surprisingly imprinted early during thymic development and were stably maintained in the periphery and within tumors. Moreover, pro-tumoral IL-17+ γδ T cells selectively showed high lipid uptake and intracellular lipid storage and were expanded in obesity and in tumors of obese mice. Conversely, glucose supplementation enhanced the antitumor functions of IFN-γ+ γδ T cells and reduced tumor growth upon adoptive transfer. These findings have important implications for the differentiation of effector γδ T cells and their manipulation in cancer immunotherapy.


Conflict of interest statement

Competing interests

B.S.-S. is an inventor of the patented “Delta One T cell” technology, which has been acquired by GammaDelta Therapeutics (London, UK).

Figures

Extended Data Fig. 1
Extended Data Fig. 1. SCENITH™ methodology for analysis of cell metabolism
(a) Experimental design: E0771 breast or MC38 colon cancer cell lines were injected in WT mice; 6 and 15 days later, tumors were extracted for metabolic analysis of gd T cells using SCENITH™. (b) SCENITH™ assesses the impact of metabolic inhibitors on protein synthesis. Mean fluorescence intensity (MFI) of puromycin is analysed in each condition (Co: control-no inhibition; DG: 2-deoxyglucose inhibiting glycolysis; O: oligomycin inhibiting OXPHOS; and DGO: DG+O inhibitors). Glucose dependence, fatty acid and amino acid oxidation capacity, mitochondrial dependence and glycolytic capacity are calculated as detailed in the Methods and reference #23. Error bars show mean + SEM. Data are representative of 3 independent experiments (n=3 mice in triplicates per group and per experiment).
Extended Data Fig. 2
Extended Data Fig. 2. In vitro expanded γδ17 and γδIFN γδ T cells retain their mitochondrial and lipid phenotypes.
(a) Representative flow plots of CD3 and TCRγδ expression on γδ17 and γδIFN T cells expanded in vitro from total spleen/LN cells. (b) CD27 expression on in vitro expanded γδ17 and γδIFN γδ T cells. (c) IL-17 and IFNγ production by in vitro expanded γδ17 and γδIFN T cells respectively, following activation with PMA/ionomycin. (d) Vγ1 and Vγ4 expression on in vitro expanded γδ17 and γδIFN T cells. (e) Representative staining of in vitro expanded γδ17 and γδIFN T cells for mitotracker, TMRM, lipidTOX and Bodipy-FL-C16. (f) MFI of mitotracker, TMRM, lipidTOX and Bodipy-FL-C16 staining in vitro expanded γδ17 and γδIFN T cells. n=3, data representative of 3 independent experiments. Mitotracker p=0.0026; TMRM p=0.0003; LipidTOX p<0.0001; Bodipy FL-C16 p=0.036. Error bars show mean + SD, **p < 0.01, ***p<0.001, ****p < 0.0001, using two-tailed unpaired Student’s t-test.
Extended Data Fig. 3
Extended Data Fig. 3. γδTN cells can generate γδ17 and γδIFN T cells.
Flow cytometry profiles of thymic γδ T cells from E15 thymic lobes that had been cultured for 7-days in fetal thymic organ culture (E15 + 7dFTOC). CD24+ (γδ24+) precursors downregulate CD24 to become a CD24-CD44-CD45RB- (γδTN) population. γδTN cells are able to become either IL-17-secreting CD44+CD45RB- γδ17 cells, or IFN-γ-producing CD44+CD45RB+ γδIFN cells.
Extended Data Fig. 4
Extended Data Fig. 4. Thymic γδ17 cells are increased upon inhibition of glucose uptake.
Flow cytometry profiles of thymic γδTN (CD44-CD45RB-), γδ17 (CD44+CD45RB-) and γδIFN (CD44+CD45RB+) cells in γδ- cells from E15 thymic lobes in 7-day FTOC with media containing or not Fasentin. Histograms show the number of γδ17 T cells (p<0.0001) and γδ17/γδIFN ratio (p=0.0028). Data are representative of 2 independent experiments (at least 4 lobes pooled per group per experiment). Error bars show mean ± SEM, **p < 0.01, ****p < 0.0001, using two-tailed unpaired Student’s t-test.
Extended Data Fig. 5
Extended Data Fig. 5. Mitochondrial activity identifies Vγ4+ progenitors with distinct effector fates at very early stages.
(a) Flow cytometry plots pre-sort, and after sorted TMRElo and TMREhi Vγ4+γδ24+ cells were cultured for 5-days on OP9DL1 cells. Percentage of thymic γδ17 and γδIFN cells generated are displayed in the graph on right. Data are representative of 3 independent experiments (cells sorted from n = 4 independent mice pooled per group per experiment). (b) Flow cytometry plots for pre- and post-sort TMREhi and TMRElo Vγ4+γδTN cells that were cultured on OP9-DL1 cells for a further 5-days (plots on right). Histogram shows the percentage of each γδ T cell subset generated from cultured TMRElo and TMREhi Vγ4+γδTN cells. Error bars show mean + SD. Data are representative of 2 independent experiments (at least 4 lobes pooled per group per experiment). Error bars show mean ± SD, *p < 0.05, ***p < 0.01, using two-tailed unpaired Student’s t-test.
Extended Data Fig. 6
Extended Data Fig. 6. Distinct mitochondrial activities underlie effector fate of thymic γδ T cell progenitors.
(a) Experimental design for single-cell RNAseq (10x Genomics) on TMRElo and TMREhi gd24+ cells from E15 + 2d FTOC. (b) Heatmap of differentially upregulated genes from comparison of TMRElo and TMREhi gd24+ cells. Genes are grouped in relation to their function in either OxPhos or glucose metabolism.
Extended Data Fig. 7
Extended Data Fig. 7. Enriched lipid metabolism and higher lipid uptake in γδ17 cells
(a) Experimental set up for bulk RNA-sequencing of PLZF+ (gd17) and PLZF (gdIFN) cells isolated from PLZF-GFP (Zbtb16 GFP) mice. (b) LipidTOX MFI in γδ17 (CD27-) and γδIFN (CD27+) T cells from LN cells activated in vitro with IL-1β+IL-23 and IL-12+IL-18 respectively. n=9, data pooled from 3 independent experiments. (c) Representative plots of LipidTOX staining and IL-17A, IL-17F or RORγt expression in γδ- T cells from LNs activated in vitro with IL-1β+IL-23 for 6h. Data representative of 3 independent experiments. (d) Bodipy-FL-C16 MFI in γδ17 (CD27-) and γδIFN (CD27+) T cells T cells unstimulated or stimulated in vitro with IL-12+IL-18 or IL-1β+IL-23.(n=3, data from 1 experiment; γδ17 p= 0.0044; γδIFN p=0.8035). Error bars show mean + SD, **p < 0.01, ***p < 0.001, ****p < 0.0001 using one-way ANOVA.
Extended Data Fig. 8
Extended Data Fig. 8. Inhibition of dietary fat uptake reduces tumour growth and γδ17 cells in the tumour.
B16F10-tumour bearing mice were given daily injections of either vehicle or orlistat on days 6-9, and tumours were analysed on day 10. (a) Percentage body weight following tumor cell injection; arrows indicate when orlistat or vehicle were administered. (b) Tumor volume on days 8-10 following B16F10 inoculation. Absolute numbers (c) and LipidTOX staining (d) of tumor-infiltrating γδ17 cells on day 10. n=8 biologically independent animals, data from 1 independent experiment. Data represents mean + SD, *p<0.06, **p < 0.01 using unpaired Student’s t-test or one-way ANOVA.
Extended Data Fig. 9
Extended Data Fig. 9. Glucose supplementation diminishes γδ17 cell numbers and proliferation.
(a) Flow cytometry profiles of peripheral γδ17 T cells cultured with media containing low (5mM) or high (50mM) doses of glucose. Graph depicts total numbers of γδ17 T cells (p=0.0028). (b) Number of proliferating Ki-67+ γδ17 T cells cultured with low or high glucose (p=0.0034). n=6 biologically independent animals, data from 2 independent experiments. Error bars show mean ± SEM, **p < 0.01, using unpaired two-tailed Student’s t-test.
Figure 1
Figure 1. Intra-tumoral γδ T cell subsets display distinct metabolic profiles.
(a-d) Puromycin MFI of tumour-infiltrating γδ17 and γδIFN T cells extracted from E0771 breast (a,c) and MC38 colon (b,d) tumor-bearing mice analysed using SCENITH™ in; control conditions (Co), or after the addition of 2-deoxy-D-glucose (DG), oligomycin (O) or both inhibitors (DGO). Graphs show the percentage of glucose dependence, mitochondrial dependence, glycolytic capacity and fatty acid and amino acid oxidation (FaaO) capacity of tumor-infiltrating γδ17 and γδIFN cells isolated either 6-days (c: glucose dependence (p=0.0041), mitochondrial dependence (p<0.0001), glycolytic capacity (p=0.0014) and FaaO (p=0.0041); d: glucose dependence (p<0.0001), mitochondrial dependence (p=0.0345), glycolytic capacity (p=0.0189) and FaaO (p<0.0001)) or 15-days (a,b: mitochondrial dependence (p<0.0001), glycolytic capacity (p<0.0001)), after cancer cell line injection. Data are representative of three independent experiments (n=3 mice per group in triplicates in each experiment). pi: post-injection. γδ17 and γδIFN T cells represents IL-17 and IFN-γ-producing γδ T cells, respectively. Error bars show mean ± SEM, *p < 0.05; **p < 0.01; ****<0.0001 using unpaired two-tailed Student’s t-test.
Figure 2
Figure 2. Peripheral γδ T cell subsets show different mitochondrial and metabolic phenotypes.
(a) Representative plots (left) and summary graphs (right) of the MFI of mitotracker and tetramethylrhodamine methyl ester (TMRM) in γδ27– (γδ17) and γδ27+ (γδIFN) T cells ex vivo from LNs of C57BL/6 mice (n=7; data pooled from 2 experiments; Mitotracker p=0.0003; TMRM p=0.0015). (b) Representative confocal images (left) of γδ17 and γδIFN T cells stained with mitotracker (green) and Hoechst 33342 (blue). Scale bar represents 5μM. Analysis of mitotracker staining relative to cell size (right) in γδ17 and γδIFN cells ex vivo. Relative mitotracker was calculated by dividing the MFI of mitotracker by the MFI of FSC-A and multiplying by 100 (n=7, data pooled from 2 independent experiments; p=0.0012). (c) Tetramethylrhodamine ethyl ester (TMRE) MFI of γδ17 and γδIFN T cells from skin draining LNs, mesenteric LNs, spleen and liver of WT mice. Data are representative of 3 independent experiments (n=3 mice per group and experiment; sdLN p=0.0003; mLN p=0.0095; spleen p=0.0001; liver p=0.0016). (d) Seahorse extracellular flux analysis of extracellular acidification rate (ECAR) and oxygen consumption rate (OCR) of γδ17 and γδIFN T cells (expanded in vitro) from LNs (γδ17 n=2, γδIFN n=5, data representative of 3 independent experiments). (e) Energy map showing ECAR vs OCR of γδ17 and γδIFN T cells. Each symbol represents average basal metabolism. (f) Basal glycolytic rate, glycolytic capacity and basal OxPhos of γδ17 (n=3) and γδIFN (n=8) cell subsets (data pooled from 2 independent experiments; basal glycolysis p=0.0029; glycolytic capacity p=0.0042; basal OxPhos p=0.0339). (g) Percentage of glucose dependence, mitochondrial dependence, glycolytic capacity and fatty acid and amino acid oxidation (FaaO) capacity of γδ17 and γδIFN cells from spleen and draining lymph nodes (dLNs). Data are representative of 3 independent experiments (n=3 mice in triplicates per group and per experiment). (h,i) OxPhos-related genes (Ndufa11, p=0.0009; Ndufa13, p=0.0214; Sdha, p=0.0027; Cox6a1, p=0.0235; Cox7a1, p=0.0002; Cox15, p=0.0204; Nrf1, p=0.0248) and glycolysis-related genes (Pgm1, p=0.0226; Pgm2, p=0.0514; Gpi1, p=0.0003; Pgam1, p=0.0018; Myc, p=0.0002) were measured by qPCR in purified γδ17 (n=4) and γδIFN (n=4) cells from spleen and dLN from WT mice. (j) Representative plot (left) and percentages (right) of Myc-GFP+ γδ17 and γδIFN cells from LNs of Myc-GFP reporter mice (n=2). Error bars show mean ± SEM or SD, *p < 0.05; **p < 0.01; ***p < 0.001, ****<0.0001 using unpaired two-tailed Student’s t-test.
Figure 3
Figure 3. γδ T cell subsets are metabolically programmed in the thymus.
(a) Puromycin MFI of γδ17 (CD44hiCD45RB) and γδIFN (CD44+CD45RB+) T cells from WT adult thymus in resting conditions (Co) and after the addition of 2-deoxy-D-glucose (DG), oligomycin (O) or both (DGO). Histogram (right) shows the percentage of glucose dependency (white; p=0.0029), mitochondrial dependency (blue; p<0.0001), glycolytic capacity (red, p=0.0018) and fatty acid and amino acid oxidation (FaaO) capacity (purple, p=0.0304) of thymic γδ17 and γδIFN cells. Data are representative of two independent experiments (n=5 mice in triplicates per group and per experiment). (b) Histograms shows the percentage of glucose dependency (white), mitochondrial dependency (blue; p<0.0001), glycolytic capacity (red; p<0.0001) and fatty acid and amino acid oxidation (FaaO) capacity (purple) of γδ17 and γδIFN T cells from WT newborn thymus (d3). Data are representative of three independent experiments (n=6 mice in triplicates per group and per experiment). (c) Flow cytometry profile and Tetramethylrhodamine ethyl ester (TMRE) MFI of thymic γδ24+ precursors treated or not with FCCP (p<0.0001). Data are representative of 3 independent experiments (data points represent at least 4 lobes pooled per group and per experiment). (d) Flow cytometry profiles and TMRE MFI of thymic γδTN (CD44CD45RB), γδ17 (CD44hiCD45RB) and γδIFN (CD44+CD45RB+) cells treated or not with FCCP. γδTN vs γδTN+FCCP (p=0.0002), γδIFN vs γδ17 (p<0.0001), and γδ17 vs γδ17+FCCP (p<0.0001). Data are representative of 3 independent experiments (data points represent at least 4 lobes pooled per group and per experiment). (e) Imagestream analysis of γδ17 and γδIFN cells stained with either mitotracker green or TMRE. Scale bar represents 7μm. Data are representative of 2 independent experiments. (f) O2 consumption rates (OCR) of γδ17 and γδIFN cells from thymuses of 5-day old B6 pups were measured by Seahorse extracellular flux analysis in real-time under basal conditions and in response to indicated mitochondrial inhibitors. Data are representative of 3 independent experiments (pooled thymic lobes from n>10 mice per group per experiment). (g) Histograms show maximal respiration potential (p=0.0278) and spare respiratory capacity (p=0.0332) by measuring oxygen consumption rates (OCR) of γδ17 and γδIFN cells from thymuses of 5-day old B6 pups. Data are representative of 3 independent experiments (pooled thymic lobes from n>10 mice per group per experiment). (h-j) Flow cytometry profiles of thymic γδTN, γδ17 and γδIFN cells from 7-day FTOC of E15 thymic lobes either with media containing low (5mM) or high (25mM) glucose (h), or with or without 2-deoxy-d-glucose (2-DG) (i) or metformin (j). Histograms show the number of γδ17 cells (2-DG p=0.0013; metformin p=0.0426) and γδ17/γδIFN cell ratio (glucose p=0.0354; 2-DG p<0.0001; metformin p=0.0079). Data are representative of 2 (h) or 3 (i-j) independent experiments (at least 4 lobes pooled per group per experiment). Error bars show mean ± SEM or SD, *p < 0.05, **p < 0.01, ***p < 0.001, ****p < 0.0001 using unpaired or paired two-tailed Student’s t-test or One-way ANOVA test with Tukey’s multiple comparisons test.
Figure 4
Figure 4. Distinct mitochondrial activities underlie effector fate of thymic γδ T cell progenitors.
(a,b) Flow cytometry profiles and percentage of thymic γδ17 and γδIFN cell output from sorted TMRElo and TMREhi γδTN cells (a) or γδ24+ cells (b) after 5-day culture on OP9DL1 cells. Data are representative of 3 independent experiments (n = 4 mice pooled per group per experiment). (c) Percentage of Vγ1+ and Vγ4+ cells in TMRElo and TMREhi γδ24+ progenitors. Vγ1+ TMRElo vs TMREhi p<0.0001 and Vγ4+ TMRElo vs TMREhi p<0.0001. Data are representative of 3 independent experiments (cells sorted from n=4 mice pooled per group per experiment). (d) TMRE MFI of thymic γδTN (CD44CD45RB), CD24CD44CD45RB+ γδ T cells and γδIFN cells (CD44+CD45RB+) from 6-day FTOC of E17 B6 thymic lobes; γδTN vs CD44CD45RB+ γδ T cells (p=0.002); and CD44CD45RB+ γδ T cells vs γδIFN cells (p=0.0301). Data are representative of 2 independent experiments (n=4 thymi pooled per point per group and per experiment). (e) TMRE staining in CD24CD73+, CD24CD73, CD24+CD73+ and CD24+CD73 γδ T cells from 7-day FTOC of E15 B6 thymic lobes. (f) TMRE staining in CD25CD24+ (γδ24+ cells), CD25med, CD25hi and Vγ5+ γδ progenitors from E15 thymus. (g) Flow cytometry profiles of thymic γδTN, γδ17 and γδIFN cells from 6-day FTOC of E17 B6 thymic lobes stimulated or not with anti-TCRδ mAb (GL3; 1μg/ml). Graph shows percentage of γδ17 (-GL3 vs +GL3; p<0.0001) and γδIFN (-GL3 vs +GL3; p=0.0002) cells in each condition. Data are representative of 2 independent experiments (n=4 thymi pooled per point per group and per experiment). (h) FACS-sorted γδ24+TMREhi cells from E17 thymi were cultured (or not) for 5h with different concentrations (as indicated) of anti-TCRδ mAb (GL3). TMRE levels were analysed by flow cytometry in γδ24– and γδ24+ cells. CTRL vs GL3 (1 μg/mL), p=0.0271; GL3 (1 μg/mL) vs GL3 (5 μg/mL), p=0.0021 and GL3 (5 μg/mL) vs GL3 (10 μg/mL), p=0.0475). Data are representative of 2 independent experiments (n=3 mice pooled per group per experiment). (i) Single-cell RNAseq clustering of TMRElo and TMREhi γδ24+ cells from E15 + 2d FTOC using UMAP. (j) GO term analysis of genes upregulated in TMRElo versus TMREhi γδ24+ cells shown in (i). Error bars show mean ± SD, *p < 0.05, **p < 0.01, ***p < 0.001, ****p < 0.0001 using unpaired two-tailed Student’s t-test.
Figure 5
Figure 5. γδ17 cells show higher lipid uptake and lipid droplet content than γδIFN cells.
(a) Quadrant plot of genes upregulated in bulk RNA-sequencing of tissue resident PLZF+ γδ T cells (lower right), lymphoid PLZF+ γδ T cells (upper left), PLZF+ γδ T cells from all tissues (upper right) or PLZF γδ T cells from all tissues (lower left). Cells were isolated from PLZF-GFP (Zbtb16 GFP) mice. (b) Representative histogram of neutral lipid staining (LipidTOX) in γδ17 (CD27) and γδIFN (CD27+) cells from LNs ex vivo. (c) LipidTOX MFI in γδ17 and γδIFN cells from spleen (p=0.0021), LNs (p<0.0001), lungs (p=0.0043), adipose (p=0.0018), liver (p=0.031) and skin (p=0.9442) (n=5-8, data pooled from 2 independent experiments). (d) Confocal imaging of γδ17 and γδIFN cells expanded in vitro and stained with LipidTOX (red) and Hoechst 33342 (blue). Scale bar represents 5μM (data representative of a minimum 10 images from 2 independent experiments). (e) Quantification of confocal imaging as shown in (d) (each data point represents the average per cell per image; LipidTOX p=0.0018; lipid droplet no. p<0.0001). (f) Quantification of triglyceride (TAG) levels from γδ17 and γδIFN cells expanded in vitro (n=7, each symbol represents one biological replicate). (g) Filipin III staining of γδ17 and γδIFN cells ex vivo from LNs. Representative histogram (left) and MFI (right) (n=6, data pooled from 2 independent experiments; p=0.0276). (h) Representative histogram of Bodipy-FL-C16 uptake in γδ17 and γδIFN cells from LNs ex vivo (n=8, data pooled from 2 independent experiment). (i) Representative plots of Bodipy-FL-C16 uptake and IL-17 or IFN-γ production by γδ17 and γδIFN cells from LNs stimulated with PMA/ionomycin. (j) Bodipy-FL-C16 MFI in IFN-γ+ and IL-17+ γδ T cells (n=4, data representative of 3 independent experiments). (k) Representative plot of Vγ1 and Vγ4 expression in total γδ T cells and percentage Bodipy-FL-C16 uptake by LN γδ T cell subsets (Vγ1+, Vγ4+, Vγ14) (n=6, data pooled from 2 independent experiments; Vγ1 vs Vγ4/Vγ6 p<0.0001; Vγ4 vs Vγ6 p=0.0143). (l) Representative IFN-γ and IL-17 production by Vγ4+ γδ T cells from LNs and percentage Bodipy-FL-C16 uptake by Vγ4+IFN-γ+ and Vγ4+IL-17+ γδ cells (n=6, data pooled from 2 independent experiments). (m) Percentage Bodipy CholEsteryl FL-C12 uptake by γδ17 (CD27) and γδIFN (CD27+) cells from LNs ex vivo (n=6, data pooled from 2 independent experiments). Error bars show mean ± SD, *p < 0.05, **p < 0.01, ***p < 0.001, ****p < 0.0001 using unpaired two-tailed Student’s t-test.
Figure 6
Figure 6. High fat diet promotes the expansion of pro-tumoral γδ17 cells in lymph nodes and within tumors.
(a) Respiratory exchange ratio (RER) of mice fed SFD or HFD for 8 weeks (n=3, data from 1 experiment). (b) Bar graphs showing the percentage and absolute numbers of CD3+ γδ T cells from LNs of standard fat diet (SFD) and high fat diet (HFD) mice (n=9, data pooled from 3 independent experiments). (c) Proportion of γδ17 (CD27) and γδIFN (CD27+) T cells in LNs of SFD and HFD fed mice (n=9, data pooled from 3 independent experiments). (d) Percentage and absolute numbers of CD27+ IFN-γ+ and CD27 IL-17+ γδ T cells from LNs of SFD and HFD mice (n=9, data pooled from 3 independent experiments). (e) Proportion of infiltrating γδ17 cells in spleen, draining LN and tumor in the B16 tumor model (dLN and tumor n=30, data pooled from 4 independent experiments, spleen n=7, naïve LN n=5). (f) Bar graph showing the percentage of γδ17 and γδIFN cells infiltrating tumors (n=9, data pooled from 2 experiments). (g) Bar graph represents the size of s (mm3) in SFD and HFD fed mice. (n=7, representative of 3 independent experiments). (h) Bar graph showing proportion of infiltrating γδ17 (CD27) and γδIFN (CD27+) cells in tumors of SFD and HFD fed mice (SFD n=10, HFD n=12, data pooled from 2 independent experiments). (i) Representative plots of IL-17 and IFN-γ expression in γδ T cells infiltrating tumors of SFD and HFD fed mice. Bar graphs represent the percentage of γδ17 and γδIFN cells infiltrating tumors (SFD n=17, HFD n=20, data pooled from 3 independent experiments). (j) Bar graph showing the number/mm3 of γδ17 and γδIFN cells in tumors of mice on SFD or HFD (SFD n=7, HFD n=8, data pooled from 2 independent experiments). (k) Plots of proliferating Ki67+ γδ17 cells cultured for 5h with or without cholesterol-loaded cyclodextrin (CLC). Graph represents the percentage of Ki67+ γδ17 cells (data are representative of two independent experiments; pool of 3-5 mice per experiment). (l) γδ17 cells cultured (or not) with cholesterol-loaded cyclodextrin (CLC) for 5h were injected s.c. into E0771 tumors at d7 and d9 after tumor cell injection. Representative picture of tumors observed at day 11 post-E0771 cell inoculation. (m) Graph showing tumor weight at day 11 post-E0771 inoculation. CTRL vs γδ17-CLC (p=0.0361); γδ17-CLC vs γδ17+CLC (p=0.0003). (n) E0771 tumor growth was monitored every two days after inoculation. (l-n) data are representative of three independent experiments (n=3 mice per experiment); p<0.0001. Error bars show mean ± SD, *p < 0.05, **p < 0.01, ***p < 0.001, ****p < 0.0001 using unpaired two-tailed Student’s t-test or one-way ANOVA test with Sidak post-hoc analysis.
Figure 7
Figure 7. Glucose supplementation enhances the anti-tumor effector functions of γδIFN cells.
(a) Glucose uptake assessed upon i.v. injection of fluorescent 2-NBDG in tumor-bearing mice. Tumors were harvested 15 min later for analysis. Histogram represents 2-NBDG uptake in γδ17 and γδIFN cells (p=0.047). Data are representative of 2 independent experiments (n = 4 mice per group and per experiment). (b-i) Purified splenic and peripheral lymph nodes γδIFN T cells (CD3+TCRγδ+CD27+) were cultured in the presence of IL-7 with media containing low glucose (5mM), 2-deoxyglycose (2-DG), high glucose (50mM) or galactose (20mM) for 78h. (b) Plots of peripheral γδIFN T cells cultured with IL-7 and media containing low glucose, 2-DG or high glucose. Histogram represents the fold change in number of γδIFN T cells cultured with 2-DG or high glucose versus low glucose (p<0.0001). (c) Fold change in number of proliferating Ki-67+ γδIFN cells cultured with 2-DG or high glucose versus low glucose (p<0.0001). (d) IFN-γ expression was analysed by flow cytometry in γδIFN cells incubated with media containing low glucose, 2-DG or high glucose. Histograms show the MFI of IFN-γ. Low glucose vs 2-DG (p<0.0001); 2-DG vs High glucose (p<0.0001); Low glucose vs high glucose (p=0.0115). (e) Tbet expression was analysed by flow cytometry in γδIFN cells incubated with media containing low glucose, 2-DG or high glucose. Histograms show the MFI of Tbet. Low glucose vs 2-DG (p<0.0001); 2-DG vs High glucose (p<0.0001). (f) Flow cytometry profiles of peripheral γδIFN T cells cultured with IL-7 and media containing glucose (50mM) or galactose (20mM). Histogram represents the numbers of γδIFN T cells (p<0.0001). (g,h) IFN-γ (g) and T-bet (h) expression was analysed by flow cytometry in γδIFN cells incubated with media containing glucose or galactose (p=0.0085 for IFN-γ expression and p=0.0034 for Tbet expression). Histograms show the MFI of IFN-γ and T-bet. (i) Summary of killing assay in vitro of E0771 tumor cells by γδIFN T cells previously supplemented (or not) with glucose (5h pre-incubation); p<0.0001. Data are representative of 2 independent experiments (n = 3 mice per group and per experiment). (j) Representative picture of tumors observed at day 11 post-E0771 inoculation. γδIFN cells supplemented (or not) with glucose for 5h were injected into the tumor at d7 and d9 after tumor cell injection. (k) The E0771 tumor growth was monitored every two days during 11 days after E0771 inoculation. CTRL vs γδIFN - glucose (p=0.0148); γδIFN-glucose vs γδIFN+ glucose (p<0.0001). (b-e) Data are representative of 4 independent experiments (n = 3 mice per group and per experiment); (f-h) Data are representative of 2 independent experiments (n = 4 mice per group and per experiment), (j,k) Data are representative of 2 independent experiments (n = 5 mice per group and per experiment). Error bars show mean ± SEM, *p < 0.05, **p < 0.01, ***p < 0.001, ****p < 0.0001 using unpaired two-tailed Student’s t-test or ANOVA test.

References

    1. Buck MD, Sowell RT, Kaech SM, Pearce EL. Metabolic Instruction of Immunity. Cell. 2017;169:570–586. doi: 10.1016/j.cell.2017.04.004. - DOI - PMC - PubMed
    1. Almeida L, Lochner M, Berod L, Sparwasser T. Metabolic pathways in T cell activation and lineage differentiation. Semin Immunol. 2016;28:514–524. doi: 10.1016/j.smim.2016.10.009. - DOI - PubMed
    1. Geltink RIK, Kyle RL, Pearce EL. Unraveling the Complex Interplay Between T Cell Metabolism and Function. Annu Rev Immunol. 2018;36:488–488. doi: 10.1146/annurev-immunol-042617-053019. - DOI - PMC - PubMed
    1. Cham CM, Driessens G, O’Keefe JP, Gajewski TF. Glucose deprivation inhibits multiple key gene expression events and effector functions in CD8+ T cells. Eur J Immunol. 2008;38:2450–2450. doi: 10.1002/eji.200838289. - DOI - PMC - PubMed
    1. Chang CH, et al. Posttranscriptional control of T cell effector function by aerobic glycolysis. Cell. 2013;153:1251–1251. doi: 10.1016/j.cell.2013.05.016. - DOI - PMC - PubMed

Publication types

MeSH terms