. 2021 Feb;53(2):156-165.
doi: 10.1038/s41588-020-00763-1. Epub 2021 Jan 18.

Large-scale association analyses identify host factors influencing human gut microbiome composition

Alexander Kurilshikov #  1 Carolina Medina-Gomez #  2   3 Rodrigo Bacigalupe #  4   5 Djawad Radjabzadeh #  2 Jun Wang #  4   5   6 Ayse Demirkan  7   8 Caroline I Le Roy  9 Juan Antonio Raygoza Garay  10   11 Casey T Finnicum  12 Xingrong Liu  13 Daria V Zhernakova  7   14 Marc Jan Bonder  7 Tue H Hansen  15 Fabian Frost  16 Malte C Rühlemann  17 Williams Turpin  10   11 Jee-Young Moon  18 Han-Na Kim  19   20 Kreete Lüll  21 Elad Barkan  22 Shiraz A Shah  23 Myriam Fornage  24   25 Joanna Szopinska-Tokov  26 Zachary D Wallen  27 Dmitrii Borisevich  15 Lars Agreus  28 Anna Andreasson  29 Corinna Bang  17 Larbi Bedrani  10 Jordana T Bell  9 Hans Bisgaard  23 Michael Boehnke  30 Dorret I Boomsma  31 Robert D Burk  32   33 Annique Claringbould  7 Kenneth Croitoru  10   11 Gareth E Davies  12   31 Cornelia M van Duijn  34   35 Liesbeth Duijts  3   36 Gwen Falony  4   5 Jingyuan Fu  7   37 Adriaan van der Graaf  7 Torben Hansen  15 Georg Homuth  38 David A Hughes  39   40 Richard G Ijzerman  41 Matthew A Jackson  9   42 Vincent W V Jaddoe  3   34 Marie Joossens  4   5 Torben Jørgensen  43 Daniel Keszthelyi  44   45 Rob Knight  46   47   48 Markku Laakso  49 Matthias Laudes  50 Lenore J Launer  51 Wolfgang Lieb  52 Aldons J Lusis  53   54 Ad A M Masclee  44   45 Henriette A Moll  36 Zlatan Mujagic  44   45 Qi Qibin  18 Daphna Rothschild  22 Hocheol Shin  55   56 Søren J Sørensen  57 Claire J Steves  9 Jonathan Thorsen  23 Nicholas J Timpson  39   40 Raul Y Tito  4   5 Sara Vieira-Silva  4   5 Uwe Völker  38 Henry Völzke  58 Urmo Võsa  7 Kaitlin H Wade  39   40 Susanna Walter  59   60 Kyoko Watanabe  61 Stefan Weiss  16   38 Frank U Weiss  16 Omer Weissbrod  62 Harm-Jan Westra  7 Gonneke Willemsen  31 Haydeh Payami  27 Daisy M A E Jonkers  44   45 Alejandro Arias Vasquez  26   63 Eco J C de Geus  31   64 Katie A Meyer  65   66 Jakob Stokholm  23 Eran Segal  22 Elin Org  21 Cisca Wijmenga  7 Hyung-Lae Kim  67 Robert C Kaplan  68 Tim D Spector  9 Andre G Uitterlinden  2   3   34 Fernando Rivadeneira  2   3 Andre Franke  17 Markus M Lerch  16 Lude Franke  7 Serena Sanna  7   69 Mauro D'Amato  13   70   71   72 Oluf Pedersen  15 Andrew D Paterson  73 Robert Kraaij  2 Jeroen Raes  4   5 Alexandra Zhernakova  74
Affiliations

Large-scale association analyses identify host factors influencing human gut microbiome composition

Alexander Kurilshikov et al. Nat Genet. 2021 Feb.

Abstract

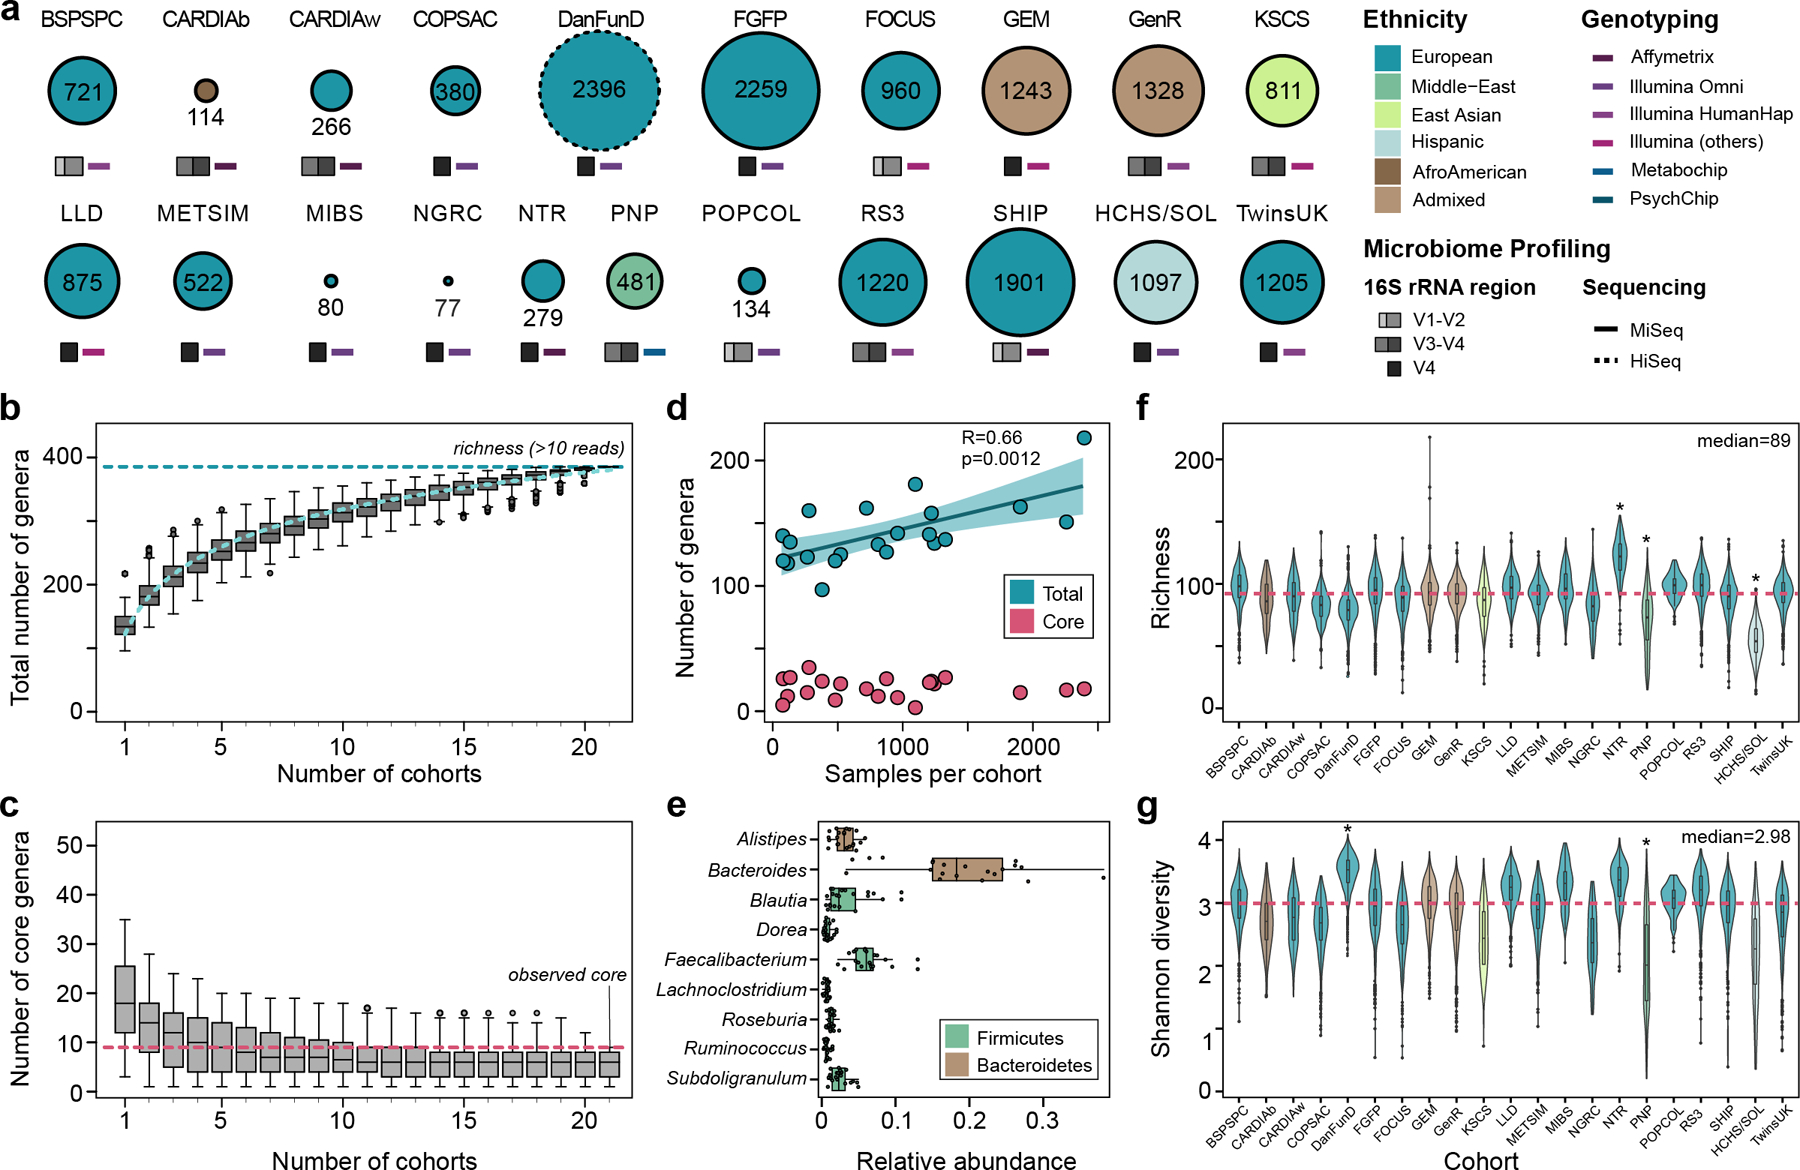
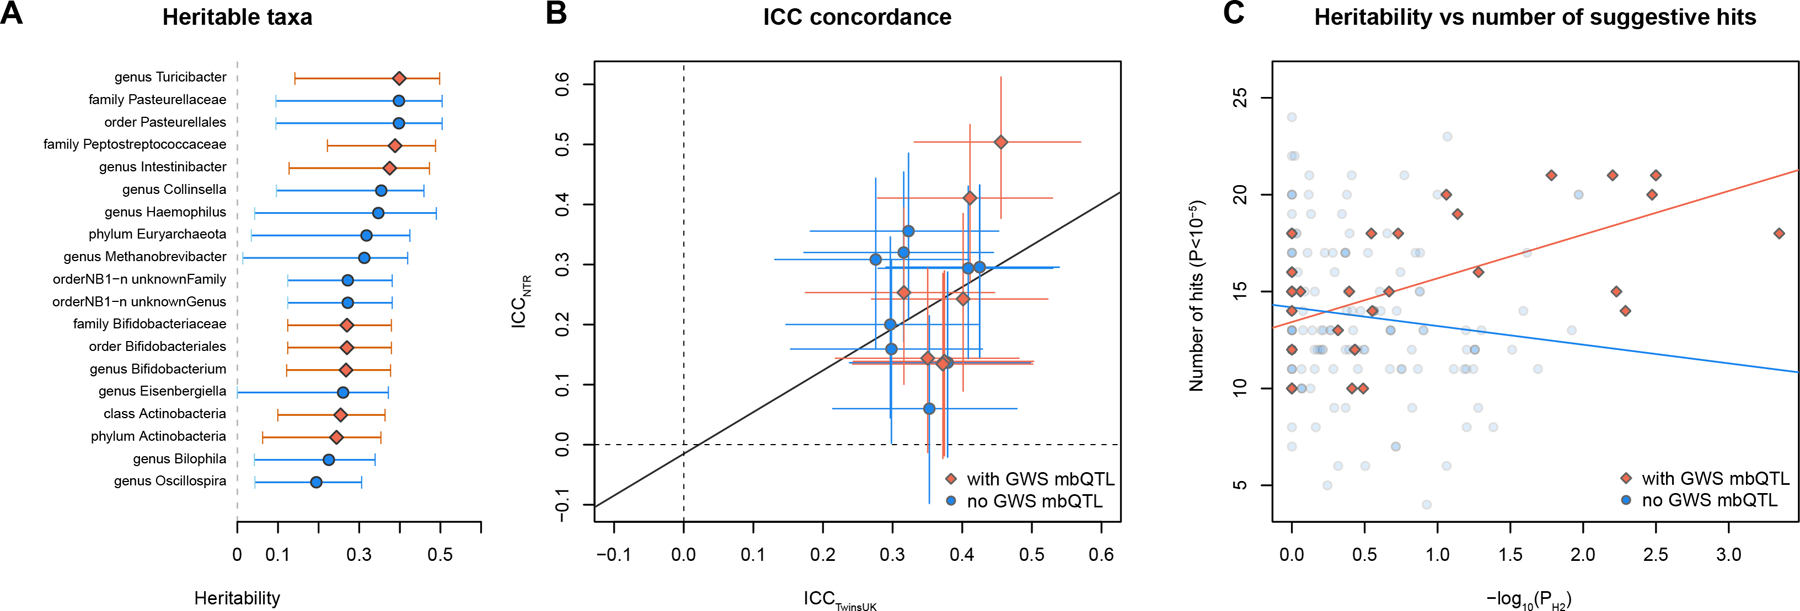
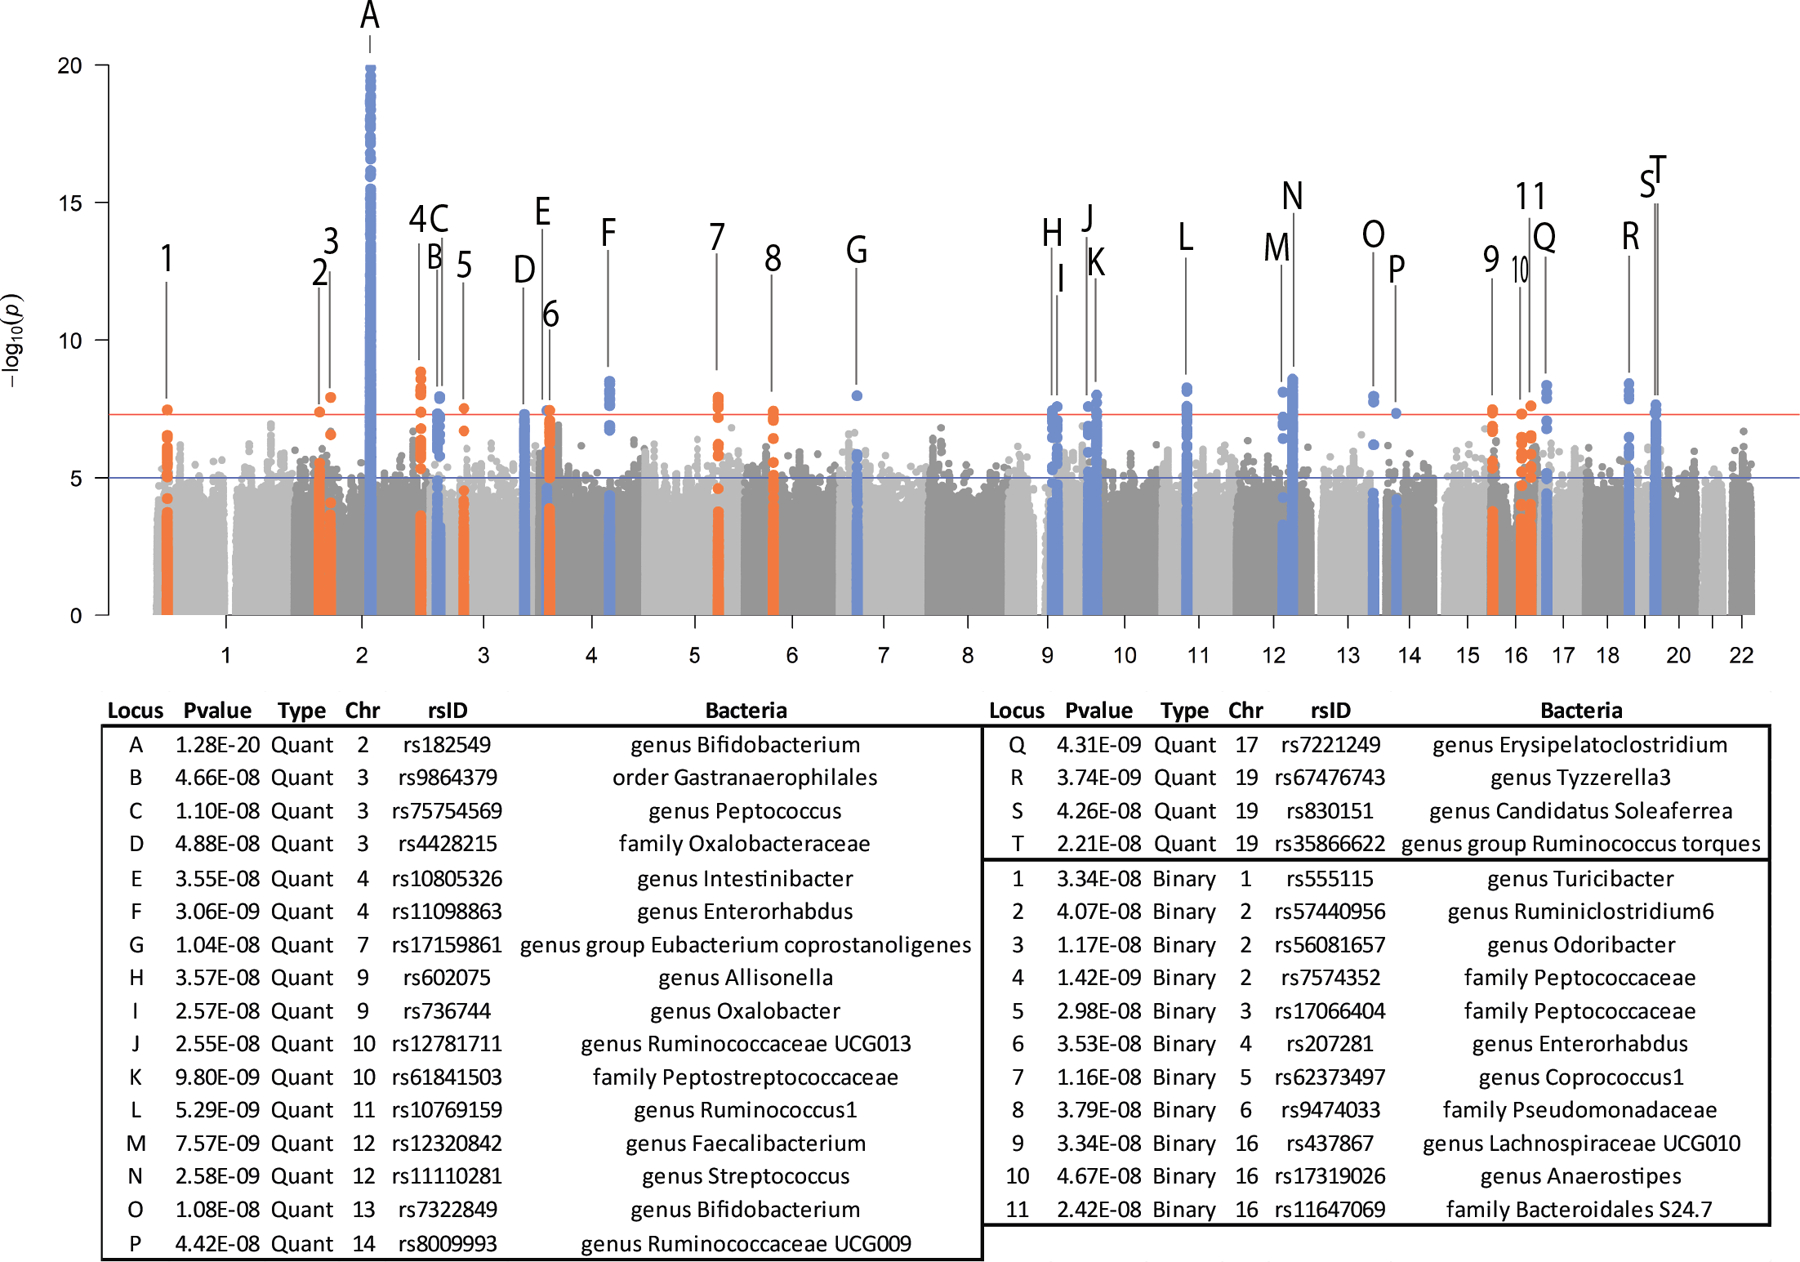
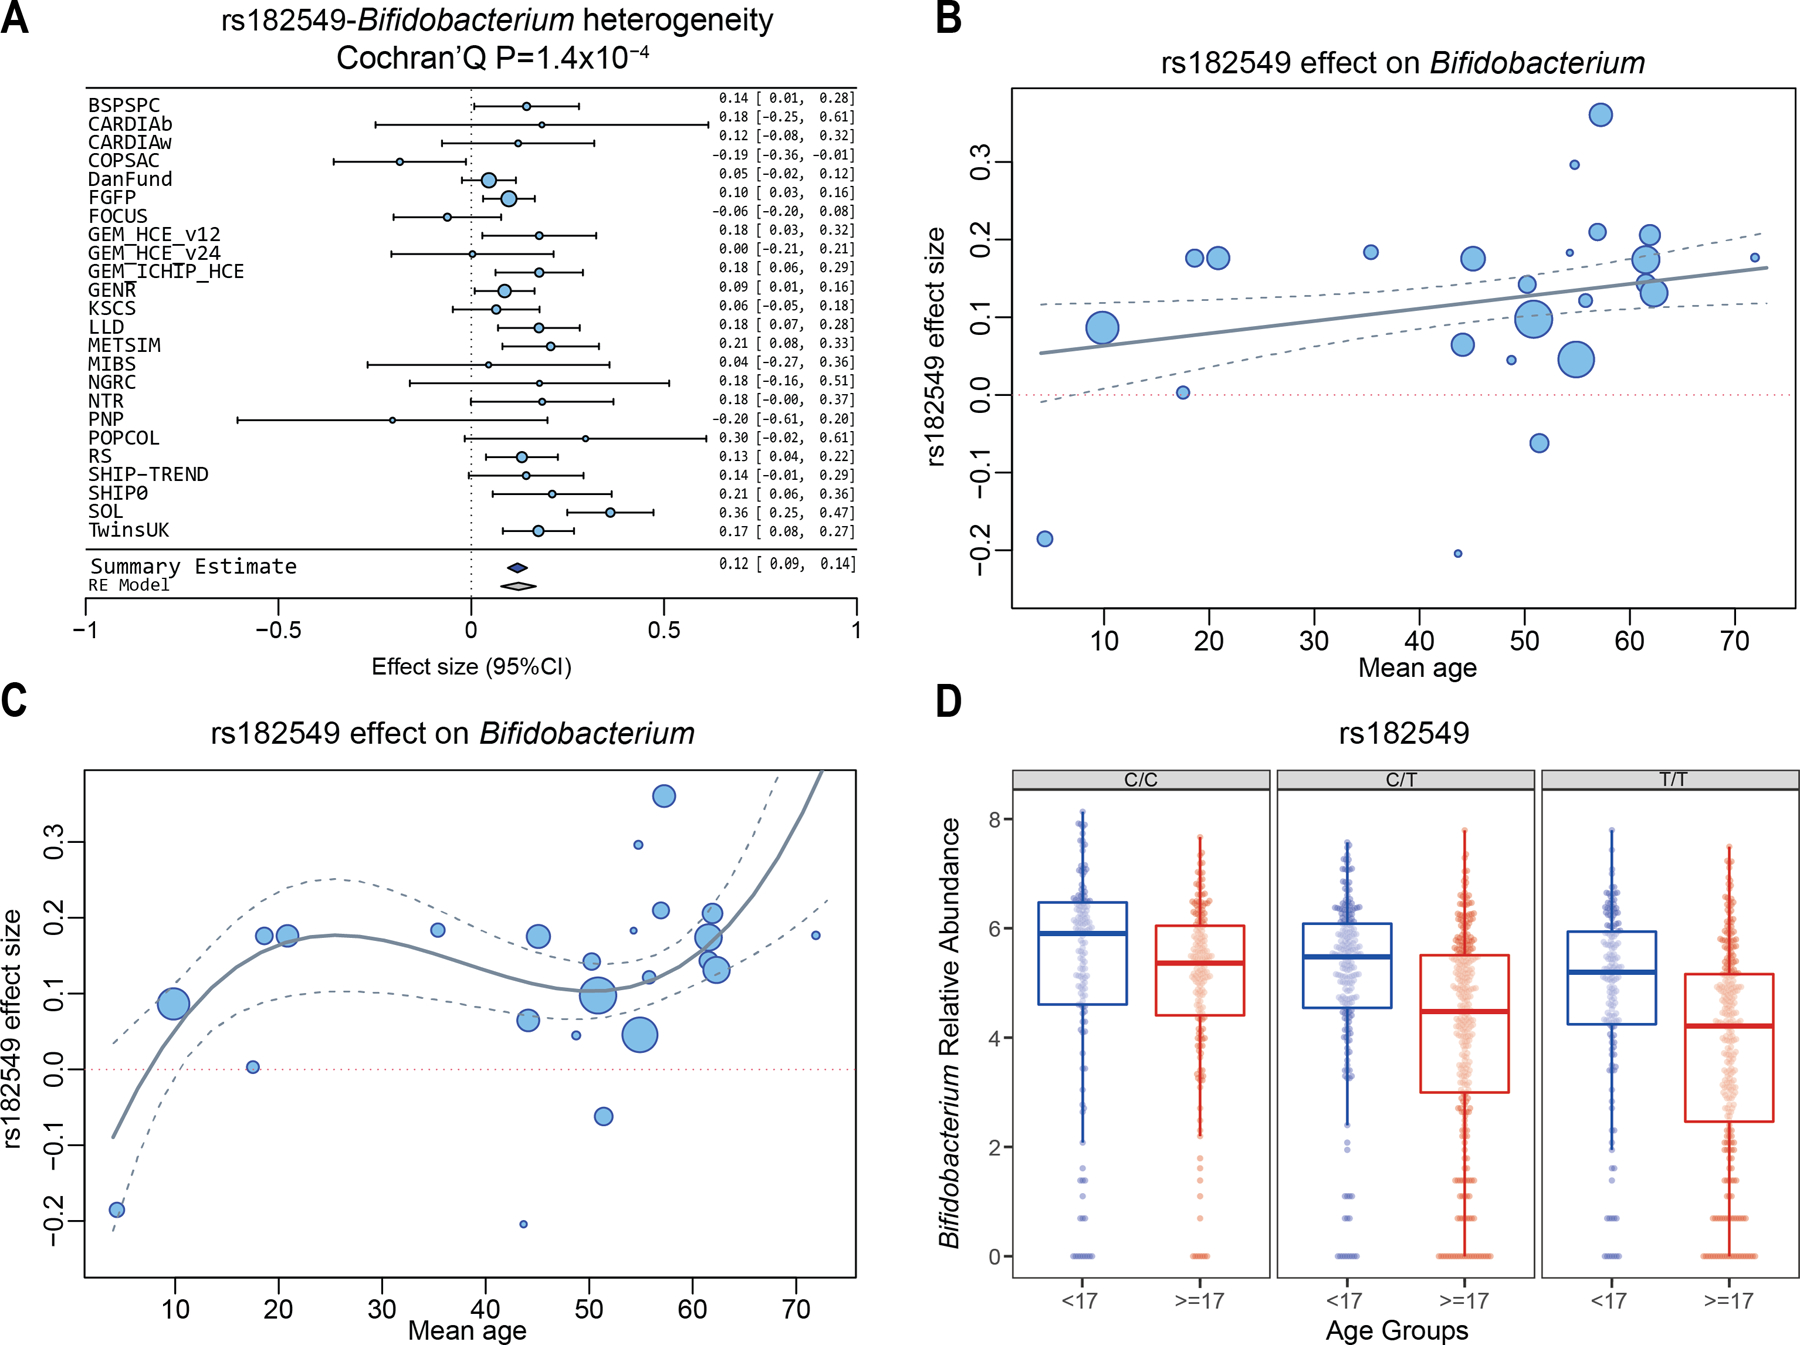
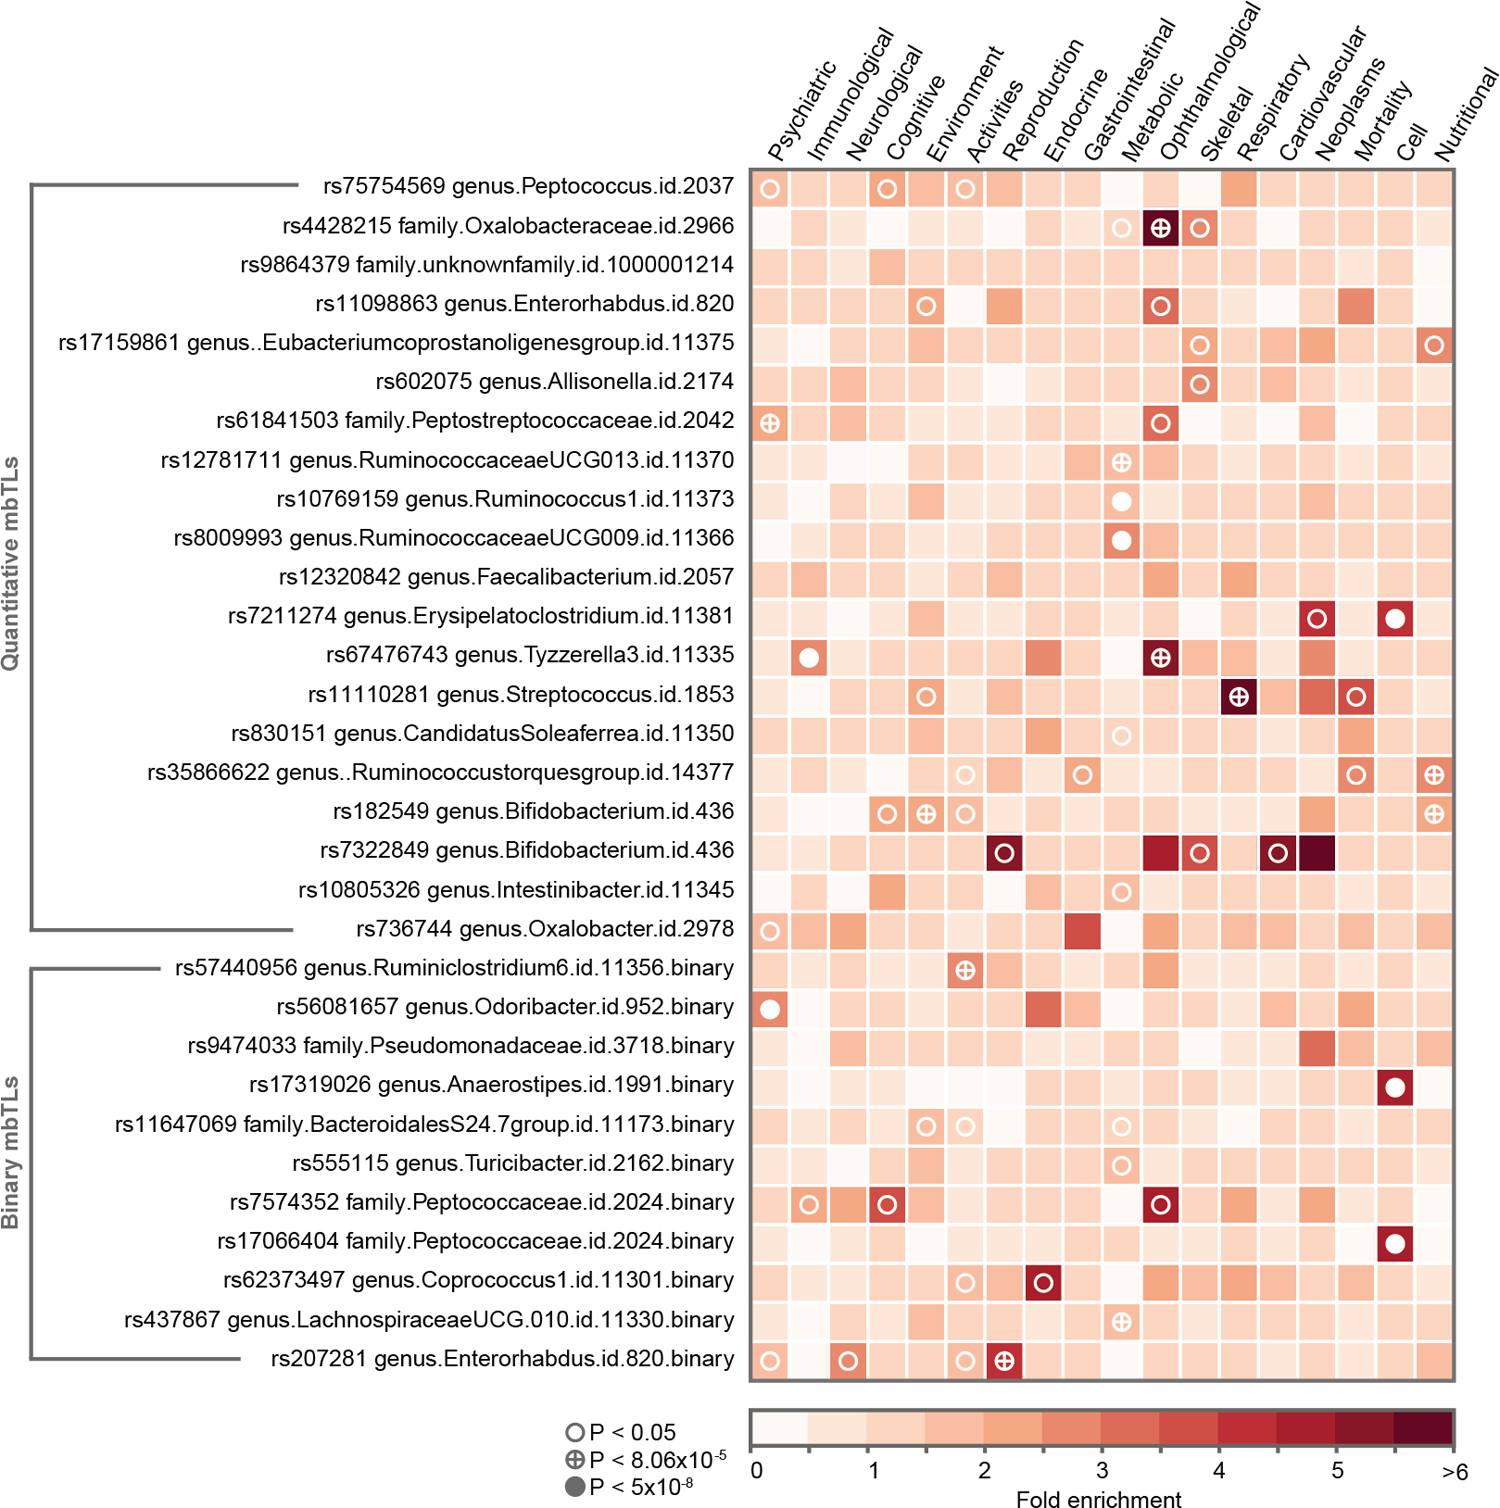
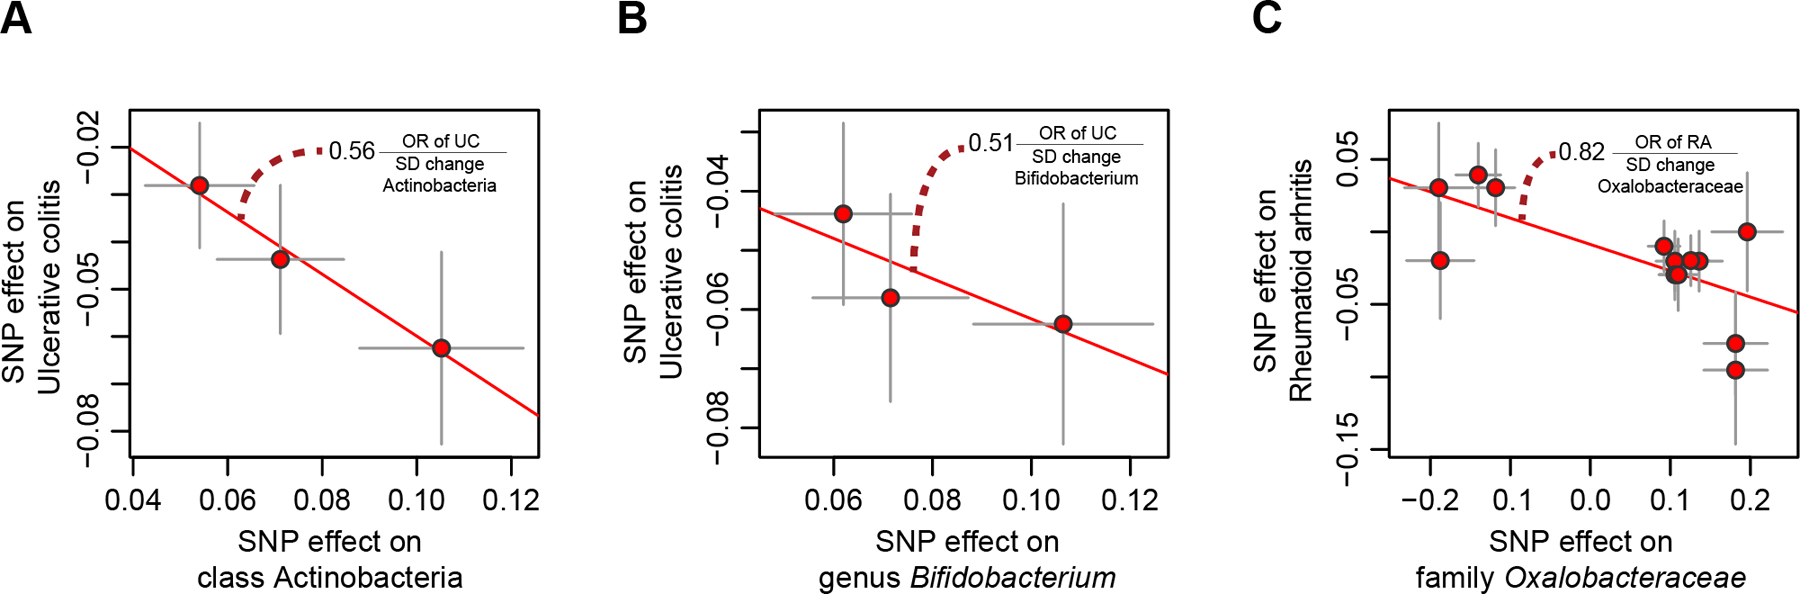
To study the effect of host genetics on gut microbiome composition, the MiBioGen consortium curated and analyzed genome-wide genotypes and 16S fecal microbiome data from 18,340 individuals (24 cohorts). Microbial composition showed high variability across cohorts: only 9 of 410 genera were detected in more than 95% of samples. A genome-wide association study of host genetic variation regarding microbial taxa identified 31 loci affecting the microbiome at a genome-wide significant (P < 5 × 10⁻⁸) threshold. One locus, the lactase (LCT) gene locus, reached study-wide significance (genome-wide association study signal: P = 1.28 × 10⁻²⁰), and it showed an age-dependent association with Bifidobacterium abundance. Other associations were suggestive (1.95 × 10⁻¹⁰ < P < 5 × 10⁻⁸) but enriched for taxa showing high heritability and for genes expressed in the intestine and brain. A phenome-wide association study and Mendelian randomization identified enrichment of microbiome trait loci in the metabolic, nutrition and environment domains and suggested the microbiome might have causal effects in ulcerative colitis and rheumatoid arthritis.


Conflict of interest statement

Competing interests

All authors declare no competing interests.

Figures

Figure 1.
Figure 1.. Diversity of microbiome composition across the MiBioGen cohorts.
(a) Sample size, ethnicity, genotyping array and 16S rRNA gene profiling method. The SHIP/SHIP-TREND and GEM_v12/GEM_v24/GEM_ICHIP subcohorts are combined in SHIP and GEM, respectively (Online Methods; see Supplementary Note for cohort abbreviations). This merge resulted in the total of 21 cohorts depicted in the figure. (b)* Total richness (number of genera with mean abundance over 0.1%, i.e. 10 reads out of 10,000 rarefied reads) by number of cohorts investigated. (c)* Number of core genera (genera present in >95% of samples from each cohort) by number of cohorts investigated. (d) Pearson correlation of cohort sample size with total number of genera. Confidence band represents the standard error of the regression line. (e)* Unweighted mean relative abundance of core genera across the entire MiBioGen dataset. (f)* Per-sample richness across the 21 cohorts. Asterisks indicate cohorts that differ significantly from all the others (pairwise Wilcoxon rank-sum test; FDR<0.05). (g) Diversity (Shannon index) across the 21 cohorts, with the DanFund and PNP cohorts presenting higher and lower diversity in relation to the other cohorts (pairwise Wilcoxon rank sum test; FDR<0.05). (*) For all boxplots, the central line, box and whiskers represent the median, IQR and 1.5 times the IQR.
Figure 2.
Figure 2.. Heritability of microbiome taxa and its concordance with mbQTL mapping.
(a) Microbial taxa that showed significant heritability in the TwinsUK cohort (ACE model, nominal P<0.05, no adjustment for multiple comparison). Taxa with at least one genome-wide significant (GWS) mbQTL hit are marked red. Only taxa present in more than 10% of pairs (>17 MZ pairs, >41 DZ pairs) are shown. Circles and diamonds represent heritability value. Error bars represent 95% CI. (b) Correlation of monozygotic ICC between TwinsUK and NTR cohort. Only taxa with significant heritability (ACE model P<0.05) that are present in both TwinsUK and NTR are shown. Red and blue dots indicate bacterial taxa with/without GWS mbQTLs (P<5×10⁻⁸), respectively. Segments represent 95% CI. (c) Correlation between heritability significance (−log10PH2 TwinsUK) and the number of loci associated with microbial taxon at relaxed threshold (PmbQTL<1×10⁻⁵). Taxa with at least one GWS-associated locus are marked red. Error bars represent 95% confidence intervals.
Figure 3.
Figure 3.. Manhattan plot of the mbTL mapping meta-analysis results.
MbQTLs are indicated by letters. MbBTLs are indicated by numbers. For mbQTLs, the Spearman correlation test (two-sided) was used to identify loci that affect the covariate-adjusted abundance of bacterial taxa, excluding samples with zero abundance. For mbQTLs, p-values (two-sided) were calculated by logistic regression. Horizontal lines define nominal genome-wide significance (P=5×10⁻⁸, red) and suggestive genome-wide (P=1×10⁻⁵, blue) thresholds.
Figure 4.
Figure 4.. Association of the LCT locus (rs182549) with the genus Bifidobacterium.
(a) Forest plot of effect sizes of rs182549 and abundance of Bifidobacterium. Effect sizes and 95% CI are defined as circles and error bars. Effect sizes were calculated from Spearman correlation p-values (Online Methods). (b) Meta-regression of the association of mean cohort age and mbQTL effect size. Confidence bands represent the standard error of the meta-regression line. (c) Meta-regression analysis of the effect of linear, squared and cubic terms of age on mbQTL effect size. Confidence bands represent the standard error of the meta-regression line. (d) Age-dependence of mbQTL effect size in the GEM cohort. Blue boxes include samples in the age range 6–16 years old. Red boxes include samples with age ≥17 years. The C/C (rs182549) genotype is a proxy of the NC_000002.11:g.136608646=(rs4988235) allele, which is associated to functional recessive hypolactasia. The central line, box and whiskers represent the median, IQR and 1.5 times the IQR, respectively. See Supplementary Note for cohort abbreviations.
Figure 5.
Figure 5.. Phenome-wide association study (PheWAS) domain enrichment analysis.
The analysis covered top-SNPs from 30 mbTLs and 20 phenotype domains. Three thresholds for multiple testing were used: 0.05, 8.3×10⁻⁵ (Bonferroni adjustment for number of phenotypes and genotypes studied) and 5×10⁻⁸ (an arbitrary genome-wide significance threshold). Only categories with at least one significant enrichment signal are shown.
Figure 6.
Figure 6.. Mendelian randomization (MR) analysis.
The X-axes show the SNP-exposure effect and the Y-axes show the SNP-outcome effect (SEs denoted as segments). (a) MR analysis of class Actinobacteria (exposure) and ulcerative colitis (outcome). (b) MR analysis of genus Bifidobacterium (exposure) and ulcerative colitis (outcome). (c) MR analysis of family Oxalobacteraceae (exposure) and rheumatoid arthritis (outcome).

Similar articles

Cited by

References

    1. Gilbert JA et al. Current understanding of the human microbiome. Nat. Med 24, 392–400 (2018). - PMC - PubMed
    1. Zhernakova A et al. Population-based metagenomics analysis reveals markers for gut microbiome composition and diversity. Science 352, 565–569 (2016). - PMC - PubMed
    1. Falony G et al. Population-level analysis of gut microbiome variation. Science 352, 560–564 (2016). - PubMed
    1. Rothschild D et al. Environment dominates over host genetics in shaping human gut microbiota. Nature 555, 210–215 (2018). - PubMed
    1. Goodrich JK et al. Human Genetics Shape the Gut Microbiome. Cell 159, 789–799 (2014). - PMC - PubMed

Publication types

Grants and funding