. 2021 Feb;53(2):195-204.
doi: 10.1038/s41588-020-00766-y. Epub 2021 Jan 18.

Tractor uses local ancestry to enable the inclusion of admixed individuals in GWAS and to boost power

Affiliations

Tractor uses local ancestry to enable the inclusion of admixed individuals in GWAS and to boost power

Elizabeth G Atkinson et al. Nat Genet. 2021 Feb.

Abstract

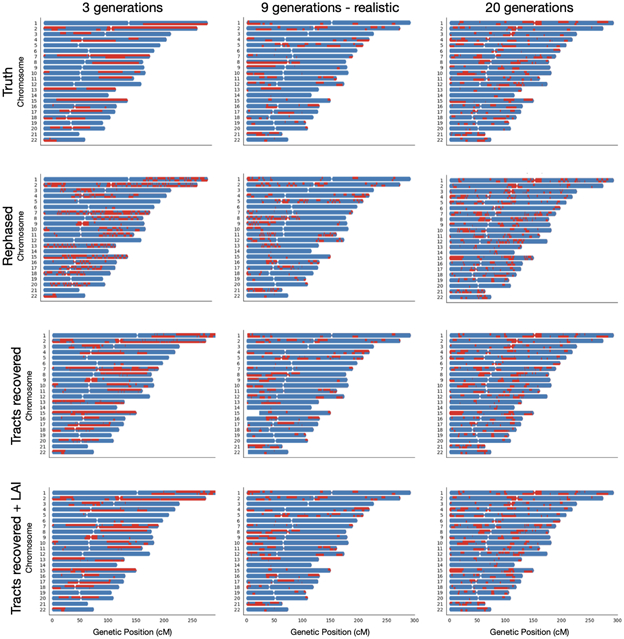
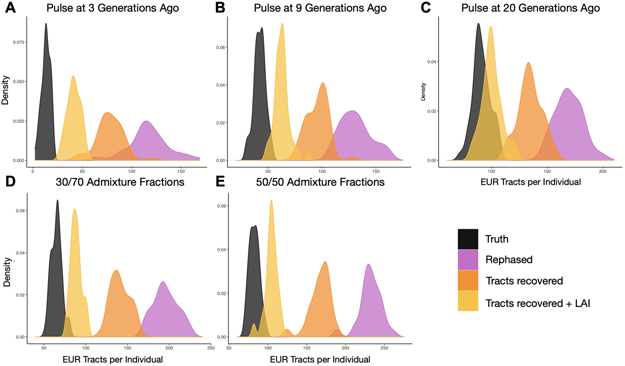
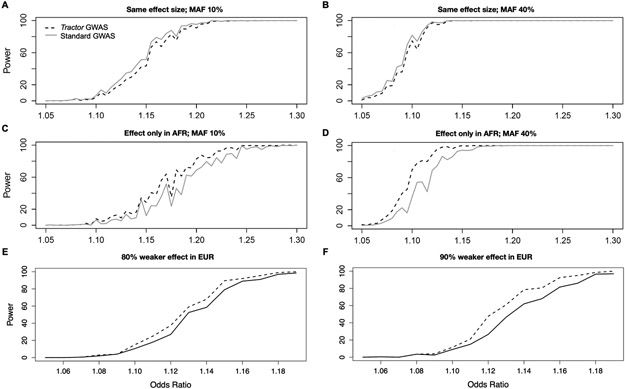
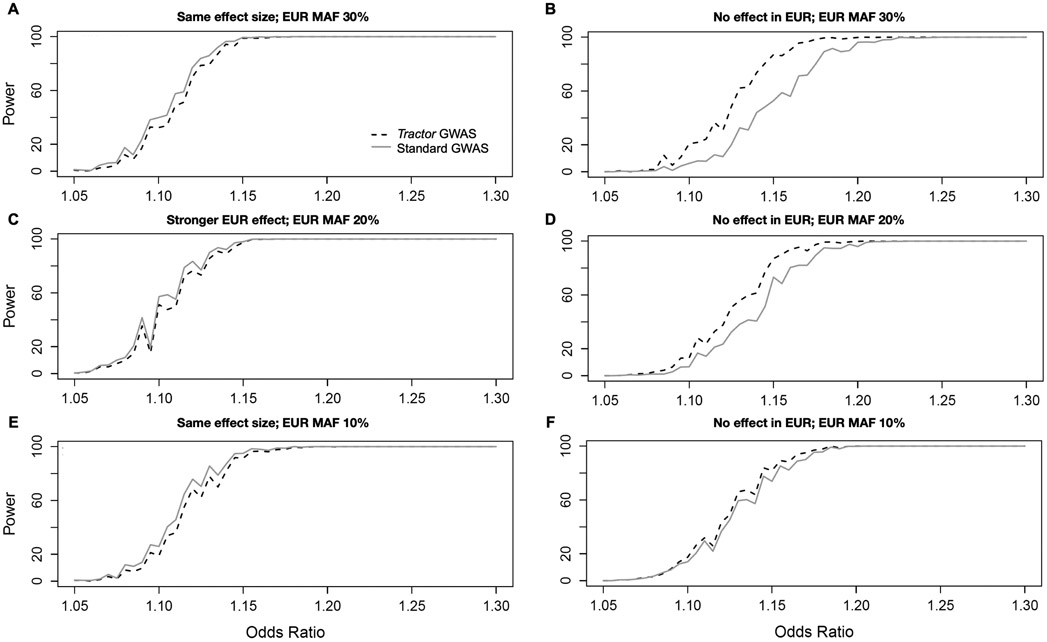
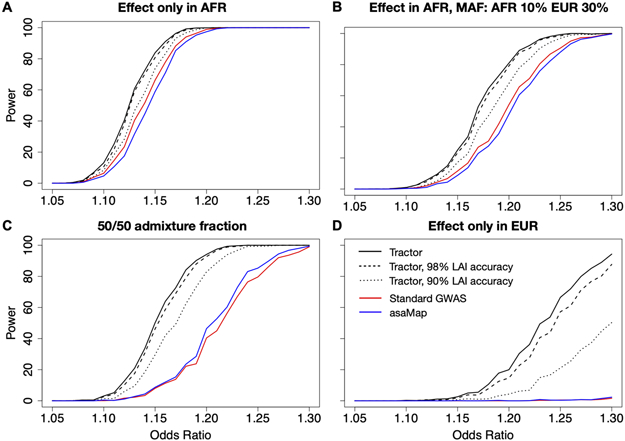
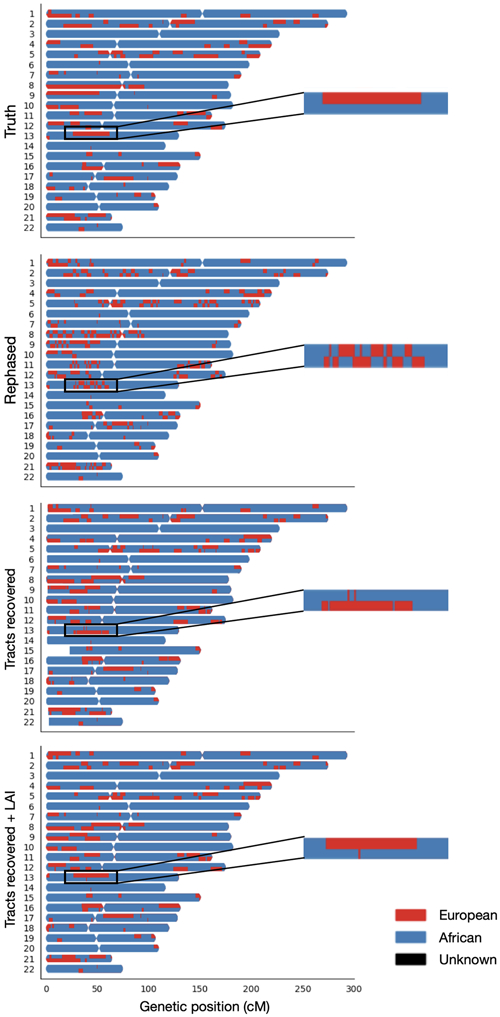
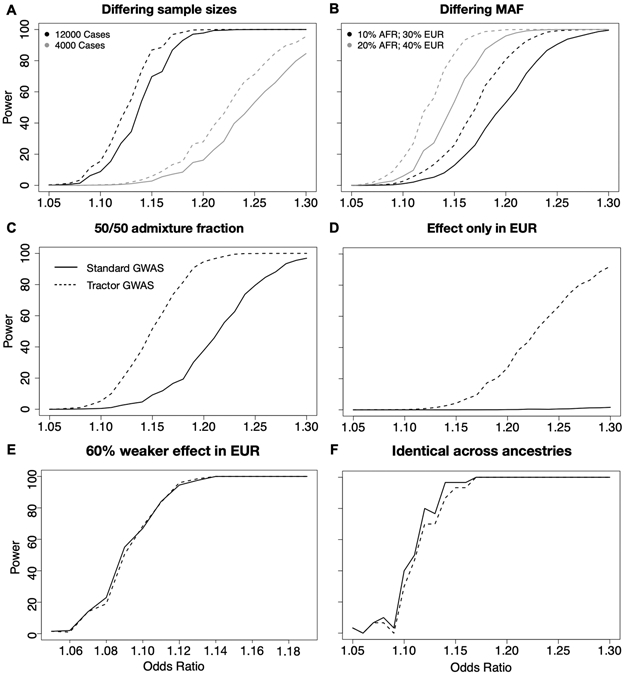
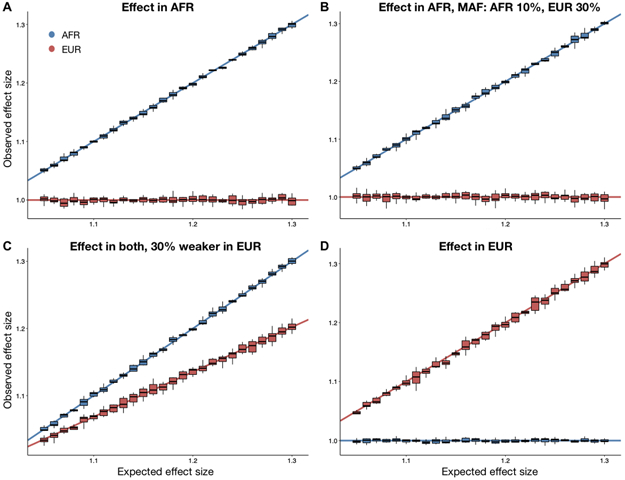
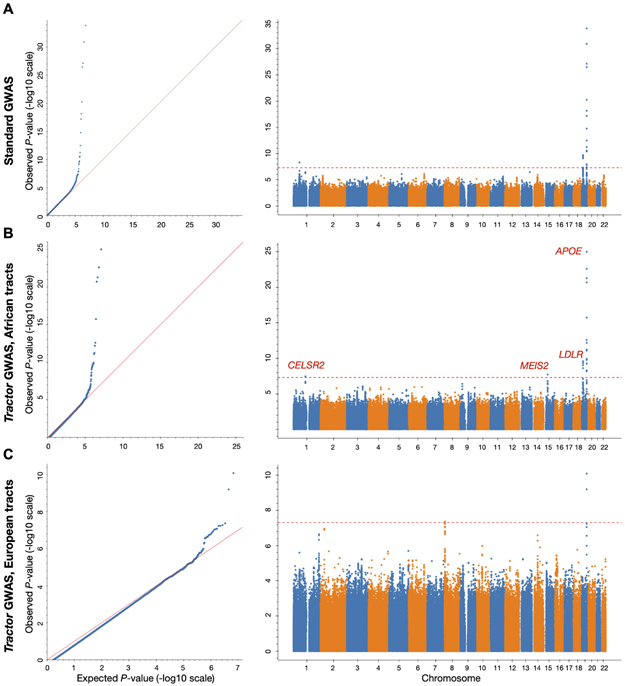
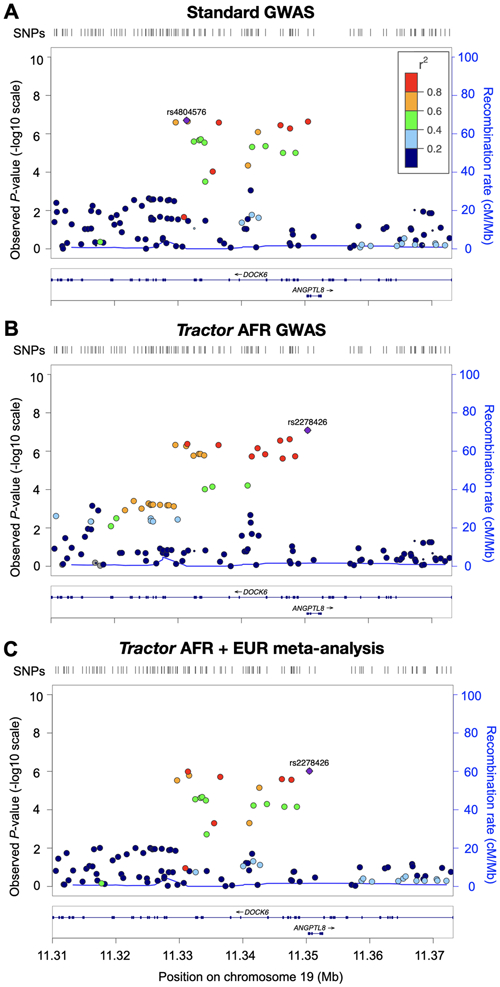
Admixed populations are routinely excluded from genomic studies due to concerns over population structure. Here, we present a statistical framework and software package, Tractor, to facilitate the inclusion of admixed individuals in association studies by leveraging local ancestry. We test Tractor with simulated and empirical two-way admixed African-European cohorts. Tractor generates accurate ancestry-specific effect-size estimates and P values, can boost genome-wide association study (GWAS) power and improves the resolution of association signals. Using a local ancestry-aware regression model, we replicate known hits for blood lipids, discover novel hits missed by standard GWAS and localize signals closer to putative causal variants.


Figures

Extended Data Fig. 1
Extended Data Fig. 1. Painted karyograms of a simulated AA individual showing EUR (red) and AFR (blue) ancestral tracts across demographic models.
The first column shows the results for the demographic model of one pulse of admixture 3 generations ago, the middle column shows the realistic model of one pulse 9 generations ago, and the right column shows a pulse 20 generations ago. In all cases the model involved 84% AFR ancestry and 16% EUR. The rows show the results from treatments of the data across steps of the Tractor pipeline. The top row shows the truth results from our simulations. Painted karyograms after statistical phasing of this truth cohort is shown in the second row. The third row illustrates the recovery of tracts broken by switch errors in phasing obtained by unkinking. The bottom row shows the smoothing and further improvement of tracts acquired through an additional round of LAI.
Extended Data Fig. 2
Extended Data Fig. 2. Tractor recovers disrupted tracts, improving tract distributions.
The top row (A-C) shows the improvements to the distributions of the number of discrete EUR tracts observed in simulated AA individuals under demographic models of 1 pulse of admixture at 3, 9 (realistic for AA population history) and 20 generations ago. The bottom row (D,E) shows the results from different initial admixture fractions, of 70% and 50% AFR, respectively, at 9 generations since admixture. These can be compared to the inferred realistic demographic model shown in B. In all panels, the simulated truth dataset is shown in black, after statistical phasing in purple, immediately after tract recovery procedures is in orange, and after one additional round of LAI after tract recovery in yellow.
Extended Data Fig. 3
Extended Data Fig. 3. The contribution of absolute MAF and effect size to Tractor power.
All cases assume an 80/20 AFR/EUR admixture ratio, 10% disease prevalence, 12k cases/30k controls with an effect only in the AFR genetic background. In all panels, the solid line uses a traditional GWAS model while the dashed line is our LAI-incorporating Tractor model. (A,B): Equal effect in EUR and AFR with shifted absolute MAF. (C,D): effect only in AFR background. (A,C): MAF is set to 10% in both AFR and EUR. (B,D): MAF is set to 40% in both AFR and EUR. Panels E and F illustrate the heterogeneity in effect sizes required to observe gains in Tractor power over traditional GWAS assuming 20% MAF in both ancestries and an effect that is stronger in AFR with varying difference to the EUR effect.
Extended Data Fig. 4
Extended Data Fig. 4. The interaction of between-ancestry MAF differences and effect sizes on Tractor power.
In all cases, the grey solid line uses a traditional GWAS model while the black dashed line is our LAI-incorporating model, admixture proportions are 80/20 AFR/EUR, disease prevalence is 10%, and the AFR MAF is fixed at 20%. A and E model the same effect size between EUR and AFR while varying the EUR MAF. B,D,F model the case when there is no effect in the EUR background while varying EUR MAF. C models an effect size difference of 30% with the effect being stronger in the EUR background. For comparison, Figure 2F shows the same effect at matched 20% MAF.
Extended Data Fig. 5
Extended Data Fig. 5. The impact of LAI accuracy on Tractor’s performance as compared to standard GWAS and asaMap.
We modeled perfect accuracy, realistic accuracy as derived from simulations of our AA demographic model (98%), and a lower bound of 90% LAI accuracy. Black lines all indicate Tractor runs: the solid black line is Tractor’s performance with perfect LAI accuracy, the dashed line is at 98% accuracy, and the dotted line is at 90% accuracy. The red line represents the power obtained from standard GWAS, and the blue line for the asaMap model for the ancestry in which the effect was modeled (AFR for A,B, and C, and EUR for D). In all cases we included 10 PCs as covariates and 1000 replicates were run.
Figure 1.
Figure 1.. Painted karyograms of a simulated AA individual showing local EUR (red) and AFR (blue) ancestral tracts across data treatments.
The top panel shows the truth results for an example individual in our simulated AA cohort. The same person after statistical phasing is shown in the second row – note the disruption of long haplotypes resulting from phasing switch errors. The third panel illustrates our recovery of tracts broken by switch errors in phasing. The bottom panel shows the smoothing and further improvement of tracts acquired through an additional round of LAI. The same section of chr13 showing an example tract at higher resolution is pictured on the right to highlight tract recovery.
Figure 2.
Figure 2.. GWAS power gains across sample sizes, ancestral MAF differences, admixture proportions, and effect size differences.
In all scenarios shown, dashed lines correspond to the power from the Tractor model incorporating local ancestry, solid lines are for a traditional GWAS model. In all panels we modeled a 10% disease prevalence. Unless otherwise noted, we used the parameters for a realistic demographic scenario for AA individuals: 80% AFR ancestry, an effect present only in the AFR genetic background, 12k cases and 30k controls, and 20% MAF. (A) There are similar gains in GWAS power when using the Tractor LAI-aware model across samples sizes of 4,000 (grey) and 12,000 (black) cases with 2x controls. (B) When there is a MAF difference between ancestries, the boost in power is even more pronounced. Gains vary across the allele frequency spectrum: black=MAF 10% AFR, 30% EUR; grey=MAF 20% AFR, 40% EUR. (C) Gains become more pronounced when the admixture fractions are modified to 50/50. (D) Dramatic gains are obtained when the effect is switched to instead only be present on the less common EUR background. (E) The threshold for heterogeneity in ancestral effect sizes required to observe gains in Tractor power over traditional GWAS assuming 20% MAF in both ancestries and an effect that is stronger in AFR with varying difference to the EUR effect. (F) There is a small loss in power from incorporating local ancestry into the GWAS model when all parameters are identical across ancestries.
Figure 3.
Figure 3.. Tractor accurately estimates ancestry-specific effect sizes.
Boxplots show the effect size estimated by Tractor as compared to that modeled in the simulation across a range of effect sizes where the center is the median, the bounds of box represent the first quantile to third quantile, and whiskers are 1.5 * IQR. The lines indicate the simulated values for each ancestry. Blue represents effects in AFR, red in EUR. The models presented all include 1000 simulation replicates with 12k cases, 30k controls at 10% disease prevalence in a realistic AA population with an admixture ratio of 80/20 AFR/EUR. Unless otherwise noted, the risk allele MAF was set at 20% in both ancestries. (A) The initial simulation framework of an effect only in AFR. (B) An effect only in AFR with differing minor allele frequencies across ancestries: AFR being 10% and EUR 30%. (C) An effect in both ancestries, with a 30% weaker effect modeled in the EUR. (D) Effect only in EUR.
Figure 4.
Figure 4.. Tractor GWAS replicates established hits for Total Cholesterol in admixed African-European individuals and identifies new ancestry-specific loci.
QQ and Manhattan plots for Total Cholesterol using (A) the standard GWAS model compared to Tractor joint-analysis results for the (B) AFR and (C) EUR backgrounds. The traditional genome-wide significance threshold of 5e-08 is shown as the red dashed line.
Figure 5.
Figure 5.. Tractor better localizes a top hit for Total Cholesterol.
Runs on UKB admixed individuals with (A) standard GWAS model, (B) AFR-specific GWAS with Tractor, and (C) a meta-analysis of GWAS runs on deconvolved EUR and AFR tracts. Both Tractor runs pinpoint a lead SNP ~20kb downstream of the intronic standard GWAS top hit in DOCK6 spanning a better candidate gene, ANGPTL8. No significant signal was seen in the EUR segments. In all plots, point size is proportional to the number of samples included for that test, and color indicates r to the named lead SNP. The recombination rate is shown as a blue line generated from the AFR superpopulation of the 1000 Genomes Project in B, or the EUR superpopulation for other panels.

Comment in

  • Reply to: On powerful GWAS in admixed populations.
    Atkinson EG, Bloemendal A, Maihofer AX, Nievergelt CM, Daly MJ, Neale BM. Atkinson EG, et al. Nat Genet. 2021 Dec;53(12):1634-1635. doi: 10.1038/s41588-021-00975-z. Epub 2021 Nov 25. Nat Genet. 2021. PMID: 34824479 No abstract available.
  • On powerful GWAS in admixed populations.
    Hou K, Bhattacharya A, Mester R, Burch KS, Pasaniuc B. Hou K, et al. Nat Genet. 2021 Dec;53(12):1631-1633. doi: 10.1038/s41588-021-00953-5. Epub 2021 Nov 25. Nat Genet. 2021. PMID: 34824480 Free PMC article. No abstract available.

Similar articles

Cited by

References

    1. Parker K, Morin R, Horowitz Juliana Menasce & Rohal M Multiracial in America: Proud, Diverse and Growing in Numbers. (2015).
    1. Bhardwaj A et al. Racial disparities in prostate cancer a molecular perspective. Front. Biosci 22, 4515 (2017). - PMC - PubMed
    1. Grizzle WE et al. Self‐Identified African Americans and prostate cancer risk: West African genetic ancestry is associated with prostate cancer diagnosis and with higher Gleason sum on biopsy. Cancer Med. 8, 6915–6922 (2019). - PMC - PubMed
    1. Duggan MA, Anderson WF, Altekruse S, Penberthy L & Sherman ME The Surveillance, Epidemiology, and End Results (SEER) Program and Pathology: Toward Strengthening the Critical Relationship. Am. J. Surg. Pathol 40, e94–e102 (2016). - PMC - PubMed
    1. Freedman ML et al. Admixture mapping identifies 8q24 as a prostate cancer risk locus in African-American men. Proc. Natl. Acad. Sci. U. S. A 103, 14068–14073 (2006). - PMC - PubMed

Online Methods References

    1. Van Rossum G, Drake FL Jr. Python reference manual. Centrum voor Wiskunde en Informatica; Amsterdam; 1995.
    1. Gnu P Bash (3.2.48) [Unix shell program; ]. 2007.
    1. International Hapmap Consortium T. The International HapMap Project. Nature 2003;426:789–96. 10.1038/nature02168. - DOI - PubMed
    1. Chen CY, Pollack S, Hunter DJ, Hirschhorn JN, Kraft P, Price AL. Improved ancestry inference using weights from external reference panels. Bioinformatics 2013;29:1399–406. 10.1093/bioinformatics/btt144. - DOI - PMC - PubMed
    1. Williams A. admix-simu: program to simulate admixture between multiple populations. 2016 doi: 10.5281/ZENODO.45517. . - DOI

Publication types

LinkOut - more resources