. 2021 May;39(5):599-608.
doi: 10.1038/s41587-020-00795-2. Epub 2021 Jan 18.

Delineating copy number and clonal substructure in human tumors from single-cell transcriptomes

Affiliations

Delineating copy number and clonal substructure in human tumors from single-cell transcriptomes

Ruli Gao et al. Nat Biotechnol. 2021 May.

Abstract

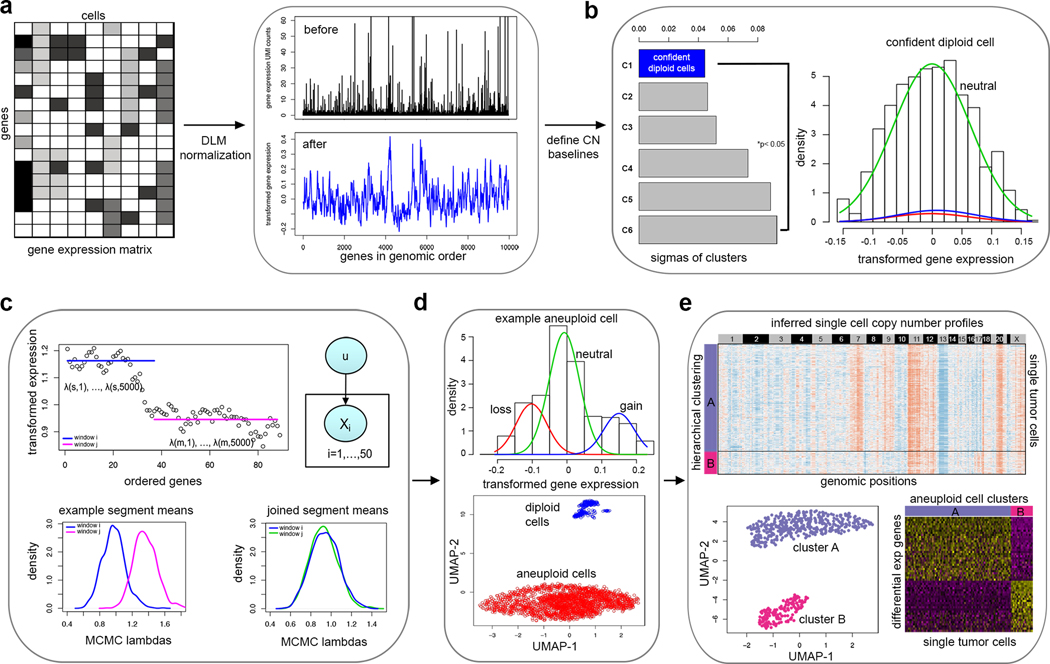
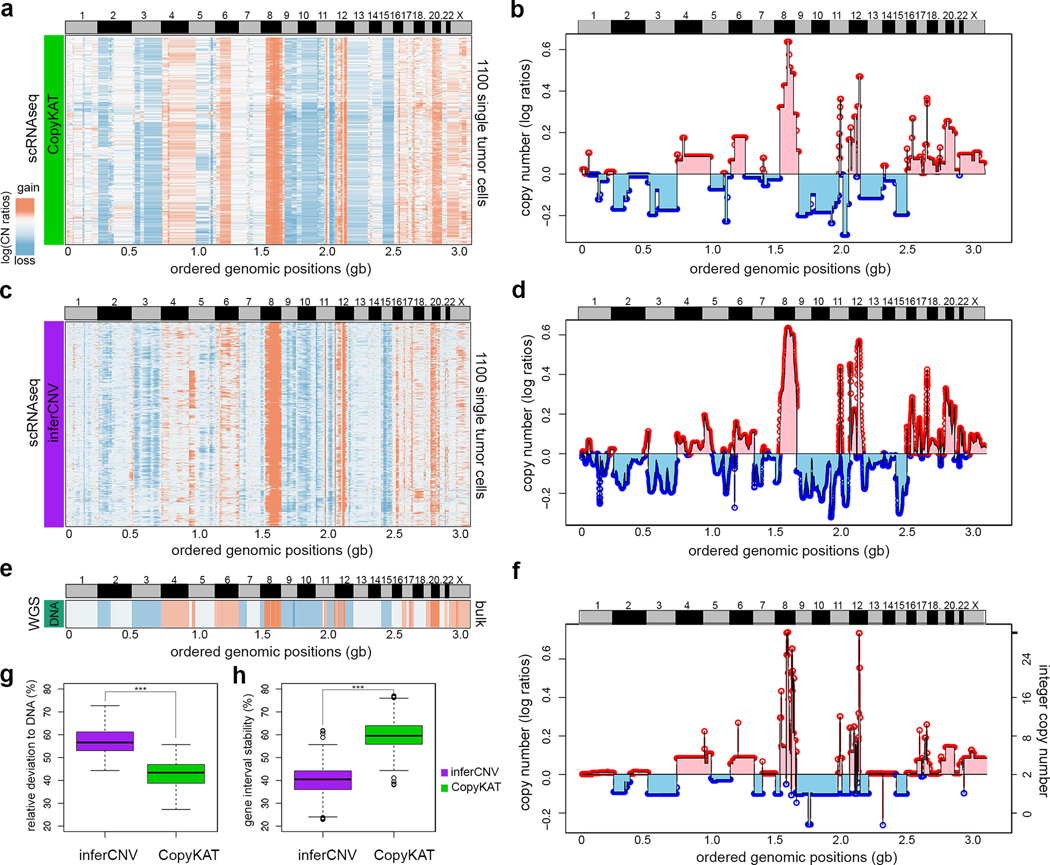
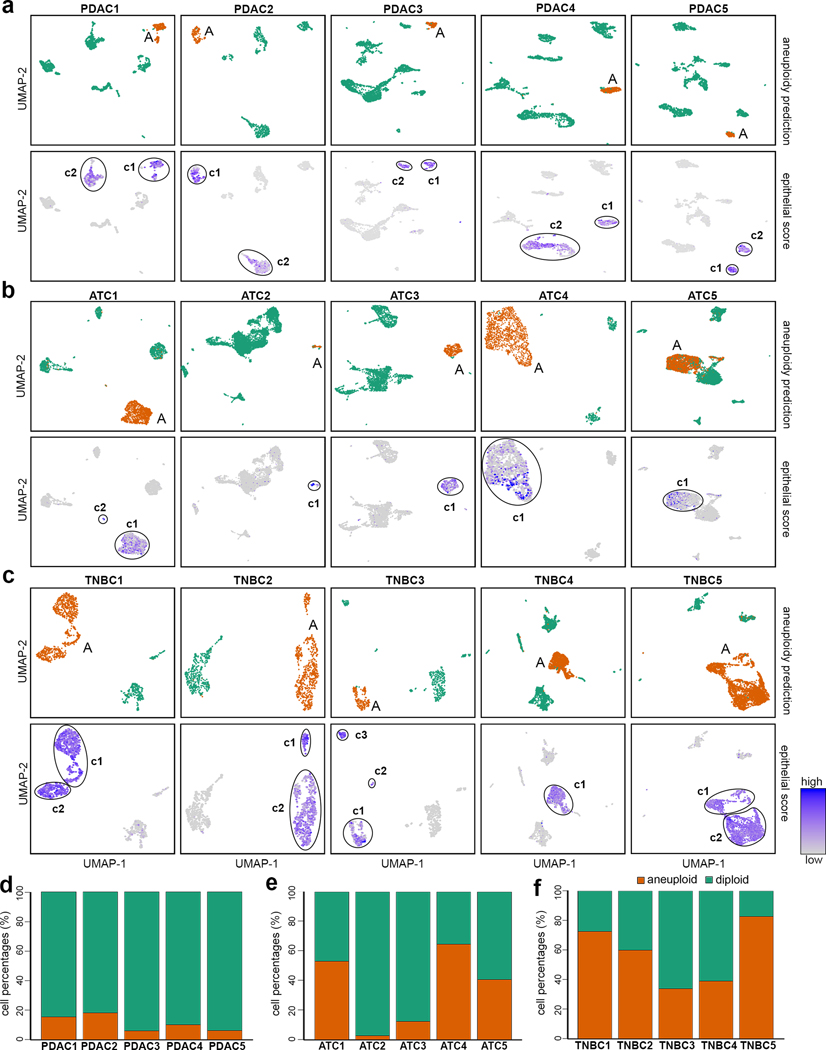
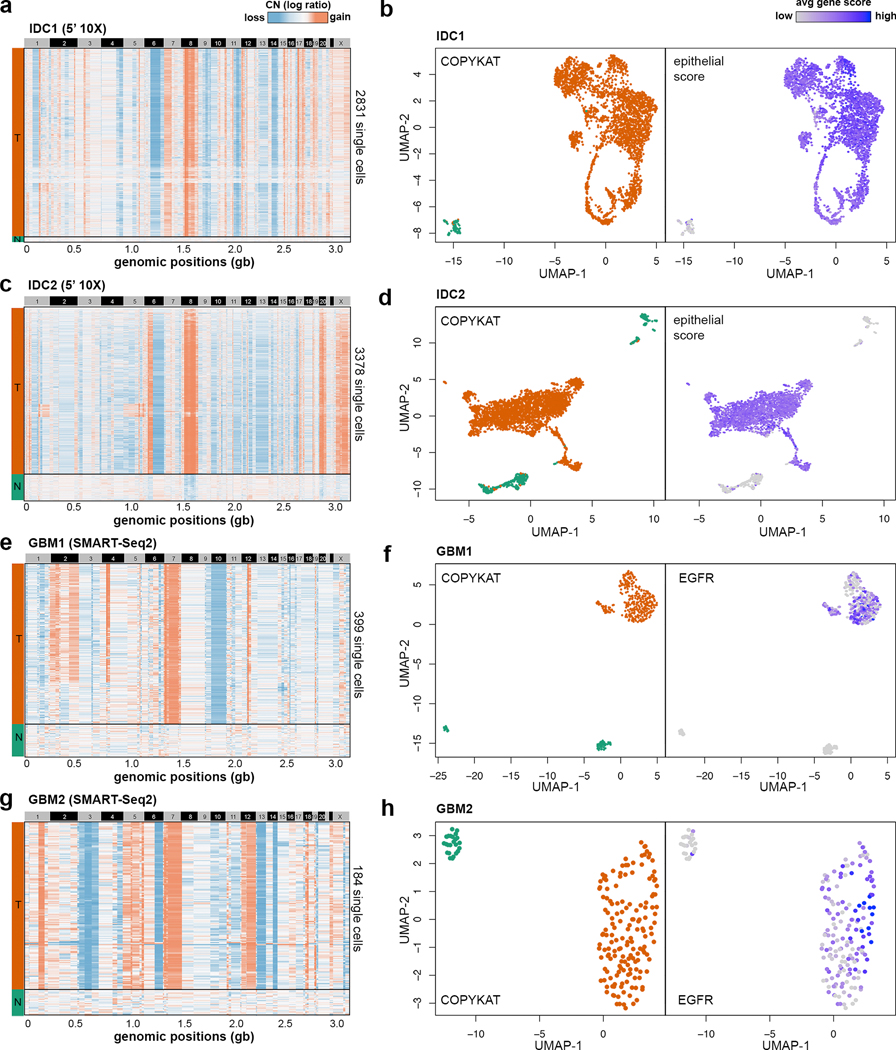
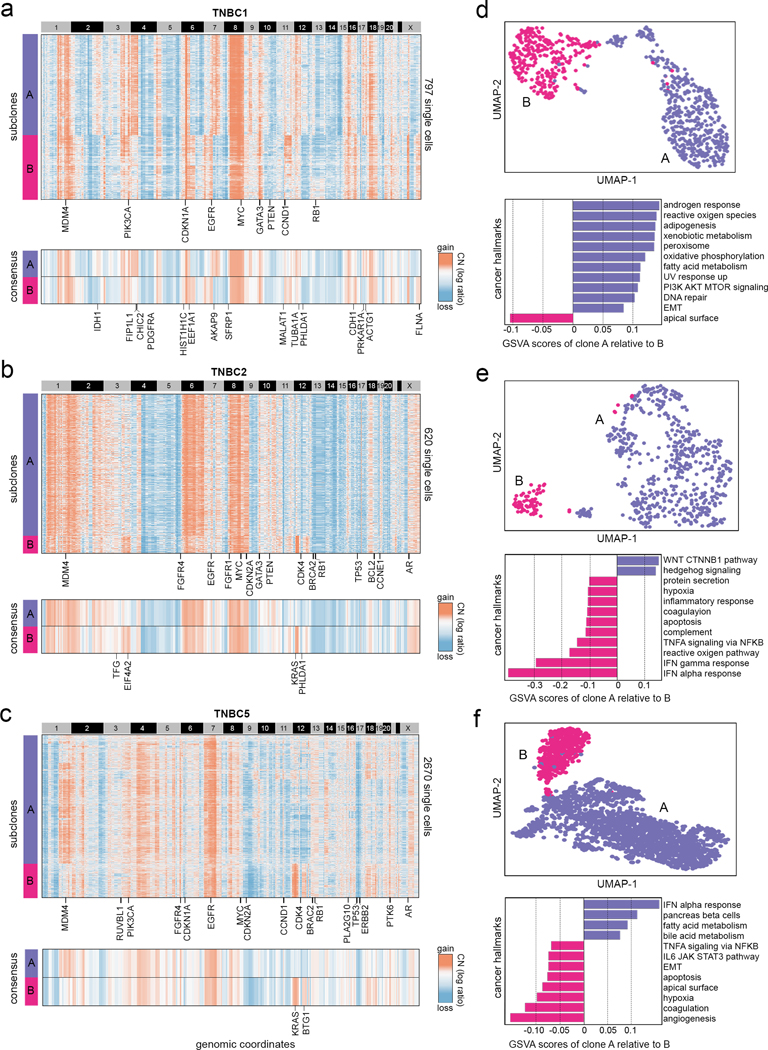
Single-cell transcriptomic analysis is widely used to study human tumors. However, it remains challenging to distinguish normal cell types in the tumor microenvironment from malignant cells and to resolve clonal substructure within the tumor. To address these challenges, we developed an integrative Bayesian segmentation approach called copy number karyotyping of aneuploid tumors (CopyKAT) to estimate genomic copy number profiles at an average genomic resolution of 5 Mb from read depth in high-throughput single-cell RNA sequencing (scRNA-seq) data. We applied CopyKAT to analyze 46,501 single cells from 21 tumors, including triple-negative breast cancer, pancreatic ductal adenocarcinoma, anaplastic thyroid cancer, invasive ductal carcinoma and glioblastoma, to accurately (98%) distinguish cancer cells from normal cell types. In three breast tumors, CopyKAT resolved clonal subpopulations that differed in the expression of cancer genes, such as KRAS, and signatures, including epithelial-to-mesenchymal transition, DNA repair, apoptosis and hypoxia. These data show that CopyKAT can aid in the analysis of scRNA-seq data in a variety of solid human tumors.


Figures

Figure 1 –
Figure 1 –. Overview of the CopyKAT analysis workflow
a, The CopyKAT workflow begins with a UMI count matrix to order genes by their genomic positions and uses the raw count matrix to perform log-Freeman Turkey Transformation to stabilize variance and smooth outliers using a polynomial dynamic linear model. b, A subset of normal cells is defined using integrative clustering and GMM method to infer the copy number baseline. c, Relative gene expression values in single cells are used for MCMC segmentation and segments are merged by KS testing. d, Aneuploid tumor and normal cell clusters are classified using a normal cell enrichment and GMM distribution tests. e, Clonal substructure of tumor cells are delineated by clustering and subclones are used for differential expression analysis.
Figure 2 –
Figure 2 –. Comparison of bulk DNA and single cell RNA copy number profiles
Copy number profiles estimated from scRNA-seq data for DCIS1 using CopyKAT and inferCNV. a, Clustered heatmap of 1,100 scRNA-seq copy number profiles estimated by CopyKAT. b, Line plot of the consensus of scRNA-seq copy number profiles estimated by CopyKAT where values are the median segments of all cells in the population. c, Clustered heatmap of 1,100 single tumor cell RNAseq copy number profiles estimated by inferCNV. d, Line plot of the consensus copy number profiles estimated by inferCNV. e, Heatmap of DNA copy number profile calculated from bulk DNA sequencing data from DCIS1, representing the ground truth reference profile. f, Line plot of bulk DNA-seq copy number profile from DCIS1. g, Boxplot comparing the relative distances of inferred copy numbers for all gene windows to the ground truth DNA copy number values for CopyKAT and inferCNV. h, Boxplot comparing the stability of gene interval sizes, showing the variation in averaged copy number values across different gene intervals. In g and h, ***, p-value < 0.001 of pair-wise two side t-tests comparing n= 12,167 gene windows between CopyKAT and inferCNV results. In both boxplots, the boxes are centered at median values, where the range of boxes are the inter quartile range (IQR) bounded by first quartile (Q1) and third quartile (Q3). The upper whiskers are located at the smaller of the data maximum and Q3 + 1.5 IQR, whereas the lower whiskers are located at the larger value of the data minimum and Q1 – 1.5 IQR.
Figure 3 –
Figure 3 –. Classification of cancer and normal cells in human tumors
Classification of tumor and normal cells by aneuploidy estimation with CopyKAT and mapping of the inferred profiles to scRNA-seq expression data from PDAC, ATC and TNBC tumors. a, UMAPs of scRNA-seq data from 5 PDAC tumors, with upper panels mapping the aneuploid clusters to the gene expression data, and the lower panels showing epithelial scores (average expression of four epithelial markers). Circles indicate expression clusters with high epithelial scores and include both tumor and normal epithelial cells. b, UMAPs of scRNA-seq data from 5 ATC tumors, with upper panels mapping the aneuploid clusters to the scRNA-seq gene expression data, and lower panels showing epithelial scores. c, UMAPs of 5 TNBC tumors, with upper panels mapping the aneuploid clusters to the scRNA-seq gene expression data, and the lower panels show epithelial scores. d-f, Stacked bar graph showing percentages of predicted aneuploid tumor cell and normal diploid cell purities of the d, PDAC tumors e, ATC tumors and f, TNBC tumors.
Figure 4 –
Figure 4 –. Classification of tumor and normal cells sequenced by different scRNA-seq technologies
Clustered heatmaps of single cell copy number profiles estimated by CopyKAT from 5’ scRNA-seq data for invasive breast cancer samples (a) IDC1 and (c) IDC2, and full-length SMART-seq2 scRNA-seq data for GBM sample (e) GBM1 and (g) GBM2. CopyKAT classification of diploid normal cells (N) and aneuploid cells tumor cells (T) are indicated on the left side annotation bars. High-dimensional UMAP embedding of scRNA-seq data with annotation of the inferred CopyKAT diploid and aneuploid copy number profiles for (b) IDC1, (d) IDC2, (f) GBM1 and (h) GBM2.
Figure 5 –
Figure 5 –. Clonal substructure of three triple-negative breast tumors
Clonal substructure of TNBC1, TNBC2, TNBC5 delineated by clustering single cell copy number profiles inferred from scRNA-seq data by CopyKAT. (a-c) The upper panels show the clustered heatmap of single cells of two major subclones in TNBC1, TNBC2 and TNBC5 with cancer genes annotated in clonal events, while the lower panels show consensus copy number profiles of the two major clones with subclonal cancer genes annotated. (d, e, f) Upper panels show UMAP projections of the scRNA-seq expression data of the two major clones in TNBC1, TNBC2 and TNBC5 with inferred aneuploid copy number profiles marked, while lower panels show GSVA analysis of the top 12 cancer hallmark signatures between the two major subclones.

References

References (for main text only)

    1. Peng J. et al. Single-cell RNA-seq highlights intra-tumoral heterogeneity and malignant progression in pancreatic ductal adenocarcinoma. Cell Res 29, 725–738 (2019). - PMC - PubMed
    1. Ma L. et al. Tumor Cell Biodiversity Drives Microenvironmental Reprogramming in Liver Cancer. Cancer Cell 36, 418–430 e416 (2019). - PMC - PubMed
    1. Patel AP et al. Single-cell RNA-seq highlights intratumoral heterogeneity in primary glioblastoma. Science 344, 1396–1401 (2014). - PMC - PubMed
    1. Macosko EZ et al. Highly Parallel Genome-wide Expression Profiling of Individual Cells Using Nanoliter Droplets. Cell 161, 1202–1214 (2015). - PMC - PubMed
    1. Klein AM et al. Droplet barcoding for single-cell transcriptomics applied to embryonic stem cells. Cell 161, 1187–1201 (2015). - PMC - PubMed

References (for Methods only)

    1. Liberzon A. et al. Molecular signatures database (MSigDB) 3.0. Bioinformatics 27, 1739–1740 (2011). - PMC - PubMed
    1. Martin AD, Quinn KM & Park JH MCMCpack: Markov Chain Monte Carlo in R.” Journal of Statistical Software. J Stat Softw 42, 22 (2011).
    1. Kim C. et al. Chemoresistance Evolution in Triple-Negative Breast Cancer Delineated by Single-Cell Sequencing. Cell 173, 879–893 e813 (2018). - PMC - PubMed
    1. Olshen AB, Venkatraman ES, Lucito R. & Wigler M. Circular binary segmentation for the analysis of array-based DNA copy number data. Biostatistics 5, 557–572 (2004). - PubMed
    1. Willenbrock H. & Fridlyand J. A comparison study: applying segmentation to array CGH data for downstream analyses. Bioinformatics 21, 4084–4091 (2005). - PubMed

Publication types

MeSH terms