. 2021 Jan;3(1):59-74.
doi: 10.1038/s42255-020-00331-1. Epub 2021 Jan 18.

Hepatocyte ATF3 protects against atherosclerosis by regulating HDL and bile acid metabolism

Affiliations

Hepatocyte ATF3 protects against atherosclerosis by regulating HDL and bile acid metabolism

Yanyong Xu et al. Nat Metab. 2021 Jan.

Abstract

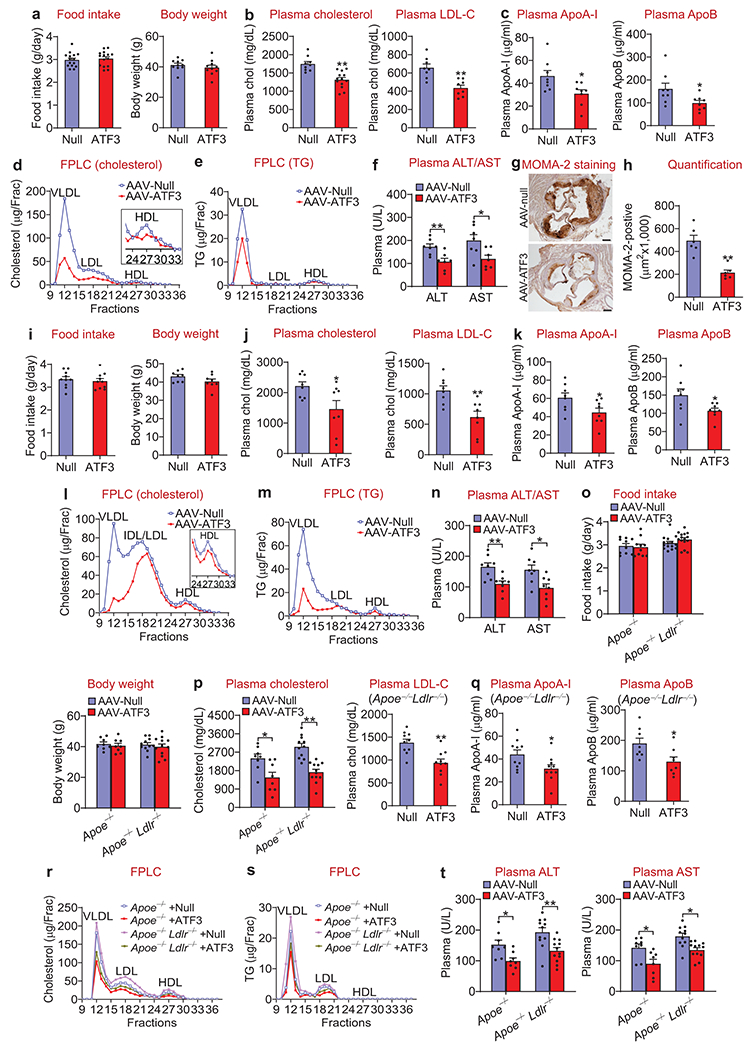
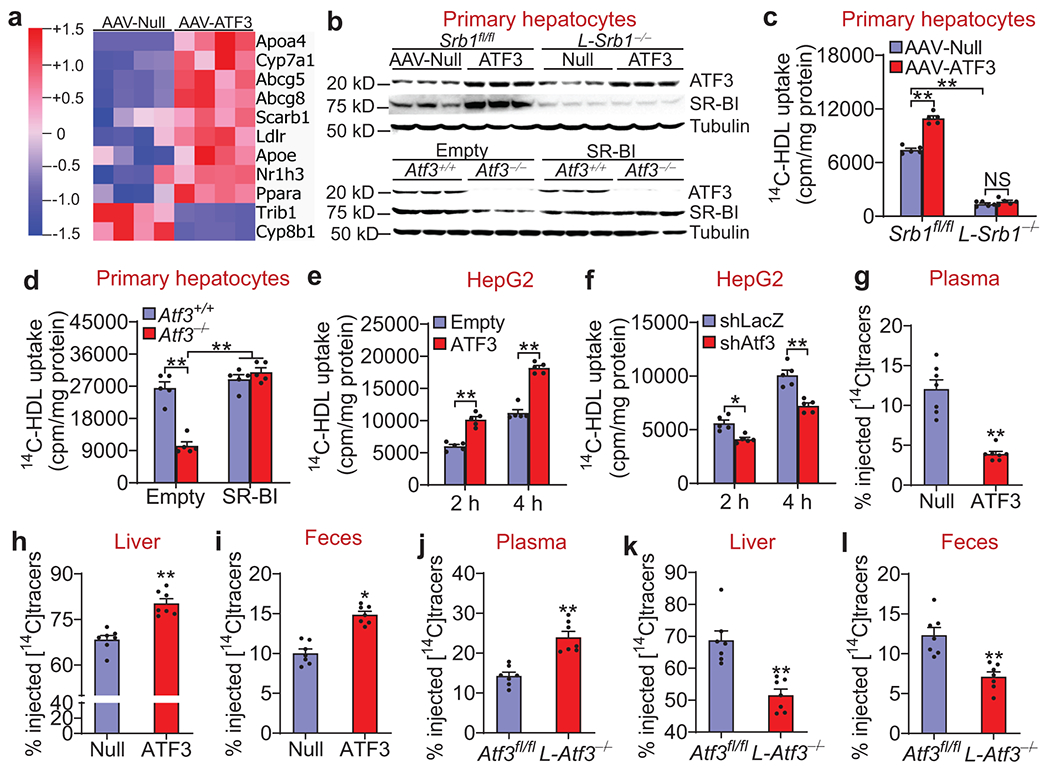
Activating transcription factor (ATF)3 is known to have an anti-inflammatory function, yet the role of hepatic ATF3 in lipoprotein metabolism or atherosclerosis remains unknown. Here we show that overexpression of human ATF3 in hepatocytes reduces the development of atherosclerosis in Western-diet-fed Ldlr-/- or Apoe-/- mice, whereas hepatocyte-specific ablation of Atf3 has the opposite effect. We further show that hepatic ATF3 expression is inhibited by hydrocortisone. Mechanistically, hepatocyte ATF3 enhances high-density lipoprotein (HDL) uptake, inhibits intestinal fat and cholesterol absorption and promotes macrophage reverse cholesterol transport by inducing scavenger receptor group B type 1 (SR-BI) and repressing cholesterol 12α-hydroxylase (CYP8B1) in the liver through its interaction with p53 and hepatocyte nuclear factor 4α, respectively. Our data demonstrate that hepatocyte ATF3 is a key regulator of HDL and bile acid metabolism and atherosclerosis.


Conflict of interest statement

Competing Interests

The authors declare no competing financial/non-financial interests.

Figures

Extended Data Fig. 1
Extended Data Fig. 1. Hepatic ATF3 is repressed by stress signaling
a. Mouse or human primary hepatocytes were treated with vehicle (Veh), 500 nM angiotensin II (A-II), 500 nM dexamethasone (DEX), 250 μM forskolin (FSK), 100 nM glucagon (GCG) or 250 nM hydrocortisone (HC) (n=4). After 24 h, protein levels were determined. **P<1E-6 for Veh versus A-II, DEX, FSK, GCG or HC, respectively for mouse or human primary hepatocytes. b. HepG2 cells were treated with vehicle, angiotensin II (A-II), dexamethasone (DEX), forskolin (FSK), glucagon (GCG) or hydrocortisone (HC) as described in (a) (n=4). mRNA levels were determined after 6 h (top panel) and protein levels were determined after 24 h (bottom panel). **P=0.000019, 3E-6, 1E-6, 0.0031 or 2E-6 for Veh versus A-II, DEX, FSK, GSK or HC, respectively. c-f. Mouse primary hepatocytes (c; n=4), human primary hepatocytes (d; n=3 for Veh group and n=4 for cAMP group) or HepG2 cells (e and f; n=4) were treated with vehicle (Veh) or 500 μM db-cAMP (cAMP). mRNA levels were analyzed after 6 h (c-e) and protein levels in HepG2 cells were analyzed after 24 h (f). In (c), **P=0.0034 versus Veh. In (d), **P=0.000051 versus Veh. In (e), *P=0.01 versus Veh. g and h. Mouse (g) or human (h) primary hepatocytes were pretreated with 10 μM H89 or 1 μM PKI 14-22 (PKI) for 2 h, followed by treatment with hydrocortisone (HC) for 6 h. mRNA levels were determined (n=4). In (g), **P<1E-6 for HC versus Veh, HC+H89 or HC+PKI, respectively. In (h), *P=0.04 for HC versus Veh, and **P=0.0061 or 0.0016 for HC versus HC+H89 or HC+PKI, respectively. i. C57BL/6J mice were i.p. injected with either vehicle or hydrocortisone (HC; 2mg/kg) once a day for 7 days (n=8). Plasma cholesterol lipoprotein profile was analyzed by FPLC. j-l. Atf3fl/fl mice and hepatocyte-specific Atf3−/− (L-Atf3−/−) mice were i.p. injected with either vehicle or hydrocortisone (HC; 2mg/kg) once a day for 7 days. Hepatic mRNA levels were determined (j; n=8 for the L-Atf3−/−+HC group, and n=7 for 3 other groups). Plasma cholesterol lipoprotein profile was analyzed (k). Plasma ALT (left panel) and ASL (right panel) (l) levels were determined (n=6 for the L-Atf3−/−+Vehicle group, and n=7 for 3 other groups). In (j), for Atf3 expression, **P=0.002 or 0.000072 for Atf3fl/fl+HC versus Atf3fl/fl+Veh or L-Atf3−/−+HC, respectively. For Scarb1 expression, **P=2E-6 or <1E-6 for Atf3fl/fl+HC versus Atf3fl/fl+Veh or L-Atf3−/−+HC, respectively. For Cyp7a1 expression, **P=1E-6 or <1E-6 for Atf3fl/fl+HC versus Atf3fl/fl+Veh or L-Atf3−/−+HC, respectively. For Cyp8b1 expression, **P=0.0014 or 2E-6 for Atf3fl/fl+HC versus Atf3fl/fl+Veh or L-Atf3−/−+HC, respectively. In (l), for ALT, P=0.94 or 0.89 for vehicle versus HC for Atf3fl/fl or L-Atf3−/−mice, respectively. For AST, P=0.98 or 0.99 for vehicle versus HC for Atf3fl/fl or L-Atf3−/−mice, respectively. m. C57BL/6J mice were i.p. injected with either vehicle or hydrocortisone (HC; 2mg/kg) once a day for 7 days (n=8). The correlation between hepatic Atf3 mRNA and plasma HDL-C levels was determined. All the data are expressed as mean±SEM. All the data points are biological replicates. A two-tailed Student’s t-test (c-e), one-way (a, b, g, h) or two-way (j, l) ANOVA with Turkey’s post hoc test for multiple comparisons, or a two-tailed Pearson correlation analysis (m) was used for statistical analysis. NS, not significant.
Extended Data Fig. 2
Extended Data Fig. 2. Over-expression of hepatic ATF3 reduces plasma HDL-C levels and bile acid hydrophobicity indices in C57BL/6J mice
C57BL/6J mice were i.v. injected with AAV8-ALB-Null or AAV8-ALB-hATF3 (n=8). After 2 months, mice were euthanized. a-d. Plasma levels of triglyceride (TG), total cholesterol (TC) (a), HDL-C, non-HDL-C (b), ALT and AST (c) were quantified. Plasma cholesterol lipoprotein profile was analyzed by FPLC (d). Chol, cholesterol. In (a), **P=0.00024 versus AAV-Null for TC. In (b), **P=0.00009 versus AAV-Null for HDL. In (c), **P=0.0024 versus AAV-Null for ALT, and P=0.079 for AAV-Null versus AAV-ATF3 for AST. e. RNA sequencing was performed using liver samples (n=4 per group). The volcano plot shows many hepatic genes were differentially regulated by ATF3. f-i. Hepatic mRNA levels were quantified by qRT-PCR (f; n=8). Hepatic proteins were analyzed by Western blot assays (g, h) and protein levels were quantified (i; n=6). In (f), **P=0.000013, 0.00014, 0.00053, 0.00015 or 0.0021 versus AAV-Null for Cyp7a1, Cyp8b1, Scarb1, Ldlr and Apoe expression, respectively. In (i), *P=0.022 versus AAV-Null for LDLR, and **P=0.00026, 0.0012, 0.0046, 0.004 or 0.0032 versus AAV-Null for CYP7A1, CYP8B1, ATF3 and ApoE expression, respectively. j and k. Plasma total bile acid (BA) levels (j; n=8) and biliary BA composition (k; n=8 for the Null group, and n=7 for the ATF3 group) were determined. TUDC, tauroursodeoxycholic acid. TCA, taurocholic acid. TCDCA, taurochenodeoxycholic acid. In (j), *P=0.025 versus Null. In (k), *P=0.012 and **P=0.0027 or 0.0006 versus AAV-Null for TCDCA, TUDC or TCA, respectively. l. HepG2 cells were transfected with the pGL3-Cyp7a1 or pGL3-Cyp8b1 luciferase promoters together with pCMV-ATF3 (n=8) or pCMV-Empty (n=7). After 36 h, relative luciferase units (RLU) were determined. **P=0.0063 or 0.00018 versus CMV-Empty for pGL3-Cyp7a1 or pGL3-Cyp8b1, respectively. All the data are expressed as mean±SEM. All the data points are biological replicates. A two-tailed Student’s t-test (a, c, f, i-l) or two-way ANOVA with Turkey’s post hoc test for multiple comparisons (b) was used for statistical analysis.
Extended Data Fig. 3
Extended Data Fig. 3. Over-expression of hepatic ATF3 reduces plasma HDL-C and LDL-C levels and increases plasma bile acid levels in db/db mice
db/db mice were i.v. injected with AAV8-ALB-Null or AAV8-ALB-hATF3 (n=8). After 2 months, mice were euthanized. a-d. Plasma total cholesterol (Chol) (a), HDL-C, non-HDL-C (b), ALT and AST (c) levels were determined. Plasma cholesterol lipoprotein profile was analyzed by FPLC (d). In (a), *P=0.01 versus Null. In (b), **P=0.0012 or 0.000021 versus AAV-Null for HDL or non-HDL, respectively. In (c), *P=0.02 or 0.027 versus AAV-Null for ALT or AST, respectively. e. Plasma bile acid (BA) levels. *P=0.042 versus Null. f and g. Hepatic proteins were analyzed by Western blot assays (f) and protein levels were quantified (g). **P=3E-6, 8E-6, 0.00074, 7E-6, 0.0039 or 0.0065 versus AAV-Null for CYP7A1, CYP8B1, ATF3, SR-BI, LDLR or ApoE expression, respectively. All the data are expressed as mean±SEM. All the data points are biological replicates. A two-tailed Student’s t-test (a, c, e, g) or two-way ANOVA with Turkey’s post hoc test for multiple comparisons (b) was used for statistical analysis.
Extended Data Fig. 4
Extended Data Fig. 4. Loss of hepatocyte ATF3 increases plasma HDL-C levels and reduces plasma bile acid levels
Atf3fl/fl mice and hepatocyte-specific Atf3−/− (L-Atf3−/−) mice were fed a chow diet (n=6). a-d. Plasma total cholesterol (Chol) (a), HDL, non-HDL-C (b), ALT and AST (c) levels were determined. Plasma cholesterol lipoprotein profile was analyzed by FPLC (d). In (a), **P=0.0036 versus Atf3fl/fl. In (b), **P=0.00075 for Atf3fl/fl versus L-Atf3−/− for HDL. In (c), P=0.49 or 0.28 for Atf3fl/fl versus L-Atf3−/− for ALT or AST, respectively. e. Plasma bile acid (BA) levels. *P=0.019 versus Atf3fl/fl. f and g. Hepatic proteins were analyzed by Western blot assays (f) and protein levels were quantified (g). **P=2E-6, 0.000099, 0.000035 or 0.000376 versus Atf3fl/fl for ATF3, CYP7A1, CYP8B1 or SR-BI expression, respectively. h. Hepatic mRNA levels were determined by qRT-PCR. P=0.12, 0.25 or 0.1 for Atf3fl/fl versus L-Atf3−/− for Srebp2, Hmgcr, or Hmgcs expression, respectively. All the data are expressed as mean±SEM. All the data points are biological replicates. A two-tailed Student’s t-test (a, c, e, g, h) or two-way ANOVA with Turkey’s post hoc test for multiple comparisons (b) was used for statistical analysis.
Extended Data Fig. 5
Extended Data Fig. 5. ATF3 regulates HDL-C and LDL-C uptake by hepatocytes
a and b. Scarb1fl/fl (Srb1fl/fl) or hepatocyte-specific Scarb1−/− (L-Srb1−/−) mice were i.v. injected with AAV8-ALB-Null or AAV8-ALB-hATF3 (a). In a separate study, Atf3+/+ or Atf3−/− mice were i.v. injected with 0.5x10⁹ pfu Ad-Empty or Ad-SR-BI (b). After 10 days, primary hepatocytes were isolated from these mice. HDL uptake was carried out after hepatocytes were treated for 4 h with HDL labeled with [14C]cholesteryl Oleate (14C-HDL) (n=5) (a, b). In (a), *P=4E-6 or <1E-6 for Srb1fl/fl+AAV-Null versus Srb1fl/fl+AAV-ATF3 or L-Srb1−/−+AAV-Null, respectively. In (b), **P<1E-6 for Atf3−/−+Ad-Empty versus Atf3+/++Ad-Empty, Atf3+/++Ad-SR-BI or Atf3−/−+Ad-SR-BI. c and d. Ldlr+/+ mice and Ldlr−/− mice were i.v. injected with AAV8-ALB-Null or AAV8-ALB-hATF3. After 10 days, primary hepatocytes were isolated. LDL uptake was carried out after hepatocytes were treated for 2 h (c, left panel) or 4 h (c, right panel) with LDL labeled with [14C]cholesteryl Oleate (14C-LDL) (n=5). Western blot assays were performed (d, left panel) and LDLR protein levels were quantified (d, right panel). In (c, left panel), **P=0.00002 or <1E-6 for Ldlr+/++AAV-Null versus Ldlr+/++AAV-ATF3 or Ldlr−/−+AAV-Null, respectively. In (c, right panel), *P=0.000011 or <1E-6 for Ldlr+/++AAV-Null versus Ldlr+/++AAV-ATF3 or Ldlr−/−+AAV-Null, respectively. In (d), *P=0.0038 versus Null. e. Mouse primary hepatocytes were isolated from Atf3fl/fl or L-Atf3−/− mice. LDL uptake was carried out after hepatocytes were treated for 2 or 4 h with LDL labeled with [14C]cholesteryl Oleate (14C-LDL) (n=5). P=0.36 or 0.58 for Atf3+/+versus Atf3−/− at 2 h or 4 h, respectively. f and g. HepG2 cells were infected with Ad-Empty or Ad-ATF3 for 24 h. Western blot assays (f) and LDL uptake (g) were performed as described above (n=5). In (f), *P=0.04 versus Empty. In (g), **P=0.0016 or 0.000013 for Ad-Empty versus Ad-ATF3 at 2 h or 4 h, respectively. h and i. HepG2 cells were infected with Ad-shLacZ or Ad-shATF3 for 24 h. Protein levels were determined by Western blot assays (h, left and right panels). LDL uptake was performed as described above (n=5) (i). In (h), **P=0.00003 or 0.0015 versus shLacZ for ATF3 or LDLR expression, respectively. In (i), *P=0.011 and **P=0.00003 for shLacZ versus shAtf3 at 2 h or 4 h, respectively. All the data are expressed as mean±SEM. All the data points are biological replicates. A two-tailed Student’s t-test (d, f, h) or two-way ANOVA with Turkey’s post hoc test for multiple comparisons (a-c, e, g, i) was used for statistical analysis. NS, not significant.
Extended Data Fig. 6
Extended Data Fig. 6. Regulation of SR-BI expression by ATF3 or p53
a. C57BL/6J mice were i.v. injected with Ad-Empty or Ad-hP53 (n=4). After 7 days, hepatic proteins were analyzed by Western blot assays (top panel) and protein levels were quantified (bottom panel). **P=0.0015 versus Empty. b-d. p53fl/fl mice and hepatocyte-specific p53−/− (L-p53−/−) mice were i.v. injected with AAV8-ALB-Null or AAV8-ALB-hATF3 (n=7 per group). After 30 days, plasma cholesterol lipoprotein profile was analyzed (b). Plasma non-HDL-C (c), ALT and AST (d) levels were quantified. In (c), P=0.232 or 0.687 for AAV-Null versus AAV-ATF3 for p53fl/fl or L-p53−/− mice, respectively. In (d), for ALT, *P=0.048 and **P=0.00025 for AAV-Null versus AAV-ATF3 for p53fl/fl or L-p53−/− mice, respectively; for AST, P=0.547 or 0.97 for AAV-Null versus AAV-ATF3 for p53fl/fl or L-p53−/− mice, respectively. e and f. p53fl/fl mice and L-p53−/− mice were i.p. injected with either vehicle or hydrocortisone (HC; 2mg/kg) once a day for 7 days (n=7 per group). Plasma cholesterol lipoprotein profile (e) and plasma ALT and AST levels (f) were determined. For ALT, P=0.825 or 0.998 for Vehicle versus HC for p53fl/fl or L-p53−/− mice, respectively. For AST, P=0.936 or 0.941 for Vehicle versus HC for p53fl/fl or L-p53−/− mice, respectively. g. HepG2 cells were transfected with pGL3-SR-BI-Luc constructs together pCMV-ATF3 or pCMV-Empty (n=8). After 36 h, relative luciferase units (RLU) were determined. **P=2E-6, 0.000017, 1.5E-7, 6.9E-8, 4E-7 or 1E-7 for CMV-Empty versus CMV-ATF3 for −0.29, −1.0, −0.8, −0.6, −0.4 or −0.2 kb SR-BI-Luc, respectively. h. EMSA was performed to determine the binding site for ATF3 in the proximal SR-BI promoter. Lane 1: free probe. Lane 2: binding assay for testing if ATF3 protein bound to the SR-BI DNA oligonucleotides. Lanes 3-10: competition assays using SR-BI DNA oligonucleotides containing a wild-type or mutant p53 binding site. Lanes 11 and 12: supershift assays in the presence of IgG or an ATF3 antibody. This experiment was repeated once with similar results. All the data are expressed as mean±SEM. All the data points are biological replicates. A two-tailed Student’s t-test (a, g) or two-way ANOVA with Turkey’s post hoc test for multiple comparisons (c, d, f) was used for statistical analysis.
Extended Data Fig. 7
Extended Data Fig. 7. Hepatic ATF3 regulates fat absorption and VLDL secretion
a. C57BL/6J mice were i.v. injected with AAV8-ALB-Null (n=8) or AAV8-ALB-hATF3 (n=7 per group). Fat absorption was performed by gavaging mice with [3H]triolein. Plasma radioactivity at indicated time points was measured. **P=0.0019 for AAV-Null versus AAV-ATF3. b. Fat absorption was performed in Atf3fl/fl mice and L-Atf3−/− mice as described in (a) (n=8). **P=0.0011 for Atf3fl/fl versus L-Atf3−/− mice. c. C57BL/6J mice were i.v. injected with AAV8-ALB-Null or AAV8-ALB-hATF3 (n=7). VLDL secretion was performed. **P=0.0062 for AAV-Null versus AAV-ATF3. d. VLDL secretion was performed in Atf3fl/fl mice and L-Atf3−/− mice (n=8). **P=0.000056 for Atf3fl/fl versus L-Atf3−/− mice. All the data are expressed as mean±SD. All the data points are biological replicates. Two-way ANOVA with Turkey’s post hoc test for multiple comparisons was used for statistical analysis (a-d).
Extended Data Fig. 8
Extended Data Fig. 8. ATF3 induces hepatic LXRα expression and regulates cholesterol or fat absorption independent of FXR signaling
a. C57BL/6J mice were i.v. injected with AAV8-ALB-Null, AAV8-ALB-ATF3, and/or AAV8-ALB-CYP8B1 (n=8). After two months, plasma ALT and AST levels were determined. For ALT, *P=0.042 and **P=0.001 for AAV-Null versus AAV-ATF3 for CYP8B1 and Null groups, respectively. For AST, P=0.35 or 0.39 AAV-Null versus AAV-ATF3 for Null or CYP8B1 groups, respectively. b and c. Hnf4αfl/fl mice and L-Hnf4αfl/fl mice were i.v. injected with AAV8-ALB-Null or AAV8-ALB-hATF3 (n=6). After two months, plasma ALT and AST levels (b) and plasma cholesterol lipoprotein profile (c) were determined. In (b), for ALT, *P=0.011 and **P=0.0097 for AAV-Null versus AAV-ATF3 for L-Hnf4α−/− and Hnf4αfl/fl mice, respectively. For AST, P=0.93 or 0.16 for AAV-Null versus AAV-ATF3 for Hnf4αfl/fl or L-Hnf4α−/− mice, respectively. d. HepG2 cells were transfected with pGL3-Cyp8b1-Luc constructs together pCMV-ATF3 or pCMV-Empty (n=6 per group). After 36 h, relative luciferase units (RLU) were determined. **P<1E-6 for CMV-Empty versus CMV-ATF3 for −1.1, −0.9, −0.85, −0.75 or −0.66 kb Cyp8b1-Luc, respectively. e. C57BL/6J mice were i.v. injected with AAV8-ALB-Null or AAV8-ALB-hATF3 (n=6 per group). After 2 months, hepatic or intestinal mRNA levels were determined. **P=0.0096 or 0.0019 for AAV-Null versus AAV-ATF3 for Cyp7a1 or Fgf15, respectively. f. C57BL/6J mice were i.v. injected with AAV8-ALB-Null, AAV8-ALB-hATF3 and/or AAV8-ALB-CYP8B1 (n=7 for the Null or ATF3 groups, n=6 for the CYP8B1 group, and n=8 for the ATF3+CYP8B1 group). After two months, hepatic mRNA levels were determined. For Lxrα, **P=1E-6 or 0.00011 for AAV-ATF3 versus AAV-Null or AAV-ATF3+AAV-CYP8B1, respectively. g and h. Fxr+/+ mice and Fxr−/− mice were i.v. injected with AAV8-ALB-Null or AAV8-ALB-hATF3 (n=6). After 2 months, intestinal cholesterol (g) or fat (h) absorption was determined. In (g), *P=0.033 for Fxr+/++AAV-Null versus Fxr−/−+AAV-Null, and **P=0.00007 or <1E-6 for AAV-Null versus AAV-ATF3 for Fxr+/+ or Fxr−/− mice, respectively. In (h), **P<1E-6 for AAV-Null versus AAV-ATF3 for Fxr+/+ or Fxr−/− mice, respectively. The data are expressed as mean±SEM (a, b, d-g) or mean±SD (h). All the data points are biological replicates. A two-tailed Student’s t-test (e) and one-way (f) or two-way (a, b, d, g, h) ANOVA with Turkey’s post hoc test for multiple comparisons were used for statistical analysis. NS, not significant.
Extended Data Fig. 9
Extended Data Fig. 9. Over-expression of hepatocyte ATF3 lowers plasma lipid levels in Apoe−/−, Ldlr−/− or Apoe−/−Ldlr−/− mice
a-h. Three-months-old Apoe−/− mice were i.v. injected with AAV8-ALB-Null or AAV8-ALB-hATF3, and then fed a Western diet for 3 months. Food intake (n=15) and body weight (n=10) were measured (a). Plasma total cholesterol (n=9 for the Null group, n=13 for the ATF3 group), LDL-C (n=8) (b), ApoA-I, ApoB (c; n=8), cholesterol lipoprotein profile (d), triglyceride (TG) lipoprotein profile (e), and plasma ALT or AST levels (f; n=7) were determined. Aortic roots were stained using an MOMA-2 antibody (g) and MOMA-2-positive areas were quantified (h; n=6). In (d), the inset shows HDL fraction. In (a), P=0.62 or 0.41versus Null for food intake or body weight, respectively. In (b), **P=0.0002 or 0.0008 versus Null for plasma cholesterol or LDL-C, respectively. In (c), *P=0.023 or 0.048 versus Null for plasma ApoA-I or ApoB, respectively. In (f), *P=0.023 versus Null for AST, and **P=0.0057 versus Null for ALT. In (h), **P=0.0011 versus Null. i-n. Ldlr−/− mice were i.v. injected with AAV8-ALB-Null or AAV8-ALB-hATF3, and then fed a Western diet for 3 months (n=8). Food intake and body weight were measured. Plasma total cholesterol, LDL-C (j), ApoA-I, ApoB (k), cholesterol lipoprotein profile (l), triglyceride lipoprotein profile (m), and ALT or AST levels (n) were determined. In (i), P=0.59 or 0.13 versus Null for food intake or body weight, respectively. In (j), *P=0.035 versus Null for cholesterol, and **P=0.0035 versus Null for LDL-C. In (k), *P=0.04 or 0.046 versus Null for plasma ApoA-I or ApoB, respectively. In (n), *P=0.011 versus Null for AST, and **P=0.0045 versus Null for ALT. o-t. Nine-weeks-old Apoe−/− mice or Apoe−/−Ldlr−/− mice were i.v. injected with AAV8-ALB-Null or AAV8-ALB-hATF3, and then fed a Western diet for 3 months. Food intake (n=10 for Apoe−/−+AAV-Null or ATF3/Apoe−/−+AAV-ATF3, n=15 for Apoe−/−Ldlr−/−+AAV-Null or Apoe−/−Ldlr−/−+AAV-ATF3) and body weight (n=8 for Apoe−/−+AAV-Null or Apoe−/−+AAV-ATF3, n=11 for Apoe−/−Ldlr−/−+AAV-Null, and n=12 for Apoe−/−Ldlr−/−+AAV-ATF3) were measured (o). Plasma total cholesterol (p, left panel; n=8 for Apoe−/−+AAV-Null or Apoe−/−+AAV-ATF3, n=11 for Apoe−/−Ldlr−/−+AAV-Null, and n=12 for Apoe−/−Ldlr−/−+AAV-ATF3), LDL-C (p, right panel; n=10), ApoA-I (q, left panel; n=10), ApoB (q, right panel; n=8), cholesterol lipoprotein profile (r), triglyceride lipoprotein profile (s), and ALT or AST levels (t; n=8 for Apoe−/−+AAV-Null or Apoe−/−+AAV-ATF3, n=11 for Apoe−/−Ldlr−/−+AAV-Null, and n=12 for Apoe−/−Ldlr−/−+AAV-ATF3) were determined. In (o), P=0.288 or 0.93 for AAV-Null versus AAV-ATF3 for food intake or body weight, respectively. In (p), for plasma cholesterol, *P=0.013 or **P=0.000066 for AAV-Null versus AAV-ATF3 for Apoe−/− or Apoe−/−Ldlr−/− mice, respectively; for plasma LDL-C, **P=0.0011 versus Null. In (q), *P=0.031 or 0.022 versus Null for plasma ApoA-I or ApoB, respectively. In (t), for ALT, *P=0.025 and **P=0.0021 for AAV-Null versus AAV-ATF3 for Apoe−/− and Apoe−/−Ldlr−/− mice, respectively. For AST, *P=0.019 or 0.015 for AAV-Null versus AAV-ATF3 for Apoe−/− or Apoe−/−Ldlr−/− mice, respectively. All the data are expressed as mean±SEM. All the data points are biological replicates. A two-tailed Student’s t-test (a-c, f, h-k, n, p (LDL-C), q) or two-way ANOVA with Turkey’s post hoc test for multiple comparisons (o, p (total cholesterol), t) was used for statistical analysis.
Extended Data Fig. 10
Extended Data Fig. 10. Loss of hepatic ATF3 increases plasma lipid levels
a. C57BL/6J (WT) mice, Ldlr−/− mice or Apoe−/− mice (on a C57BL/6J background) were fed a standard chow diet (CD) or Western diet (WD) for 3 months (n=8). Hepatic proteins were analyzed by Western blot assays (left panel) and protein levels were quantified (right panel). **P=0.0048, 0.000089 or 0.000062 for WT+CD versus WT+WD, Ldlr−/−+WD or Apoe−/−+WD, respectively. b-e. Six-weeks-old Atf3fl/flApoe−/− mice and L-Atf3−/−Apoe−/− mice were fed a Western diet for 3 months (n=8). Plasma cholesterol levels were analyzed (b). Plasma cholesterol (c) or TG (d) lipoprotein profiles were determined. Plasma ALT or AST levels were quantified (e). In (b), **P=0.0016 versus Atf3fl/flApoe−/−. In (e), *P=0.032 and **P=0.0001 for Atf3fl/flApoe−/− versus L-Atf3−/−Apoe−/− for AST and ALT, respectively. All the data are expressed as mean±SEM. All the data points are biological replicates. A two-tailed Student’s t-test (b, e) or one-way ANOVA with Turkey’s post hoc test for multiple comparisons (a) was used for statistical analysis.
Figure 1.
Figure 1.. Hydrocortisone represses hepatic ATF3 expression via activation of the cAMP-PKA pathway
a-c. Mouse (a) or human (b) primary hepatocytes were treated with vehicle (Veh), 500 nM angiotensin II (A-II), 500 nM dexamethasone (DEX), 250 μM forskolin (FSK), 100 nM glucagon (GCG) or 250 nM hydrocortisone (HC) (n=4). mRNA (a, b) and protein (c) levels were determined after 6 or 24 h, respectively. In (a), **P=0.0003, 0.0062, 0.0002, 0.0002 or 0.0002 for Veh versus A-II, DEX, FSK, GCG or HC treatments, respectively. In (b), **P<1E-6 for Veh versus A-II, DEX, FSK, GCG or HC treatments, respectively. d and e. Mouse or human primary hepatocytes were treated with vehicle or 500 μM dibutyryl-cAMP (db-cAMP) for 24 h (n=4). Immunoblotting was performed (d) and protein levels were quantified (e). **P=0.0003 or 0.00011 versus db-cAMP in mouse or human primary hepatocytes, respectively. f and g. Mouse or human primary hepatocytes were pretreated with 10 μM H89 or 1 μM PKI 14-22 (PKI) for 2 h, followed by treatment of hydrocortisone for 24 h. Protein levels were determined (f, g) (n=4). For mouse primary hepatocytes, *P=0.036 and **P=6E-6, 0.00001, 0.00077 or 0.000011 for HC versus Veh, H89, PKI, HC+H89 or HC+PKI, respectively. For human primary hepatocytes, *P=0.038 for HC versus Veh, and **P<0.0001 for HC versus H89, PKI, HC+H89 or HC+PKI, respectively. h-j. C57BL/6J mice were i.p. injected with either vehicle or hydrocortisone (2 mg/kg) once a day for 7 days (n=8). Plasma cholesterol (chol) (h, left panel) and bile acid (BA) (h, right panel) levels were analyzed. Hepatic protein levels were determined (i, j). In (h), **P<1E-6 or **P=0.0077 for HC versus vehicle treatments for plasma HDL-C or BA levels, respectively. In (j), **P=0.00098, 0.00064, 0.0016 or <1E-6 versus control for SR-BI, CYP7A1, CYP8B1 or ATF3 expression, respectively. k. Human primary hepatocytes were pretreated with 10 μM H89 or 1 μM PKI 14-22 for 2 h, followed by treatment with hydrocortisone for 24 h. mRNA levels were determined (n=4). For ATF3 expression, *P=0.043 and **P=0.0061 or 0.0016 for HC versus Veh, HC+89 or HC+PKI treatments, respectively. For SR-BI expression, **P=0.0017, 0.0003 or 0.000057 for HC versus Veh, HC+H89 or HC+PKI treatments, respectively. For CYP7A1 expression, **P=0.00037, 0.00012 or 0.000028 for HC versus Veh, HC+H89 or HC+PKI treatments, respectively. For CYP8B1 expression, *P=0.011 or 0.027, and **P=0.0071 for HC versus Veh, HC+H89 or HC+PKI treatments, respectively. l-o. Atf3fl/fl mice and hepatocyte-specific Atf3−/− (L-Atf3−/−) mice were i.p. injected with either vehicle or hydrocortisone (2mg/kg) once a day for 7 days. Hepatic protein (l, m; n=3) and plasma HDL-C (n; n=8 for L-Atf3−/−+HC and n=7 for 3 other groups) and BA (o; n=8 for L-Atf3−/−+HC and n=7 for 3 other groups) levels were determined. In (m), for ATF3 expression, **P=0.001 or 0.000015 for Atf3fl/fl+Veh versus Atf3fl/fl+HC or L-Atf3−/−+Veh, respectively; for SR-BI expression, *P=0.04 and **P=0.0014 for Atf3fl/fl+Veh versus Atf3fl/fl+HC or L-Atf3−/−+Veh, respectively; for CYP7A1 expression, *P=0.023 or 0.017 for Atf3fl/fl+Veh versus Atf3fl/fl+HC or L-Atf3−/−+Veh, respectively; for CYP8B1 expression, **P=0.0031 or 0.0049 for Atf3fl/fl+Veh versus Atf3fl/fl+HC or L-Atf3−/−+Veh, respectively. In (n), **P=6E-6 or 0.00012 for Atf3fl/fl+vehicle versus Atf3fl/fl+HC or L-Atf3−/−+vehicle, respectively. In (o), **P=0.00064 or 0.00037 for Atf3fl/fl+vehicle versus Atf3fl/fl+HC or L-Atf3−/−+vehicle, respectively. p. Hepatic ATF3 mRNA and plasma HDL-C levels were analyzed in subjects with normal liver tissues (normal) (n=10) or patients with autoimmune hepatitis (AIH) and/or primary biliary cholangitis (PBC) (n=14). *P=0.015 and **P=0.0057 for normal versus AIH/PBC for plasma HDL-C levels and ATF3 mRNA levels, respectively. q. The correlation between hepatic ATF3 mRNA levels and plasma HDL-C levels in humans. Light blue dots stand for subjects with normal liver tissues (n=10). Red dots stand for patients with AIH and/or PBC (n=14). The expression of ATF3 in the normal liver tissues (r=−0.82, P=0.0036) or all the liver tissues (normal plus AIH/PBC) (r=−0.58, P=0.0029) shows negative correlation with plasma HDL-C levels. All the data are expressed as mean±SEM. All the data points are biological replicates. A two-tailed Student’s t-test (e, h (BA), j, p), one-way (a, b, g, h (cholesterol), k) or two-way (m-o) ANOVA with Turkey’s post hoc test for multiple comparisons, or a two-tailed Pearson correlation analysis (q) was used for statistical analysis. NS, not significant. See also Extended Data Fig. 1 and Supplementary Table 1.
Figure 2.
Figure 2.. Hepatocyte ATF3 regulates HDL uptake via SR-BI
a. C57BL/6J mice were i.v. injected with AAV8-ALB-Null (AAV-Null) or AAV8-ALB-hATF3 (AAV-ATF3). After 2 months, total hepatic RNA was isolated for RNA sequencing (n=4). The heatmap shows that some lipid metabolism-related genes were up- or down-regulated by ATF3. b-d. Scarb1fl/fl (Srb1fl/fl) or hepatocyte-specific Scarb1−/− (L-Srb1−/−) mice were i.v. injected with AAV8-ALB-Null or AAV8-ALB-hATF3 (b, top panel and c). In a separate study, Atf3+/+ or Atf3−/− mice were i.v. injected with 0.5x10⁹ pfu Ad-Empty or Ad-SR-BI (b, bottom panel and d). After 10 days, primary hepatocytes were isolated from these mice. Western blot assays were performed (n=3) (b). HDL uptake was carried out after hepatocytes were treated for 2 h with HDL labeled with [14C]cholesteryl Oleate (14C-HDL) (n=5) (c, d). In (c), **P<1E-6 for Srb1fl/fl+AAV-Null versus Srb1fl/fl+AAV-ATF3 or L-Srb1−/−+AAV-Null. In (d), **P=1E-6 for Atf3−/−+Ad-Empty versus Atf3+/++Ad-Empty, and **P<1E-6 for Atf3−/−+Ad-Empty versus Atf3+/++Ad-SR-BI or Atf3−/−+Ad-SR-BI. e and f. HepG2 cells were infected for 36 h with Ad-Empty or Ad-ATF3 (e), or Ad-shLacZ or Ad-shAtf3 (f). HDL uptake was determined as described above (n=5). In (e), **P=0.000015 or <1E-6 for Ad-Empty versus Ad-ATF3 at 2 h or 4 h, respectively. In (f), *P=0.022 and **P=0.000054 for shellacs Ad-shLacZ versus Ad-shAtf3 at 2 h or 4h, respectively. g-i. C57BL/6J mice were i.v. injected with AAV8-ALB-Null (Null) or AAV8-ALB-hATF3 (ATF3) (n=7). After 3 months, mice were i.v. injected with 14C-HDL. The radioactivity in the plasma (g), liver (h) and feces (i) were determined 24 h after injection with 14C-HDL. **P=0.0003, 0.00008 or 0.000017 versus Null for plasma (g), liver (h) or feces (i), respectively. j-l. Atf3fl/fl mice and hepatocyte-specific Atf3−/− (L-Atf3−/−) mice were i.v. injected with 14C-HDL (n=7). After 24 h, the radioactivity in the plasma (j), liver (k) and feces (l) were determined. **P=0.0002, 0.0006 or 0.0010 versus Atf3fl/fl for plasma (j), liver (k) or feces (l), respectively. All the data are expressed as mean±SEM. All the data points are biological replicates. A two-tailed Student’s t-test (g-l) or two-way ANOVA with Turkey’s post hoc test for multiple comparisons (c-f) was used for statistical analysis. NS, not significant. See also Extended Data Figs. 2–5 and Supplementary Data 1.
Figure 3.
Figure 3.. Hepatocyte ATF3 regulates SR-BI expression and plasma HDL-C levels via interaction with p53
a. Co-IP was performed using liver lysates over-expressing ATF3 and an ATF3 antibody or IgG (n=3). Western blot assays were performed to determine protein levels. b-d. p53fl/fl mice and hepatocyte-specific p53−/− (L-p53−/−) mice were i.v. injected with AAV8-ALB-Null (AAV-Null) or AAV8-ALB-hATF3 (AAV-ATF3) (n=7). After 30 days, plasma HDL-C levels were quantified (b). Hepatic proteins were analyzed by Western blot assays (c) and protein levels were quantified (d; n=3). In (b), **P=0.00044 for AAV-Null versus AAV-ATF3 for p53fl/fl. In (d), for p53 expression, **P=0.0044 for p53fl/fl+AAV-Null versus L-p53−/−+AAV-Null; for ATF3 expression, *P=0.013 or 0.036 for p53fl/fl+AAV-Null versus p53fl/fl+AAV-ATF3 or L-p53−/−+AAV-Null versus L-p53−/−+AAV-ATF3, respectively; for SR-BI expression, **P=0.00074 for p53fl/fl+AAV-Null versus p53fl/fl+AAV-ATF3. e and f. p53fl/fl mice and L-p53−/− mice were i.p. injected with either vehicle or hydrocortisone (HC; 2mg/kg) once a day for 7 days (n=7). Plasma HDL-C (e) and hepatic mRNA levels (f) were determined. In (e), **P=0.0068 for vehicle versus HC treatments. In (f), for p53 expression, **P=0.000158 or <1E-6 for p53fl/fl+Veh versus p53fl/fl+HC or L-p53−/−+Veh; for Scarb1 expression, **P=0.000014 for p53fl/fl+Veh versus p53fl/fl+HC. g and h. HepG2 cells were transfected with pGL3-SR-BI-Luc constructs together with plasmids over-expressing p53 (pCMV-p53) (g, h) or ATF3 (pCMV-ATF3) (h) (n=5 for (g) and n=6 for (h)). After 36 h, relative luciferase units (RLU) were determined. In (h), mutation of the p53 binding site abolished the induction of SR-BI promoter activity by p53 or ATF3. In (g), *P=0.044 and **P=3E-6, 0.000022, 0.00014, 0.0031 or 5E-7 for CMV-Empty versus CMV-p53 for −0.4, −2.9, −1.0 kb, −0.8 kb, −0.6 kb or −0.2 kb SR-BI-Luc, respectively. In (h), **P<1E-6 for CMV-Null versus CMV-p53 or CMV-ATF3 for WT SR-BI-Luc. i. EMSA was performed to determine the p53 binding site in the SR-BI promoter. Lane 1: free probe. Lane 2 shows p53 protein bound to SR-BI DNA oligonucleotides. Lanes 3-8: competition assays using SR-BI DNA oligonucleotides containing a wild-type (lanes 3-5) or mutant (lanes 6-8) p53 binding site. Lanes 9 and 10: supershift assay in the presence of IgG or a p53 antibody. This experiment was repeated once with similar results. j and k. ChIP assays were performed using liver lysates over-expressing p53 (j) or ATF3 (k). A p53 antibody (j) or an ATF3 antibody (k) was used for immunoprecipitation (n=4). qRT-PCR was used to quantify the DNA enrichment on the SR-BI promoter. In (j), **P=7E-6 for IgG versus p53 Ab for the SR-BI promoter (−141 to −57 bp). In (k), **P=0.002 for IgG versus ATF3 Ab for the SR-BI promoter (−141 to −57 bp). All the data are expressed as mean±SEM. All the data points are biological replicates. A two-tailed Student’s t-test (g, j, k) or two-way ANOVA with Turkey’s post hoc test for multiple comparisons (b, d, e, f, h) was used for statistical analysis. NS, not significant. See also Extended data Fig. 6.
Figure 4.
Figure 4.. Hepatocyte ATF3 is indispensable for regulating intestinal fat and cholesterol absorption as well as macrophage reverse cholesterol transport
a-c. C57BL/6J mice were i.v. injected with AAV8-ALB-Null (Null) or AAV8-ALB-hATF3 (ATF3). Intestinal cholesterol (chol) absorption (a; n=8 for the Null group and n=7 for the ATF3 group), intestinal fat absorption (b; n=7) and macrophage reverse cholesterol transport (c; n=8 for the Null group and n=7 for the ATF3 group) were determined. In (a), **P=0.0036 versus Null. In (b), **P<1E-6 for AAV-Null versus AAV-ATF3. In (c), **P=0.004, 0.0029 or 0.000018 versus Null for plasma, liver or feces, respectively. d-f. Intestinal cholesterol absorption (d), intestinal fat absorption (e) and macrophage reverse cholesterol transport (f) were determined in Atf3fl/fl mice and L-Atf3−/− mice (n=8). In (d), **P=0.0021 versus Atf3fl/fl. In (e), **P<1E-6 for Atf3fl/fl versus L-Atf3−/−. In (f), *P=0.011 and **P=0.0041 or 0.0045 versus Atf3fl/fl for feces, plasma or liver, respectively. The data are expressed as mean±SEM (a, c, d, f) or mean±SD (b, e). All the data points are biological replicates. A two-tailed Student’s t-test (a, c, d, f) or one-way ANOVA with Turkey’s post hoc test for multiple comparisons (b, e) was used for statistical analysis. See also Extended data Fig. 7.
Figure 5.
Figure 5.. Hepatocyte ATF3 inhibits intestinal cholesterol and fat absorption by an ATF3-HNF4α-CYP8B1 pathway
a-c. C57BL/6J mice were i.v. injected with AAV8-ALB-Null (Null), AAV8-ALB-hATF3 and/or AAV8-ALB-CYP8B1 (CYP8B1). After two months, hepatic proteins were immunoblotted (a, left panel) and protein levels were quantified (a, right panel) (n=3). Intestinal cholesterol absorption (b; n=7) or fat absorption (c; n=7 for the Null or Null+ATF3 groups, and n=8 for the Null+CYP8B1 or ATF3+CYP8B1 groups) was determined. In (a), for CYP7A1 expression, **P=0.0032 or 0.0012 for AAV-ATF3 versus AAV-Null or AAV-ATF3+CYP8B1, respectively; for CYP8B1 expression, **P=0.000067 or 0.00016 for AAV-ATF3 versus AAV-Null or AAV-ATF3+CYP8B1, respectively. In (b), **P=0.0003, 6E-6 or 0.0037 for AAV-ATF3+Null versus AAV-Null, AAV-Null+CYP8B1 or AAV-ATF3+CYP8B1, respectively. In (c), P<1E-6 for AAV-ATF3+Null versus AAV-Null, AAV-Null+CYP8B1, or AAV-ATF3+CYP8B1, respectively. d and e. Hnf4αfl/fl mice or hepatocyte-specific Hnf4α−/− (L-Hnf4α−/−) mice were i.v. injected with AAV8-ALB-Null (Null) or AAV8-ALB-hATF3 (ATF3) (n=6). Western blot assays were performed (d) and protein levels were quantified (e; n=3). NS, not significant. For ATF3 expression, **P=0.00012 or 0.0019 for Hnf4αfl/fl+AAV-Null versus Hnf4αfl/fl+AAV-ATF3 or L-Hnf4α−/−+AAV-Null versus L-Hnf4α−/−+AAV-ATF3, respectively. Also, **P=0.004 or 0.00085 for Hnf4αfl/fl+AAV-Null versus Hnf4αfl/fl+AAV-ATF3 for CYP7A1 or CYP8B1 expression, respectively. f. pGL3-Cyp8b1-Luc plasmids were co-transfected with pCMV-Empty or pCMV-ATF3 plasmids into HepG2 cells (n=6). After 36 h, relative luciferase units (RLU) were determined. NS, not significant. *P=0.038 or 0.027 and **P=0.00027 versus CMV-Empty for −0.4 kb, −0.19 kb or −0.5 kb Cyp8b1-Luc, respectively. g. The pGL3-Cyp8b1-(−0.5 kb) plasmid containing the wild-type (WT) or mutant HNF4α binding site was co-transfected with pCMV-Empty or pCMV-ATF3 into HepG2 cells (n=8). After 36 h, RLU was determined. **P<1E-6 versus CMV-Empty for WT Cyp8b1-Luc. h. The pGL3-Cyp8b1-(−0.5kb) plasmid was co-transfected with pCMV-Empty, pCMV-ATF3 and/or pCMV-HNF4α DN (expressing dominant negative HNF4α) into HepG2 cells (n= 8). After 36 h, RLU was determined. DN, dominant negative. **P=0.0022 versus CMV-Empty for the control group. i. Co-IP was performed using liver lysates over-expressing ATF3 and an ATF3 antibody (n=3). Western blot assays were performed using antibodies against ATF3 or HNF4α. j. ChIP assay was performed using liver lysates over-expressing ATF3 and an ATF3 antibody (n=4). qRT-PCR was used to quantify the DNA enrichment on the Cyp8b1 promoter. *P=0.029 for Cyp8b1-Luc (−108 to +15 bp). k. C57BL/6J mice were i.v. injected with AAV8-ALB-Null (Null), AAV8-ALB-hATF3 and/or AAV8-ALB-CYP8B1. After two months, mice were i.v. injected with Ad-shLacZ or Ad-shLxrα (n=5). Hepatic mRNA levels were determined after 7 days. For Lxrα expression, **P<1E-6 or **P=0.000047 for AAV-Null+shLacZ versus AAV-ATF3+shLacZ or AAV-Null+shLxrα, respectively. For Cyp7a1 expression, *P=0.015 or **P=3E-16 for AAV-Null+shLacZ versus AAV-Null+shLxrα or AAV-ATF3+shLacZ, respectively. For Cyp8b1 expression, **P=0.000023 for AAV-Null+shLacZ versus AAV-ATF3+shLacZ, or **P<1E-6 for AAV-Null+shLxrα versus AAV-ATF3+shLxrα. l. Fxr+/+ mice and Fxr−/− mice were i.v. injected with AAV8-ALB-Null or AAV8-ALB-hATF3 (n=6). After 2 months, hepatic mRNA levels were quantified. For Cyp7a1 expression, **P=0.00025 or 0.000042 for AAV-Null versus AAV-ATF3 in Fxr+/+ or Fxr−/− mice, respectively. For Cyp8b1 expression, *P=0.03 or **P<1E-6 for AAV-Null versus AAV-ATF3 in Fxr+/+ or Fxr−/− mice, respectively. All the data are expressed as mean±SEM (a, b, e-h, j-l) or mean±SD (c). All the data points are biological replicates. One-way (a) or two-way (b, c, e-h, j-l) ANOVA with Turkey’s post hoc test for multiple comparisons was used for statistical analysis. NS, not significant. See also Extended Data Fig. 8.
Figure 6.
Figure 6.. Over-expression of human ATF3 in hepatocytes attenuates the development of atherosclerosis independent of ApoE or LDLR
a-i. Three-months-old Apoe−/− mice were i.v. injected with either AAV8-ALB-Null or AAV8-ALB-hATF3. After 3 months, mice were euthanized. Hepatic protein levels were determined by Western blot assays (a) and then quantified (b; n=4). Plasma levels of HDL-C (c; n=7), non-HDL-C (d; n=7) or triglycerides (TG) (e; n=9 for the Null group, and n=13 for the ATF3 group) were measured. Representative images of en face aortas are presented (f) and the lesion size of en face aortas was determined (g; n=12). Representative images of aortic roots are shown (h) and the lesion size of aortic roots was quantified (i; n=13). In (b), *P=0.02 and **P=0.001, 0.002. 0.0037 or 0.0061 versus Null for CYP7A1, ATF3, SR-BI, CYP8B1 or LDLR expression, respectively. In (c), **P=0.0008 versus Null. In (d), **P=0.0037 versus Null. In (e), **P=0.0099 versus Null. In (g), **P=3E-6 versus Null. In (i), **P=9E-6 versus Null. j-r. Ldlr−/− mice were i.v. injected with AAV8-ALB-Null or AAV8-ALB-hATF3, and then fed a Western diet for 3 months (n=8). Hepatic protein levels were determined by Western blot assays (j) and then quantified (k; n=4). Plasma levels of HDL-C (l), non-HDL-C (m) or TG (n) were measured. Representative images of en face aortas are presented (o) and the lesion size of en face aortas was analyzed (p). Representative images of aortic roots are shown (q) and the lesion size of aortic roots was quantified (r). In (k), *P=0.032 and **P=0.00075, 0.0036, 0.0013 or 0.0043 versus Null for CYP8B1, ATF3, SR-BI, CYP7A1 or ApoE expression, respectively. In (l), **P=0.0017 versus Null. In (m), **P=0.000042 versus Null. In (n), *P=0.014 versus Null. In (p), **P=0.0002 versus Null. In (r), *P=0.01 versus Null. s-z. Nine-weeks-old Apoe−/− mice and Apoe−/−Ldlr−/− mice were i.v. injected with AAV8-ALB-Null or AAV8-ALB-hATF3, and then fed a Western diet for 3 months. Hepatic proteins were analyzed by Western blot assays (s) and protein levels were quantified (t; n=3). Plasma levels of HDL-C (u, left panel), non-HDL-C (u, right panel) or TG (v) were measured (for u and v, n=8 for Apoe−/−+Null or Apoe−/−+ATF3, n=11 for Apoe−/−Ldlr−/−+Null, and n=12 for Apoe−/−Ldlr−/−+ATF3). Representative images of en face aortas are presented (w) and the lesion size of en face aortas was analyzed (x; n=8 for Apoe−/−+Null or Apoe−/−+ATF3, n=11 for Apoe−/−Ldlr−/−+Null, and n=12 for Apoe−/−Ldlr−/−+ATF3). Representative images of aortic roots are shown (y) and the lesion size of aortic roots was quantified (z; n=8 for Apoe−/−+Null or Apoe−/−+ATF3, n=11 for Apoe−/−Ldlr−/−+Null, and n=12 for Apoe−/−Ldlr−/−+ATF3). In (t), for ATF3 expression, *P=0.012 and **P=0.00069 for Null versus ATF3 for Apoe−/−Ldlr−/− mice and Apoe−/− mice, respectively; for SR-BI expression, *P=0.019 and **P=0.0069 for Null versus ATF3 for Apoe−/−Ldlr−/− mice and Apoe−/− mice, respectively; for LDLR expression, **P=0.00051 for Null versus ATF3 for Apoe−/− mice or 0.00043 for Apoe−/− +Null versus Apoe−/−Ldlr−/−+Null; for CYP7A1 expression, **P=0.0036 or 0.0034 for Null versus ATF3 for Apoe−/− mice or Apoe−/−Ldlr−/− mice, respectively; for CYP8B1 expression, **P=0.0014 or 0.00046 for Null versus ATF3 for Apoe−/− mice or Apoe−/−Ldlr−/− mice, respectively. In (u), for HDL-C, **P=0.0037 or 0.0003 for Null versus ATF3 for Apoe−/− or Apoe−/−Ldlr−/− mice, respectively; for non-HDL-C, *P=0.035 for Null versus ATF3 for Apoe−/− mice or 0.017 for Apoe−/−+Null versus Apoe−/−Ldlr−/− +Null, and **P=0.000024 for Null versus ATF3 for Apoe−/−Ldlr−/− mice. In (v), **P=0.0083, 0.0024 or <1E-6 for Null versus ATF3 for Apoe−/− mice, Apoe−/−+Null versus Apoe−/−Ldlr−/−+Null mice, or Null versus ATF3 for Apoe−/−Ldlr−/− mice, respectively. In (x), *P=0.013 for Null versus ATF3 for Apoe−/− mice, and **P=0.0015 or <1E-6 for Apoe−/−+Null versus Apoe−/−Ldlr−/−+Null mice, or Null versus ATF3 for Apoe−/−Ldlr−/− mice, respectively. In (z), *P=0.048 and **P=0.00021 for Null versus ATF3 for Apoe−/− mice and Apoe−/−Ldlr−/− mice, respectively. All the data are expressed as mean±SEM. All the data points are biological replicates. A two-tailed Student’s t-test (b-e, g, i, k-n, p, r) or two-way ANOVA with Turkey’s post hoc test for multiple comparison (t-v, x, z) was used for statistical analysis. In (h, q, y), scale bars represent 200 μm. See also Extended Data Fig. 9.
Figure 7.
Figure 7.. Ablation of hepatocyte ATF3 aggravates the development of atherosclerosis
a-i. Six-weeks-old Atf3fl/flApoe−/− mice and L-Atf3−/−Apoe−/− mice were fed a Western diet for 3 months (n=8). Hepatic proteins were analyzed by Western blot assays (a) and protein levels were quantified (b; n=4). Plasma levels of HDL-C (c), non-HDL-C (d) or TG (e) were measured. Representative images of en face aortas are shown (f) and the lesion size of en face aortas was determined (g). Representative images of aortic roots are presented (h) and the lesion size of aortic roots was quantified (i). In (b), *P=0.044 and **P=0.00086, 0.000041 or 0.0024 versus Atf3fl/flApoe−/− for CYP7A1, ATF3, SR-BI or CYP8B1 expression, respectively. In (c), *P=0.013 versus Atf3fl/flApoe−/−. In (d), **P=0.0005 versus Atf3fl/flApoe−/−. In (e), *P=0.038 versus Atf3fl/flApoe−/−. In (g), **P=0.0011 versus Atf3fl/flApoe−/−. In (i), *P=0.0207 versus Atf3fl/flApoe−/−. j. A model for hepatocyte ATF3 to regulate the development of atherosclerosis. Hepatocyte ATF3 induces SR-BI expression via interaction with p53 and represses CYP8B1 expression via interaction with HNF4α. In addition, ATF3 also induces hepatic CYP7A1 expression via LXRα, and LDLR expression. As a result, over-expression of hepatocyte ATF3 increases cholesterol uptake from circulation and reduces intestinal cholesterol/fat absorption. These changes result in increased macrophage reverse cholesterol transport and protection against atherosclerosis. In contrast, loss of hepatocyte ATF3 has opposite effects. Interestingly, stress-related hormones, such as cortisol, inhibit hepatocyte ATF3 expression. All the data are expressed as mean±SEM. All the data points are biological replicates. A two-tailed Student’s t-test (b-e, g, i) was used for statistical analysis. In (h), scale bars represent 200 μm. See also Extended Data Fig. 10.

References

    1. Linton MF, Tao H, Linton EF & Yancey PG SR-BI: A Multifunctional Receptor in Cholesterol Homeostasis and Atherosclerosis. Trends Endocrinol Metab 28, 461–472, doi:10.1016/j.tem.2017.02.001 (2017). - DOI - PMC - PubMed
    1. Cuchel M & Rader DJ Macrophage reverse cholesterol transport: key to the regression of atherosclerosis? Circulation 113, 2548–2555, doi:113/21/2548 [pii] 10.1161/CIRCULATIONAHA.104.475715 (2006). - DOI - PubMed
    1. Rosenson RS et al. Cholesterol efflux and atheroprotection: advancing the concept of reverse cholesterol transport. Circulation 125, 1905–1919, doi:10.1161/CIRCULATIONAHA.111.066589 (2012). - DOI - PMC - PubMed
    1. Zhang Y et al. Hepatic expression of scavenger receptor class B type I (SR-BI) is a positive regulator of macrophage reverse cholesterol transport in vivo. J Clin Invest 115, 2870–2874 (2005). - PMC - PubMed
    1. Braun A et al. Loss of SR-BI expression leads to the early onset of occlusive atherosclerotic coronary artery disease, spontaneous myocardial infarctions, severe cardiac dysfunction, and premature death in apolipoprotein E-deficient mice. Circ Res 90, 270–276 (2002). - PubMed

Publication types

MeSH terms