Clinical Trial
. 2021 Jan;11(1):e265.
doi: 10.1002/ctm2.265.

Reiterative infusions of MSCs improve pediatric osteogenesis imperfecta eliciting a pro-osteogenic paracrine response: TERCELOI clinical trial

Affiliations
Clinical Trial

Reiterative infusions of MSCs improve pediatric osteogenesis imperfecta eliciting a pro-osteogenic paracrine response: TERCELOI clinical trial

Arantza Infante et al. Clin Transl Med. 2021 Jan.

Abstract

Background: Osteogenesis imperfecta (OI) is a rare genetic disease characterized by bone fragility, with a wide range in the severity of clinical manifestations. The majority of cases are due to mutations in the COL1A1 or COL1A2 genes, which encode type I collagen. Mesenchymal stem cells (MSCs), as the progenitors of the osteoblasts, the main type I collagen secreting cell type in the bone, have been proposed and tested as an innovative therapy for OI with promising but transient outcomes.

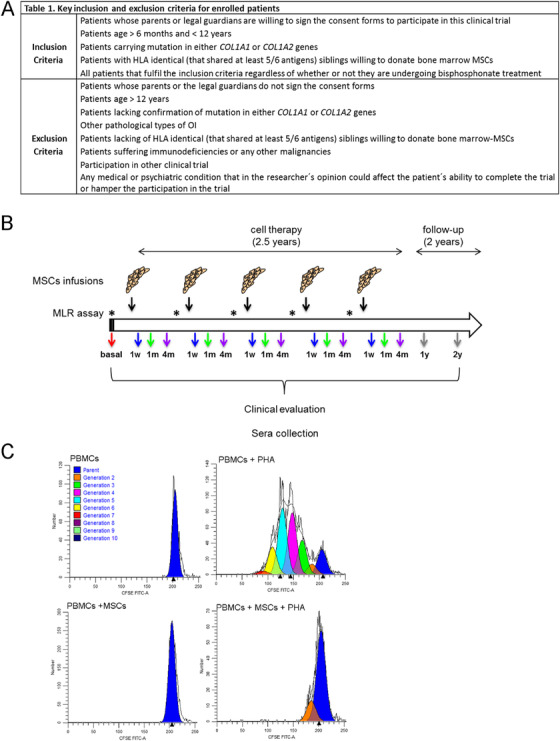
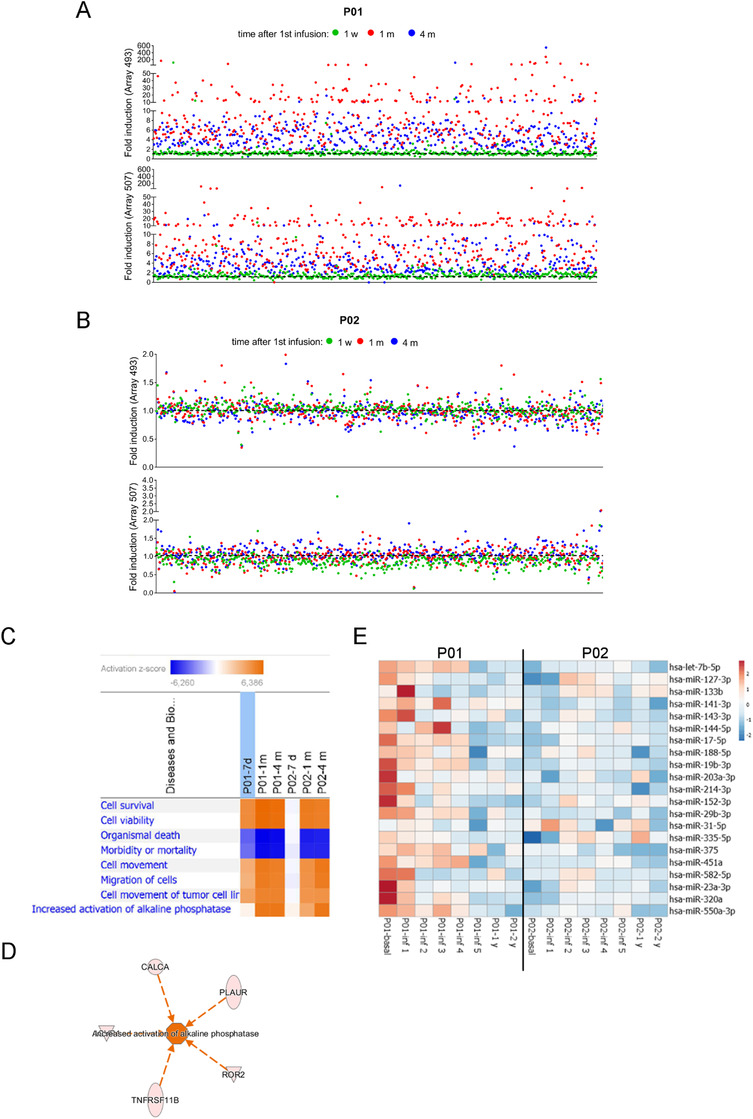
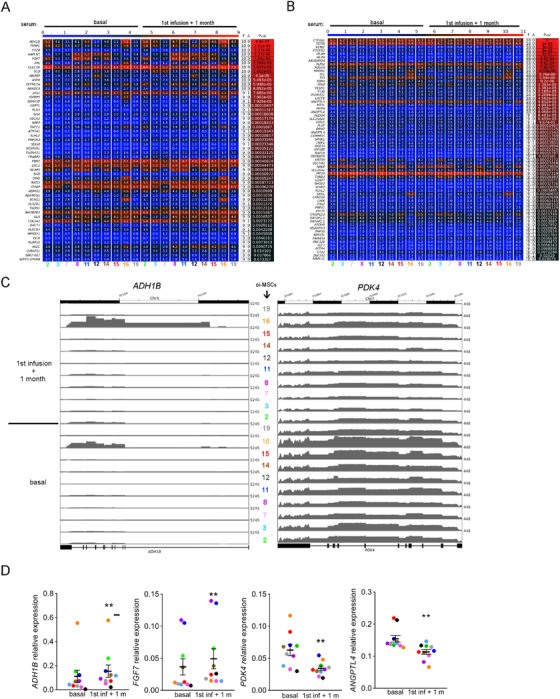
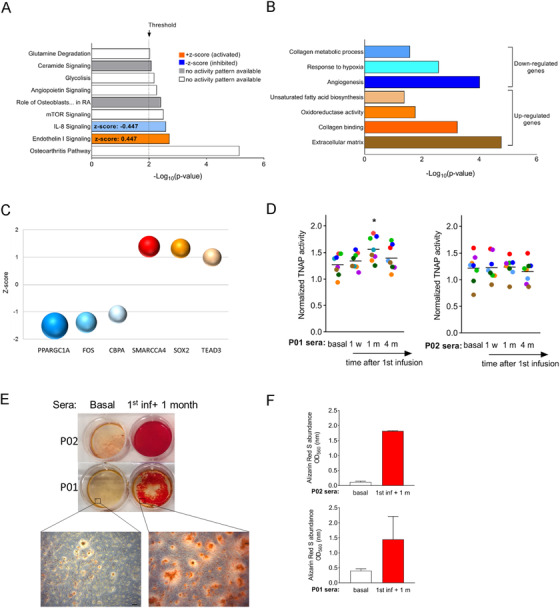
Methods: To overcome the short-term effect of MSCs therapy, we performed a phase I clinical trial based on reiterative infusions of histocompatible MSCs, administered in a 2.5-year period, in two pediatric patients affected by severe and moderate OI. The aim of this study was to assess the safety and effectiveness of this cell therapy in nonimmunosuppressed OI patients. The host response to MSCs was studied by analyzing the sera from OI patients, collected before, during, and after the cell therapy.

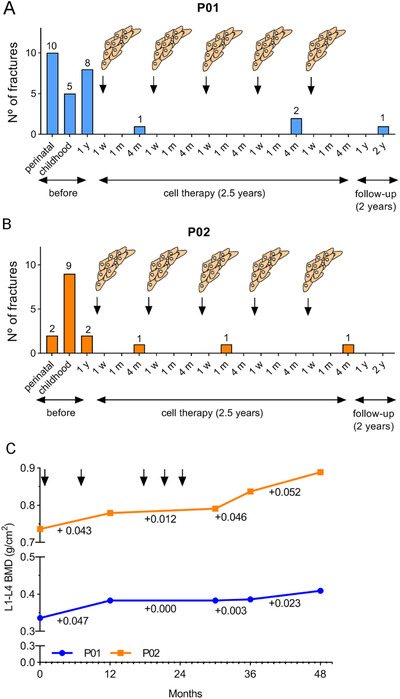
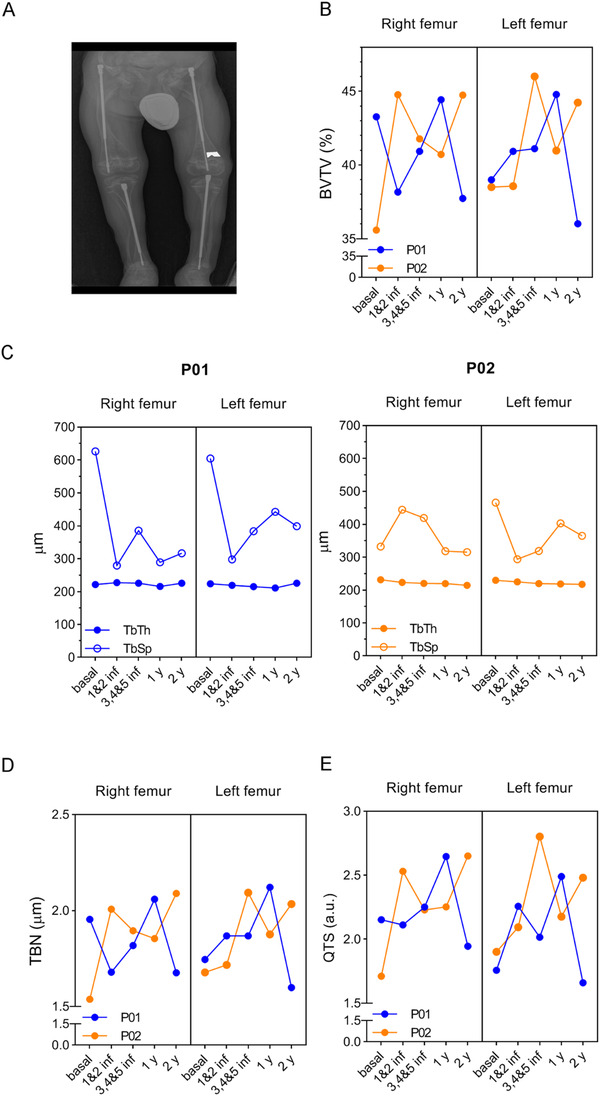
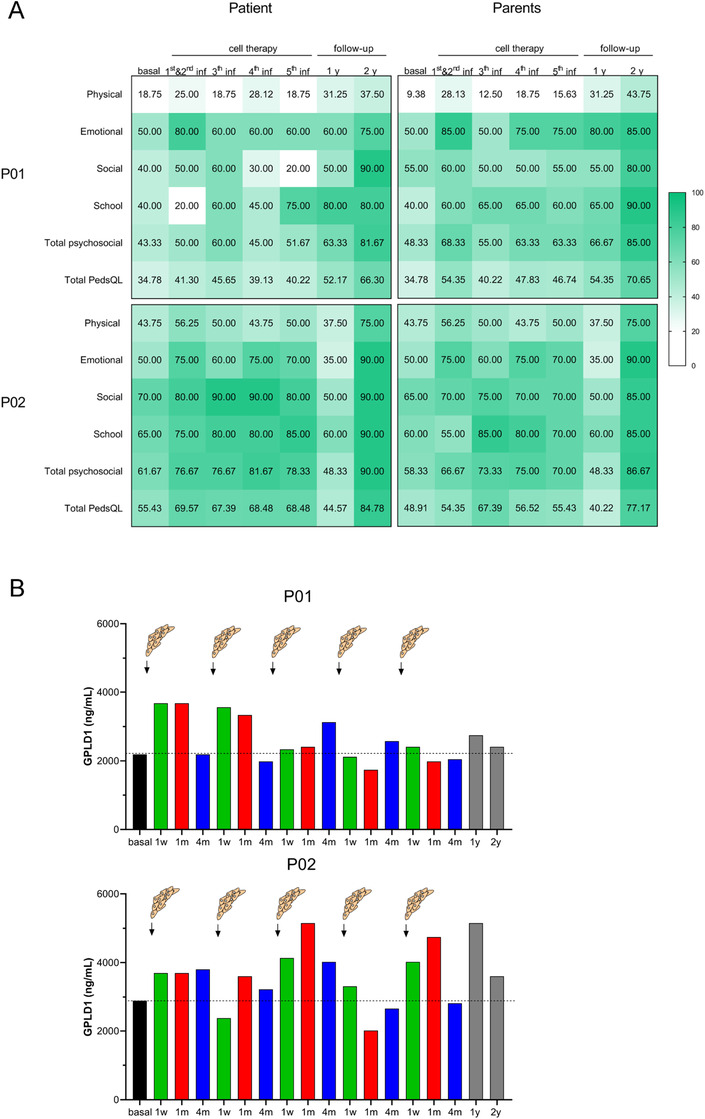
Results: We first demonstrated that the sequential administration of MSCs was safe and improved the bone parameters and quality of life of OI patients along the cell treatment plus 2-year follow-up period. Moreover, the study of the mechanism of action indicated that MSCs therapy elicited a pro-osteogenic paracrine response in patients, especially noticeable in the patient affected by severe OI.

Conclusions: Our results demonstrate the feasibility and potential of reiterative MSCs infusion for two pediatric OI and highlight the paracrine response shown by patients as a consequence of MSCs treatment.

Keywords: cell therapy; mesenchymal stem cell; paracrine mechanism of action; regenerative medicine.


Conflict of interest statement

The authors declare no conflict of interest.

Figures

FIGURE 1
FIGURE 1
Overview of the TERCELOI clinical trial. (A) Table 1, reflecting the inclusion and exclusion criteria of the clinical trial. (B) Diagram illustrating the clinical trial workflow. The five MSCs infusions administered in total period of time of 2.5 years are indicated (black arrows). Previously to each cell infusion, mixed lymphocyte reaction assay was performed, denoted by asterisks. The visits for clinical and analytical evaluation in addition to sera collection after each cell infusion are denoted by colored arrows. Before the cell therapy: red. During the cell therapy: blue, 1 week (1 w); green, 1 month (1 m); and purple, 4 months (4 m) after each cell infusion. After the cell therapy: follow‐up visits at 1 and 2 years after the fifth cell infusion: gray. (C) Representative histogram plots of generations of divided cells as determined by ModFit‐LT software before the first MSCs infusion in P01 patient. Upper plots: controls consisted of unstimulated (left) or PHA‐stimulated PBMCs (right) isolated from P01. Dark blue peak in each plot indicates undivided parental cells. PHA‐stimulated PBMCs show several cell generations, denoting cell proliferation. Lower plots: P01 PBMCs cultured in the presence of donor MSCs, showing either no proliferation (left) or suppressed proliferation under PHA stimulation (right)
FIGURE 2
FIGURE 2
Bone‐related parameters measured in OI patients before, during, and after the MSCs therapy. (A and B) Number of fractures in TERCELOI patients before the cell therapy: during the perinatal period, childhood (from perinatal period up to 5‐year old in P01 and up to 7‐year old in P02), and the year previous the first infusion of MSCs; during the cell therapy treatment (each of the five MSCs infusion is depicted) and during the follow‐up visits (1 and 2 years after the fifth MSCs infusion); 1 w (1 week), 1 m (1 month), and 4 m (4 months) indicate the visits after each cell infusion. (C) BMD of P01 (blue line) and P02 (orange line) before (0 months), during (MSCs infusions are specified with arrows), and after the cell therapy
FIGURE 3
FIGURE 3
Trabecular bone microarchitecture from TERCELOI patients before, during, and after the cell therapy. (A) Representative image of QUIBIM software, indicating the ROI used to determine the different bone parameters in patients before (basal), after the two first infusions (1 and 2 inf), after the three last infusions (3, 4, and 5 inf), and during the follow‐up visits (1 and 2 y). (B) Percent (%) of bone (BVTV). (C) Trabecular thickness (TbTh) and separation (TbSp). (D) Trabecular index (TBN). (E) Quality of trabecular structure (QTS). P01, blue color lines; P02, orange color lines
FIGURE 4
FIGURE 4
Quality of life and GPLD1 levels of patients during TERCELOI. (A) At that indicated time points: before (basal), during (after the first, second, third, fourth, and fifth infusions), and after the MSCs therapy (1 and 2‐year follow‐up visits) questionnaires were performed to each patient and his/her parents. The obtained numerical scores ranging from 0 to 100 have been depicted with a green color scale. (B) Serum GPLD1 detection by ELISA in P01 (upper graph) and P02 (lower graph) at the mentioned time points
FIGURE 5
FIGURE 5
Expression analysis of proteins and miRNAs in sera of patients. (A and B) Antibody arrays quantification of serum proteins in TERCELOI patients. The dot plots reflect the expression fold induction of the 1000 proteins included in both arrays (493 and 507) after the first MSCs infusion (1 w, green color; 1 m, red color; 4 m, blue color) when compared to the expression of those proteins before the cell therapy (black, dashed line). Each dot represents a protein. (C) IPA comparison analysis for commonly upregulated proteins (fold change > 1.3) after the first MSCs infusion (1 w, 1 m, and 4 m) in P01 and P02. The heatmap represents the significantly enriched (P < .05) biological functions predicted to be activated (z‐score > 2) or inhibited (z‐score < 2). (D) Activation network diagram for TNAP predicted by IPA based on five proteins found to be upregulated in P01 and P02 1 month after the first cell infusion. (E) Heatmap of the miRNAs expression signature of P01 and P02 serum samples, before, during (1 month after each cell infusion), and after (1 and 2 years’ follow‐up) cell therapy. Unit variance scaling was applied to the global mean normalized expression values for each miRNA. Color indicates relative upregulation (red) or downregulation (blue) for each miRNA (row)
FIGURE 6
FIGURE 6
Transcriptome changes in OI MSCs in the presence of sera from P01 patient. (A and B) Heatmaps reflecting the significantly DEGs (rows) identified in the 10 OI MSCs (columns, each cell line identified by a number and a color) by RNAseq. The results were obtained comparing the data from OI MSCs cultured under osteogenic conditions (4 days) in the presence of the serum collected after the cell therapy (first infusion + 1 month) versus the serum collected before the treatment (basal). Numbers indicate the FPKM reads obtained from RNAseq for each DEG in each cell line. The columns “F” and “A” of the table denote how many votes are Favor and Against the analyzed condition, respectively. (C) Genome browser screenshot of RNAseq tracks at ADH1B and PDK4 loci in the 10 OI MSCs lines analyzed, cultured under basal or 1 month after the first cell infusion serum. (D) Quantitative PCR validation of a subset of genes in the 10 OI MSCs lines. Each color represents an OI MSCs line. **P < .01
FIGURE 7
FIGURE 7
Assessment of the pro‐osteogenic potential of sera from TERCELOI patients. (A) IPA gene ontology enrichment analysis of the DEGs identified by RNAseq. (B) Significantly enriched biological processes identified by DAVID database. (C) Top six (three activated, z‐score > 1; three repressed, z‐score < 1) upstream regulators predicted by IPA to be responsible for the DEGs. Each transcription factor is represented by a sphere and plotted by its z‐score value. The P‐values for each transcription factor are graphically represented by different sphere sizes. (D) TNAP activity was measured (right graph) at day 4 of osteogenic induction in sera collected before (basal serum) and at different time points after the first cell infusion (1 w, 1 m, and 4 m). Each dot represents the TNAP activity value for an OI MSC cell line (n = 8, *P < .05). Horizontal lanes represent the mean of TNAP for each condition, two independent experiments). (E) Representative alizarin red S staining (ARS) staining of two OI MSCs lines cultured under osteogenic conditions (14 days) in the presence of TERCELOI sera collected before (basal) and 1 month after the first cell infusion. A field with a higher magnification shows the stained calcium deposits for each condition. Scale bar: 100 μm. (F) ARS quantification from triplicate wells of OI MSCs lines (n = 2) cultured with P01 or P02 sera. The mean and SEM was calculated from triplicates for each condition. Presented are representative data from two independent experiments

Comment in

Similar articles

Cited by

References

    1. Marini JC, Forlino A, Bächinger HP, et al. Osteogenesis imperfecta. Nat Rev Dis Primers. 2017;3:17052 10.1038/nrdp.2017.52 - DOI - PubMed
    1. Forlino A, Marini JC. Osteogenesis imperfecta. Lancet. 2016;387(10028):1657‐1671. - PMC - PubMed
    1. Kang H, Aryal A C S, Marini JC. Osteogenesis imperfecta: new genes reveal novel mechanisms in bone dysplasia. Transl Res. 2017;181:27‐48. - PubMed
    1. Rauch F, Fahiminiya S, Majewski J, et al. Cole‐Carpenter syndrome is caused by a heterozygous missense mutation in P4HB. Am J Hum Genet. 2015;96(3):425‐431. - PMC - PubMed
    1. Moosa S, Chung BH, Tung JY, et al. Mutations in SEC24D cause autosomal recessive osteogenesis imperfecta. Clin Genet. 2016;89(4):517‐519. - PubMed

Publication types