The Impact of the Coronavirus Disease-2019 Pandemic on Childhood Obesity and Vitamin D Status
- PMID: 33463095
- PMCID: PMC7813584
- DOI: 10.3346/jkms.2021.36.e21
The Impact of the Coronavirus Disease-2019 Pandemic on Childhood Obesity and Vitamin D Status
Abstract
Background: The risk of weight gain as a consequence of school closure in children during the coronavirus disease-2019 (COVID-19) pandemic has been recognized. This study was performed to investigate changes in anthropometric and metabolic parameters in children following a 6-month period of social distancing and school closure due to the pandemic.
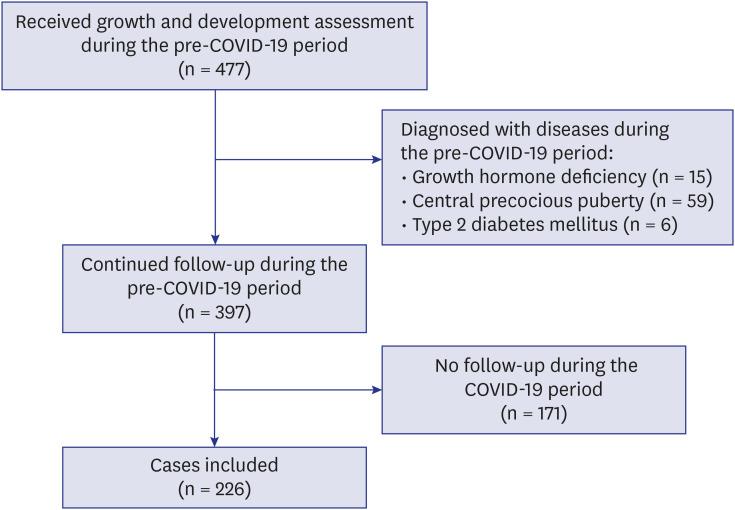
Methods: This retrospective cohort study was conducted in school-aged children that were on routine follow-up at the Growth Clinic of Seoul St. Mary's Hospital. Changes in body mass index (BMI) standard deviation scores (z-scores), lipid profiles, and vitamin D levels were investigated. The 1-year period prior to school closure was defined as "pre-COVID-19 period," and the subsequent 6-month period as "COVID-19 period."
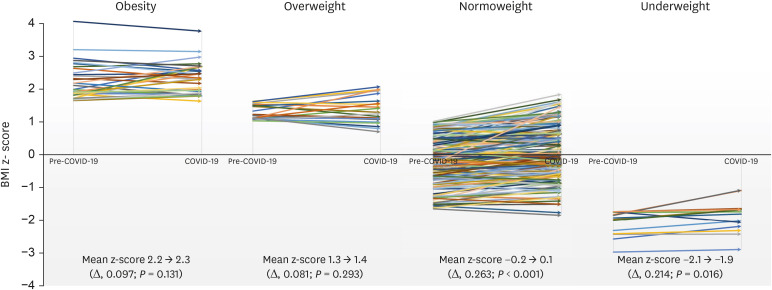
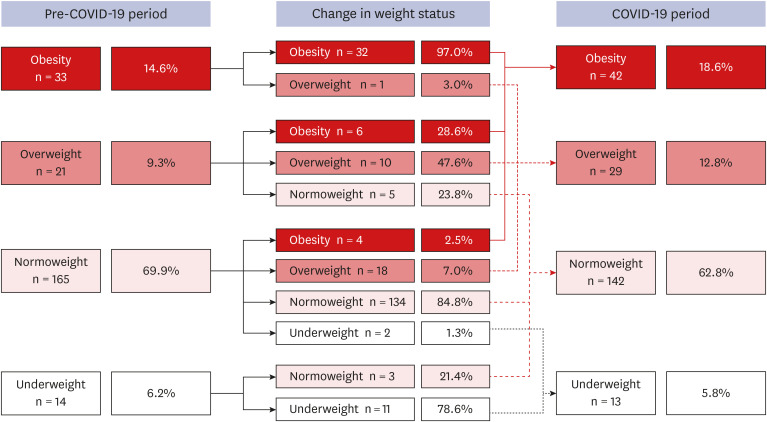
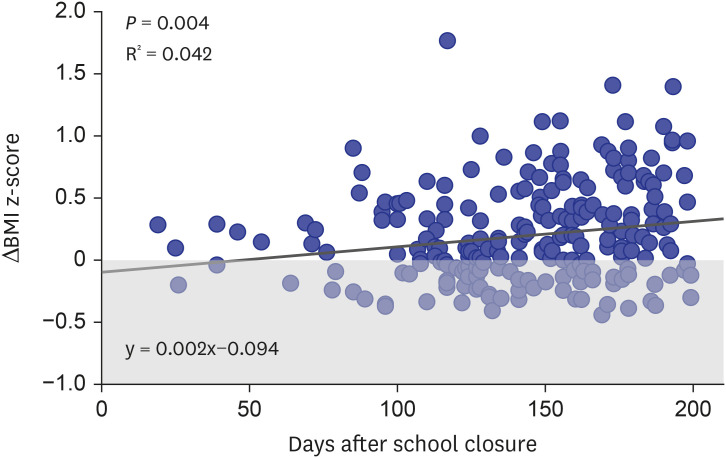
Results: Overall, 226 children between 4 to 14 years old without comorbidities were assessed. On average, their BMI z-scores increased by 0.219 (95% confidence interval [CI], 0.167-0.271; P < 0.001) in the COVID-19 period compared to the pre-COVID-19 period, and the proportion of overweight or obesity increased from 23.9% in the pre-COVID-19 period to 31.4% in the COVID-19 period. The number of days after school closure (P = 0.004) and being in the normoweight category in the pre-COVID-19 period (P = 0.017) were factors associated with an increased BMI in the COVID-19 period. The mean triglyceride (105.8 mg/dL vs. 88.6 mg/dL, P < 0.001) and low-density lipoprotein-cholesterol (100.2 mg/dL vs. 94.0 mg/dL, P = 0.002) levels were higher, whereas the calcidiol level (18.9 mg/dL vs. 23.8 mg/dL, P < 0.001) was lower in the COVID-19 period compared to the pre-COVID-19 period.
Conclusion: Within 6 months, increased childhood obesity and vitamin D deficiencies were observed. The duration of school closure was significantly associated with an increased BMI and being normoweight does not exclude the risks for gaining weight.
Keywords: Calcidiol; Overweight; School Closure; Social Distancing.
© 2021 The Korean Academy of Medical Sciences.
Conflict of interest statement
The authors have no potential conflicts of interest to disclose.
Figures
References
-
- Korean Disease Control and Prevention Agency. The updates on COVID-19 in Korea as of 1 March. [Updated March 1, 2020]. [Accessed October 3, 2020]. https://www.cdc.go.kr/board/board.es?mid=a30402000000&bid=0030.
-
- Wang YC, Vine S, Hsiao A, Rundle A, Goldsmith J. Weight-related behaviors when children are in school versus on summer breaks: does income matter? J Sch Health. 2015;85(7):458–466. - PubMed
MeSH terms
Substances
LinkOut - more resources
Full Text Sources
Other Literature Sources
Medical