Clinical Trial
. 2021 Jan 19;131(2):e136055.
doi: 10.1172/JCI136055.

Circulating markers of NADH-reductive stress correlate with mitochondrial disease severity

Affiliations
Clinical Trial

Circulating markers of NADH-reductive stress correlate with mitochondrial disease severity

Rohit Sharma et al. J Clin Invest. .

Abstract

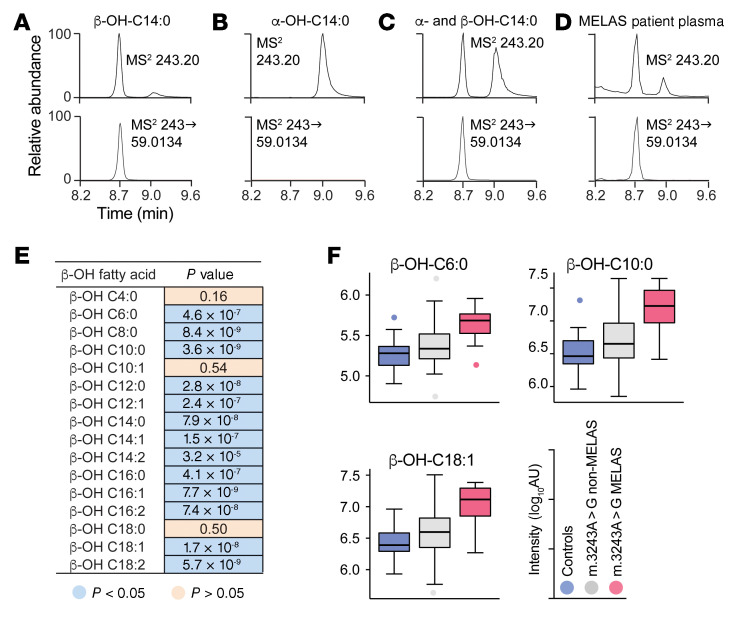
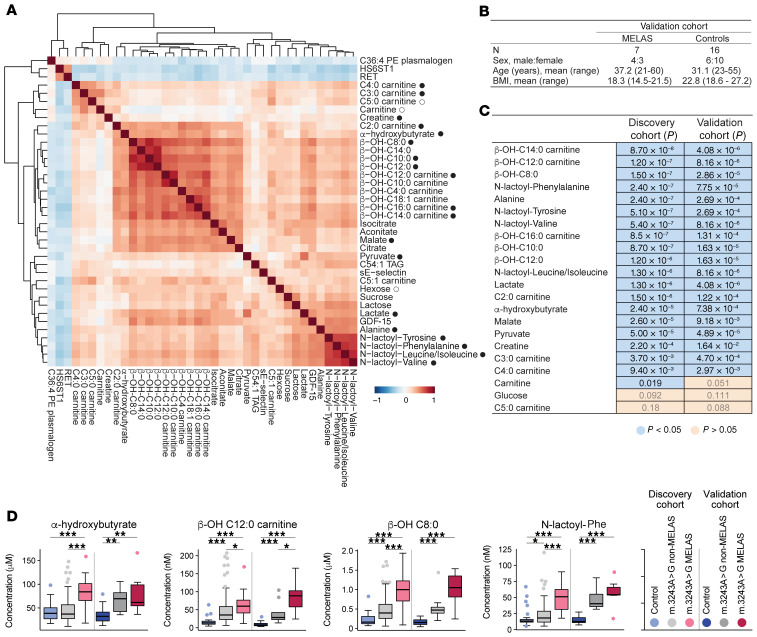
Mitochondrial disorders represent a large collection of rare syndromes that are difficult to manage both because we do not fully understand biochemical pathogenesis and because we currently lack facile markers of severity. The m.3243A>G variant is the most common heteroplasmic mitochondrial DNA mutation and underlies a spectrum of diseases, notably mitochondrial encephalomyopathy lactic acidosis and stroke-like episodes (MELAS). To identify robust circulating markers of m.3243A>G disease, we first performed discovery proteomics, targeted metabolomics, and untargeted metabolomics on plasma from a deeply phenotyped cohort (102 patients, 32 controls). In a validation phase, we measured concentrations of prioritized metabolites in an independent cohort using distinct methods. We validated 20 analytes (1 protein, 19 metabolites) that distinguish patients with MELAS from controls. The collection includes classic (lactate, alanine) and more recently identified (GDF-15, α-hydroxybutyrate) mitochondrial markers. By mining untargeted mass-spectra we uncovered 3 less well-studied metabolite families: N-lactoyl-amino acids, β-hydroxy acylcarnitines, and β-hydroxy fatty acids. Many of these 20 analytes correlate strongly with established measures of severity, including Karnofsky status, and mechanistically, nearly all markers are attributable to an elevated NADH/NAD+ ratio, or NADH-reductive stress. Our work defines a panel of organelle function tests related to NADH-reductive stress that should enable classification and monitoring of mitochondrial disease.

Keywords: Genetics; Intermediary metabolism; Metabolism; Mitochondria; Monogenic diseases; RET; HS6ST1; sE-selectin; integrated stress response; creatine; pyruvate; 2-hydroxybutyrate; alpha-hydroxybutyrate; lactoyl-amino acids; hydroxy-fatty acids; hydroxy-acylcarnitines.


Conflict of interest statement

Conflict of interest: VKM is on the scientific advisory board and receives equity from Janssen Pharmaceuticals and 5AM Ventures. VKM is an inventor on a patent application filed by Massachusetts General Hospital on novel therapeutic approaches targeting reductive stress (“Extracellular Redox Enzyme System to Alleviate Disease,” no. 16/769,319). OSS is a paid consultant for Proteinaceous Inc. MH is a paid consultant for Zogenix and Entrada Therapeutics. DCDV is a paid consultant for Biogen and AveXis Therapeutics. RS holds equity in BlueBird Bio.

Figures

Figure 1
Figure 1. MELAS biomarker discovery and validation.
Over a 3-year period, a discovery cohort of control patients harboring the m.3243A>G variant was phenotyped through a combination of questionnaires, physical exams, and clinical laboratory measurements. Plasma metabolomic and proteomic profiles of the discovery cohort were analyzed to identify analytes that best distinguished patients with MELAS from controls, and that most strongly correlated with disease severity. From these, 22 metabolites were chosen for validation in an independent cohort of 7 patients with m.3243A>G MELAS and 16 controls. This pipeline yielded a validated set of 20 plasma markers (1 protein and 19 metabolites).
Figure 2
Figure 2. Comparison of 1310 proteins and 376 targeted metabolites in plasma of patients with MELAS and controls.
(A) Four proteins discriminate patients with MELAS (n = 16) from controls (n = 24) at the 2% FDR threshold with the indicated fold effects and 95% CI. Plots (BE, GJ, and L) show box (median with quartiles) and whisker (1.5 × IQR) plots of controls, m.3243A>G non-MELAS and patients with MELAS for each analyte meeting the 2% FDR threshold with individual data points plotted only for outliers. All show log10(AU) after correction for age, sex, BMI, and batch. (B) Growth differentiation factor 15 (GDF-15). (C) HS6ST1, heparan-sulfate 6-O-sulfotransferase 1. (D) sE-selectin, soluble E-selection. (E) RET proto-oncogene (RET). (F) Twenty-three metabolites from the targeted platform significantly discriminate patients with MELAS (n = 20) from controls (n = 32), with the indicated fold effects and 95% CIs. (GJ and L) Box and whisker plots for 18 of the top metabolites. (K) The significances shown as –log10(P value) of each of the 26 different acylcarnitine species identified by the targeted metabolomics platform are shown according to carbon chain length with the gray line at y = 2.92 marking the 2% FDR threshold. The P values shown here are the results of a regression analysis controlling for age, sex, BMI, and batch (see Methods).
Figure 3
Figure 3. Biomarker discovery from untargeted metabolic profiling.
(A) The untargeted metabolomics platform identified 5584 features. Each data point reflects the fold-change and P value comparing patients with MELAS (n = 20) and controls (n = 32). Two hundred thirty-seven of the features were identified and 6 of those features (black dots) were identified by the targeted platform. Overall, 536 features met the 2% FDR threshold indicated by a gray line at y = 1.7. Three biochemical families appeared when searching for potential chemical matches by mass in HMDB: N-lactoyl-amino acids (red dots), hydroxy-fatty acids (yellow dots), and hydroxyacyl carnitines (cyan dots). (B) Four significant peaks matched N-lactoyl-amino acids. The origin of these metabolites is not known, though they have been proposed to be catalyzed as shown by reverse proteolysis. (C) A chemically synthesized N-lactoyl-phenylalanine standard has the same fragmentation pattern as the peak observed in a sample from a patient with MELAS. (DF) Graphs following the formatting of Figure 2 show the distributions of (D) 4 N-lactoyl-amino acids, (E) 4 of the 12 hydroxycarnitines, and (F) 4 of the 10 hydroxy-fatty acids in controls (n = 32) in m.3243A>G non-MELAS patients (n = 82) and patients with MELAS (n = 20).
Figure 4
Figure 4. BOHFAs are significantly increased in MELAS.
(A) Fragmentation of a standard of β-OH-C14:0 produces a 59.0134 m/z fragment ion but (B) fragmentation of α-OH-C14:0 does not. (C) A mixture of α- and β-OH-C14:0 standards can be separated based on retention time and the 59.0134 m/z fragment ion. Each BOHFA standard tested produced a 59.0134 m/z fragment ion (data not shown). (D) We quantified the relative level of β-OH-C14:0 in each sample using the exact mass and the 59.0134 m/z transition; the extracted ion chromatogram for 1 representative patient with MELAS is shown. (E) Sixteen BOHFAs were quantified with their respective masses and the 59.0134 m/z transition. The table shows the Wilcoxon rank-sum P value comparing 20 patients with MELAS and 32 controls. (F) Distributions of 3 representative BOHFAs, following the format in Figure 2.
Figure 5
Figure 5. Correlation of plasma markers, brain lactate, or urine heteroplasmy with measures of disease severity.
Kendall rank correlation coefficient (Corr. (τ)) of all 1978 proteins and identified metabolites from targeted and untargeted platforms with 3 measures of severity: (A) urine heteroplasmy, (B) MRS ventricular lactate, and (C) Karnofsky score. MRS ventricular lactate is highlighted in red, urine heteroplasmy in cyan, and Karnofsky score in green. Identified analytes found to be significant from the proteomics, targeted metabolomics, and untargeted metabolomics platforms are represented as black dots and the remainder as gray dots. The 12 most correlated and anticorrelated analytes are listed with those identified as candidate markers shown in black text and the remaining in gray text. (D) Distributions of Karnofsky scores for select analytes in controls, m.3243A>G non-MELAS patients and patients with MELAS. One data point for β-OH-C16:0 carnitine has been excluded as it was unmeasured in a control.
Figure 6
Figure 6. Correlations among most discriminating analytes and validation of top metabolites.
(A) Proteomic profiling combined with targeted and untargeted metabolomic profiling revealed 4 proteins and 34 metabolites that significantly discriminate patients with MELAS from controls. The heatmap displays Kendall rank correlation coefficients (τ) among these 38 analytes over 16 patients with MELAS, 60 m.3243A>G non-MELAS patients, and 24 controls (set in which both proteomics and metabolomics was performed, Supplemental Table 1) and reveals several groups within which there is high correlation. Twenty-two metabolites from across the correlational groups were chosen for validation and are indicated by circles; filled circles were significantly (P < 0.05) different in the validation cohort. (B) We collected plasma samples from a separate validation cohort of 16 controls and 16 patients with the m.3243A>G variant (7 of whom had MELAS) seen at 2 institutions (Supplemental Table 3). (C) Using 2 LC-MS methods, absolute concentrations of 22 metabolites were measured in the discovery (MELAS and controls only) and validation cohorts. The Wilcoxon rank-sum test was used to compare the MELAS and controls in each cohort, and 19 of the 22 metabolites validated with a P value less than 0.05. Metabolites are ordered by their discovery cohort P value. (D) Distributions for 4 representative metabolites in discovery and validation cohorts following the format of Figure 2 with significance as indicated: *P < 0.05, **P < 0.01, and ***P < 0.001. The Wilcoxon rank-sum test was used to compare metabolite levels within each cohort.
Figure 7
Figure 7. NADH-reductive stress drives the metabolic signature in MELAS.
Depicting the primary analytes emerging from our targeted and untargeted platforms on their respective metabolic pathways in cytoplasm and within mitochondria revealed that biochemical reactions sensitive to the NADH/NAD+ ratio strongly impacted the plasma metabolite content in MELAS.

Comment in

References

    1. MacMunn CA. Further observations on myohaematin and the histohaematins. J Physiol. 1887;8(2):51–65. doi: 10.1113/jphysiol.1887.sp000243. - DOI - PMC - PubMed
    1. Skladal D, et al. Minimum birth prevalence of mitochondrial respiratory chain disorders in children. Brain. 2003;126(8):1905–1912. doi: 10.1093/brain/awg170. - DOI - PubMed
    1. Gorman GS, et al. Prevalence of nuclear and mitochondrial DNA mutations related to adult mitochondrial disease. Ann Neurol. 2015;77(5):753–759. doi: 10.1002/ana.24362. - DOI - PMC - PubMed
    1. Munnich A, et al. Clinical aspects of mitochondrial disorders. J Inherit Metab Dis. 1992;15(4):448–455. doi: 10.1007/BF01799603. - DOI - PubMed
    1. Fannin SW, et al. Aging selectively decreases oxidative capacity in rat heart interfibrillar mitochondria. Arch Biochem Biophys. 1999;372(2):399–407. doi: 10.1006/abbi.1999.1508. - DOI - PubMed

Publication types