

Cryo-EM structure of the CENP-A nucleosome in complex with phosphorylated CENP-C
- PMID: 33463726
- PMCID: PMC7917552
- DOI: 10.15252/embj.2020105671
Cryo-EM structure of the CENP-A nucleosome in complex with phosphorylated CENP-C
Abstract
The CENP-A nucleosome is a key structure for kinetochore assembly. Once the CENP-A nucleosome is established in the centromere, additional proteins recognize the CENP-A nucleosome to form a kinetochore. CENP-C and CENP-N are CENP-A binding proteins. We previously demonstrated that vertebrate CENP-C binding to the CENP-A nucleosome is regulated by CDK1-mediated CENP-C phosphorylation. However, it is still unknown how the phosphorylation of CENP-C regulates its binding to CENP-A. It is also not completely understood how and whether CENP-C and CENP-N act together on the CENP-A nucleosome. Here, using cryo-electron microscopy (cryo-EM) in combination with biochemical approaches, we reveal a stable CENP-A nucleosome-binding mode of CENP-C through unique regions. The chicken CENP-C structure bound to the CENP-A nucleosome is stabilized by an intramolecular link through the phosphorylated CENP-C residue. The stable CENP-A-CENP-C complex excludes CENP-N from the CENP-A nucleosome. These findings provide mechanistic insights into the dynamic kinetochore assembly regulated by CDK1-mediated CENP-C phosphorylation.
Keywords: CENP-A; CENP-C; Cryo-EM; kinetochore; phosphorylation.
© 2021 The Authors.
Conflict of interest statement
The authors declare that they have not conflict of interest.
Figures
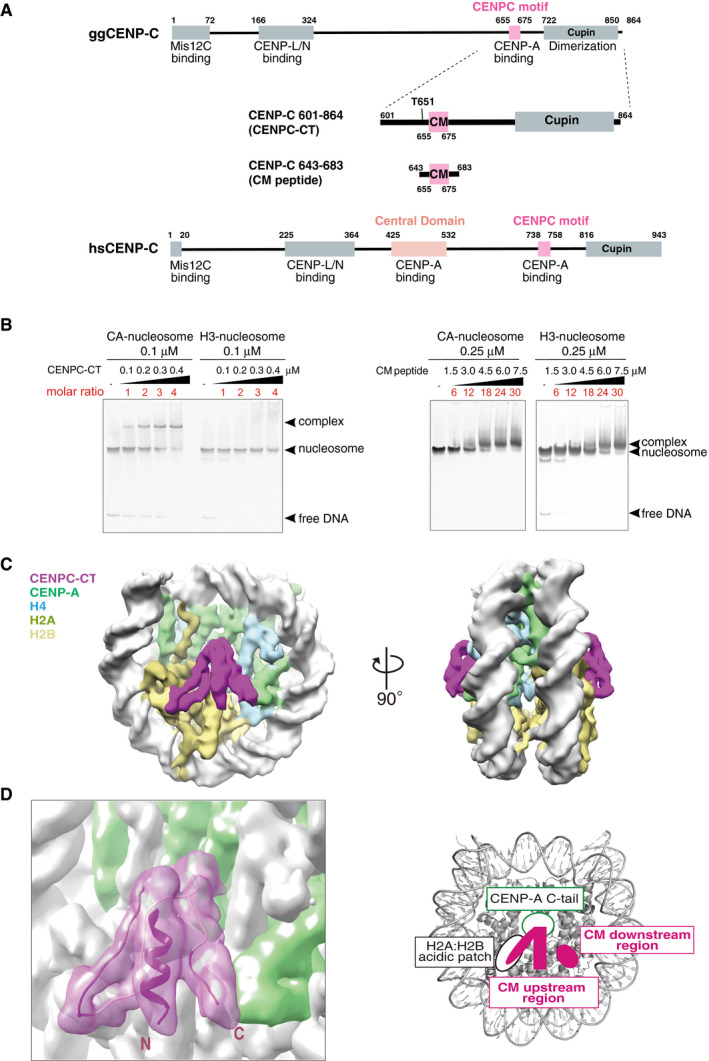
Schematic diagram of the functional regions of chicken and human CENP‐C molecules. The canonical CENPC motifs for CENP‐A binding (aa 655‐675 in chicken CNEP‐C, aa 738‐758 in human CENP‐C) are colored pink. Another CENP‐A binding region (central domain) in human CENP‐C is colored light pink. The C‐terminal fragment (aa 601‐864: CENPC‐CT) and the CENPC motif‐containing peptide (aa 643‐683; CM peptide) derived from chicken CNEP‐C, which were used for the in vitro CENP‐A nucleosome‐binding assay, are diagrammed.
Electrophoretic mobility shift assay (EMSA) examination of the binding affinity of CENPC‐CT and CM peptide to a CENP‐A nucleosome. Binding to a canonical H3 nucleosome was also examined using EMSA.
Cryo‐EM density map of the CENP‐A nucleosome in complex with CENPC‐CT (CA‐CCCT complex) at a 4.5 Å resolution. The side views of the CA‐CCCT complex along the two‐fold axis are shown. The density corresponding to each molecule in the complex is color‐coded, as indicated in the figure.
Cryo‐EM structure of the CENP‐A nucleosome‐binding region of CENPC‐CT. The left panel shows the cartoon representation of the structure of CENPC‐CT bound to the CENP‐A nucleosome with the cryo‐EM density map. The densities derived from CENPC‐CT and CENP‐A molecules are color‐coded in magenta and pale green, respectively. The functional elements in the CENP‐A nucleosome‐binding region of CENPC‐CT are depicted in the right panel. In addition to the CENPC motif, which recognizes the H2A/H2B acidic patch and the CENP‐A C‐terminal tail (C‐tail), the CM upstream and CM downstream regions are identified in the CENP‐A bound structure of CENPC‐CT. See also Fig EV2C.
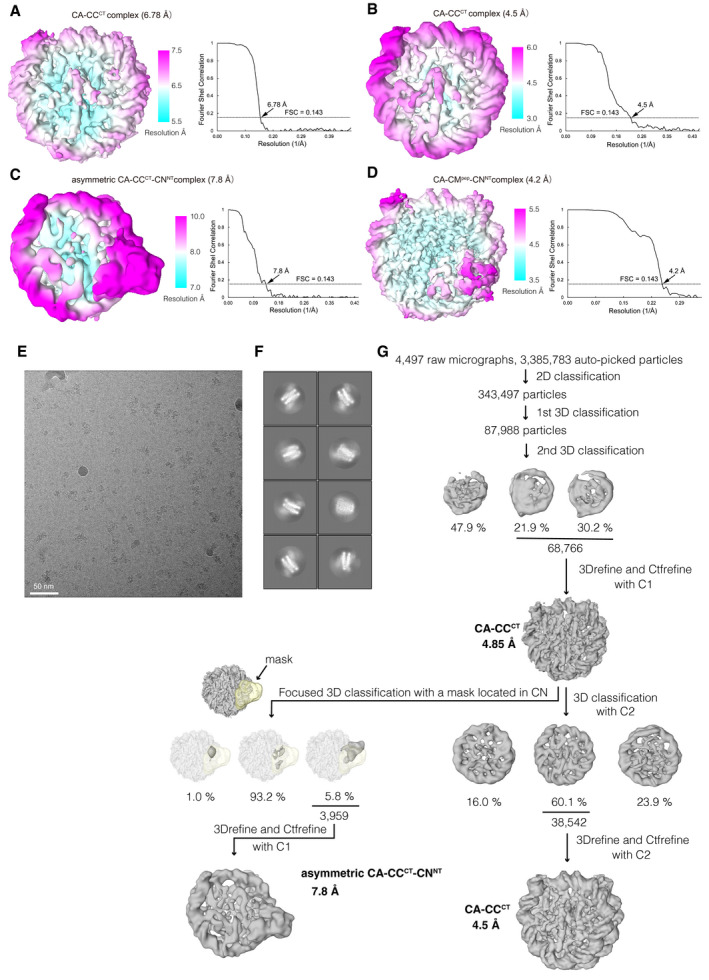
Cryo‐EM density map of the chicken CA‐CCCT complex at a 6.78 Å resolution, colored according to the local resolution estimated by RELION in the left panel. Gold‐standard Fourier shell correlation (FSC) curve of the Cryo‐EM density map is displayed in the right panel. Reported resolution was based on the FSC = 0.143 criterion.
Cryo‐EM density map and FSC curve of the chicken CA‐CCCT complex at a 4.5 Å resolution obtained using the CENP‐A nucleosome + CENPC‐CT + CENPN‐NT sample (major component) are shown as in (A).
Cryo‐EM density map and FSC curve of the asymmetric chicken CA‐CCCT‐CNNT complex at 7.8 Å resolution obtained using CA + CCCT+CNNT sample (minor component) are shown as in (A).
Cryo‐EM density map and FSC curve of the asymmetric chicken CA‐CCpep‐CNNT complex at a 4.2 Å resolution are shown as in (A).
A representative micrograph of the CENP‐A complex with CENPC‐CT and CENPN‐NT.
Representative 2D class averages of the CENP‐A nucleosome + CENPC‐CT + CENPN‐NT sample.
Flow chart showing the image processing pipeline for the cryo‐EM single particle image analysis of the chicken CA‐CCCT complex and asymmetric chicken CA‐CCCT‐CNNT complex.
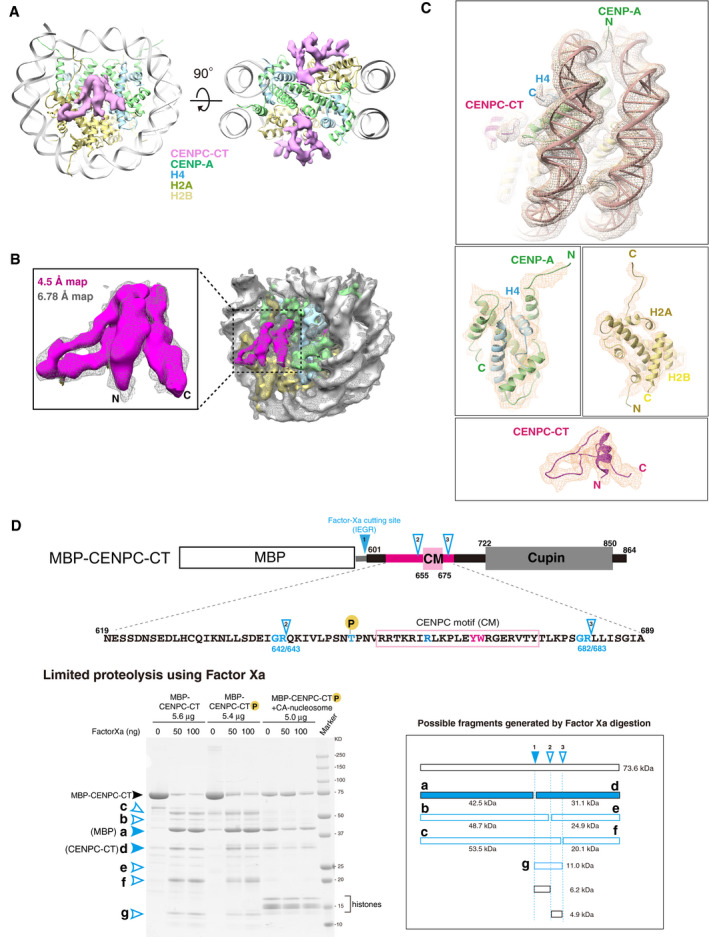
Cryo‐EM density map of the CENPC‐CT bound to the CENP‐A nucleosome at a 6.78 Å resolution. The EM map for CENPC‐CT is shown in a pink surface representation together with the ribbon representation of the CENP‐A nucleosome. The molecules in the complex are color‐coded as indicated in the figure. The right panel shows a slice view along the two‐fold axis. The two CENPC‐CT fragments symmetrically bind to the CENP‐A nucleosome.
Comparison of lower (6.78 Å) and higher (4.5 Å) resolution EM densities of the CA‐CCCT complex. The map at 4.5 Å resolution is depicted in a surface representation and superposed on the 6.78 Å resolution map shown as a mesh representation (light gray). The superposed maps corresponding to the CENPC‐CT are enlarged in a left panel.
Detailed views of the cryo‐EM density map of the CA‐CCCT complex at a 4.5 Å resolution. The map is shown as a mesh representation with the ribbon model of the final cryo‐EM structure.
Protease sensitivity of CENPC‐CT is altered by the presence of the CENP‐A nucleosome. Schematic diagram showing Factor Xa cleavage sites in MBP‐fused chicken CENPC‐CT with its functional domain organization. The possible minor cleavage sites (Gly‐Arg sequence) are indicated as cutting site 2 (between residues 642 and 643) and 3 (between residues 682 and 683), in addition to a major cleavage site between CENPC‐CT and MBP (site 1). The amino acid sequence of the folded region in CENPC‐CT is indicated below. The lower left panel shows the result of SDS–PAGE analysis of limited proteolysis product of CENPC‐CT in the absence or presence of the CENP‐A nucleosome. Possible fragments generated by Factor Xa digestion are shown in the lower right panel. Bands corresponding to each fragment are indicated in the gel. In the absence of the CENP‐A nucleosome, bands of the limited proteolysis products (b, c, e, f, and g) were observed. These bands were not observed in the presence of CENP‐A nucleosome.
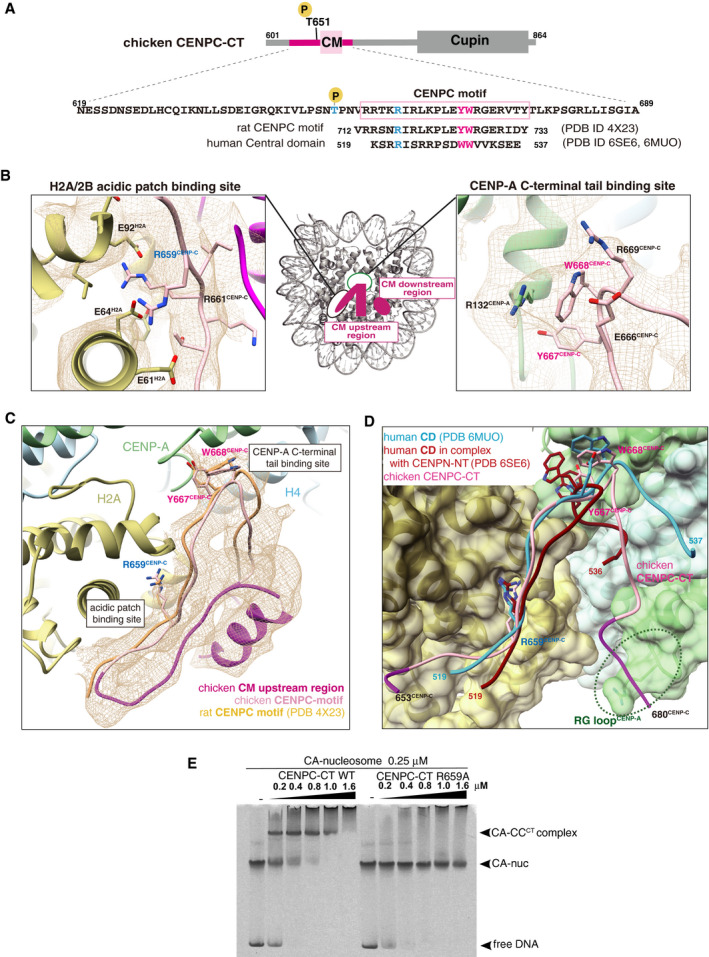
Schematic diagram showing functional elements in chicken CENPC‐CT. The amino acid sequence of CENPC motif (CM) is enclosed in a pink box. The aligned sequences of rat CENPC motif and human central domain (CD), which were used for previous structural studies, are shown at the bottom. Key residues for CENP‐A nucleosome binding, R659, Y667, and W668 in chicken CENP‐C, are colored in blue (R659) and magenta (Y667 and W668). Corresponding residues in rat and human CENP‐C are also colored.
Magnified views of the binding sites for the CENP‐A C‐terminal region and the H2A/2B acidic patch are presented in the cryo‐EM map. Side chains of the key residues are indicated as a stick model.
Cryo‐EM structure of CENPC‐CT bound to the CENP‐A nucleosome. The cryo‐EM density for CENPC‐CT is shown in a mesh representation. The crystal structure of the CENPC motif in complex with the nucleosome (PDB ID: 4X23) is superimposed. The entire backbone structures are well superimposed.
Structural comparison between the chicken CA‐CCCT complex and the human CD structures (PDB ID: 6MUO and 6SE6) on the CENP‐A nucleosome. The structures of CD bound to the CENP‐A nucleosome superimposed to that of the CENPC motif in the CA‐CCCT complex.
CENP‐A nucleosome‐binding assays with WT or R659A mutant of CENPC‐CT. The substitution of R659 residue with alanine (R659A) caused a loss of the CENP‐A nucleosome‐binding ability.
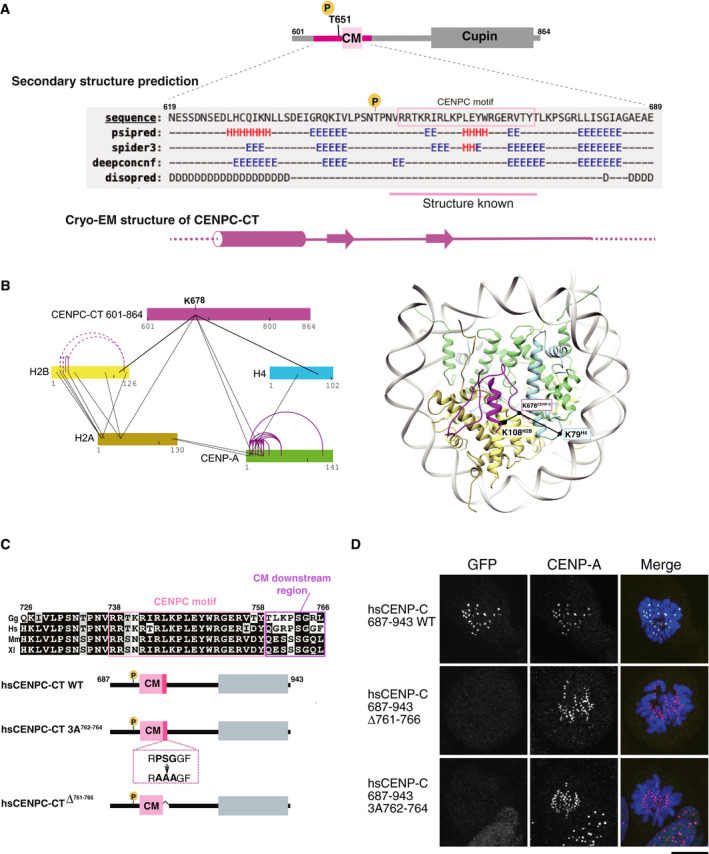
Secondary structure prediction of CENPC‐CT. A diagram of chicken CENPC‐CT is shown. The secondary structure of the putative CENP‐A binding region of CENPC‐CT was analyzed by six different programs using a HHpred server
https://toolkit.tuebingen.mpg.de/tools/hhpred . Predicted secondary structure elements are indicated by H for helix, E for strand, and D for disordered region. The canonical CENPC motif, with previously determined structure in homologues, is highlighted in pink. A schematic diagram of the cryo‐EM structure of CENPC‐CT is shown at the bottom.Crosslinking mass spectroscopy (XL‐MS) interactions depicted in relation to CENPC‐CT and histones, including CENP‐A. Color bars represent protein sequences. Black and purple lines show inter‐ and intra‐protein links, respectively. In the right panel, the crosslinked sites between CENP‐C and histones are indicated on the CA‐CCCT complex structure in which K678CENP‐C was linked with K108H2B and K79H4. Detailed XL‐MS data are presented in Appendix Fig S2.
Alignment of sequences around the CENPC motif region in various species: Gg, chicken; Hs, human; Mm, mouse, and Xl; frog. The CENPC motif and the CM downstream region are depicted by pink and purple boxes, respectively, in the sequence alignment. The residue numbers of human CENP‐C are indicated. Schematic diagram of human CENPC‐CT wild‐type (CENPC‐CT WT: aa 687‐943) corresponding to chicken CNEPC‐CT used for the cryo‐EM analysis is depicted. The conserved PSG residues (aa 762‐764) in the CM downstream region were substituted with AAA (CENPC‐CT 3A762‐764) and CENPC‐CT in which six residues were deleted (CENPC‐CTΔ761‐766) are shown.
Localization analysis of GFP‐fused human CENPC‐CT WT and mutants shown in (C) on the mitotic chromosomes in CENP‐C knock out human RPE‐1 cells. CENP‐A was used as a centromere marker. Scale bar indicates 10 μm.
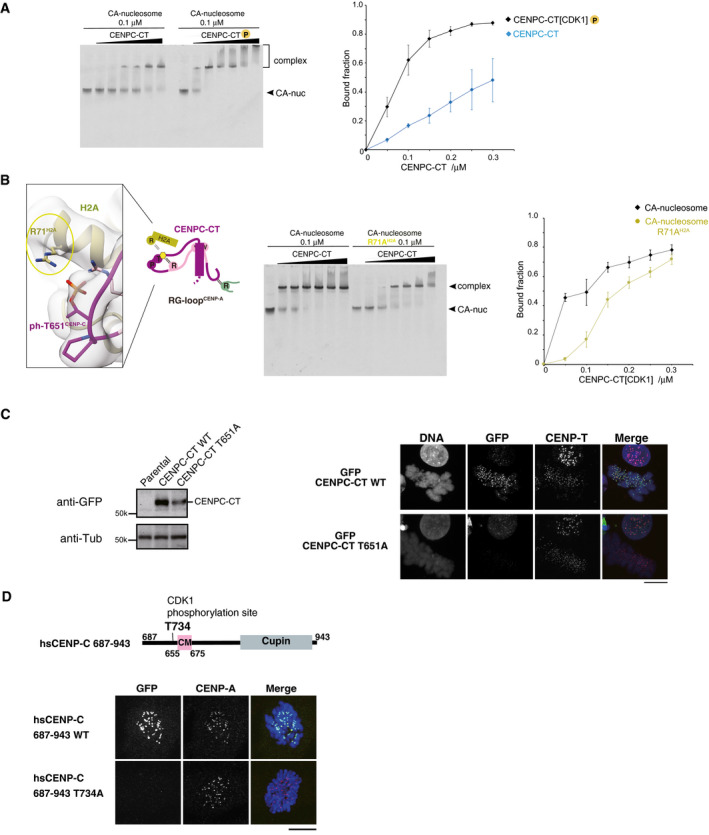
EMSA was performed to examine the binding affinities of phosphorylated or nonphosphorylated CENPC‐CT (CENPC‐CT[CDK1] or CENPC‐CT). The signal intensities of upper binds (bound fractions) were measured. The graph indicates mean with SD (n = 3).
Left panel displays a magnified view of the interface between CENPC‐CT and histone H2A in the CENP‐A nucleosome. Arginine 71 of histone H2A (R71H2A) was situated close to the phosphorylated T651CENP‐C in the range of 3.5 to 4.5 Å. Side chains of R71H2A and phosphorylated T651 of CENP‐C (ph‐T651CENP‐C) are indicated in stick model. The middle panel displays results of EMSA performed to examine the significance of the interaction between R71H2A and ph‐T651CENP‐C. Right panel displays quantification of the EMSA results. The graph indicates mean with SD (n = 3).
Left panel displays the stable expression of GFP‐fused CENPC‐CT or the CDK1 phosphorylation site mutant (CENPC‐CT T651A) in CENP‐C knockout chicken DT40 cells was confirmed by immunoblot analysis. α‐Tubulin (Tub) was probed as a loading control. Parental CENP‐C knockout cells were also analyzed (parental). Right panel displays the results of localization analysis of GFP‐fused CENPC‐CT WT and T651A mutant in CENP‐C knockout chicken DT40 cells. CENP‐T was used as a centromere marker. Scale bar indicates 10 μm.
Localization analysis of GFP‐fused human CENPC‐CT (687‐943) WT and T734A mutant (equivalent to T651A of chicken CENP‐C) in CENP‐C knockout human RPE1 cells. CENP‐A was used as a centromere marker. Scale bar indicates 10 μm.
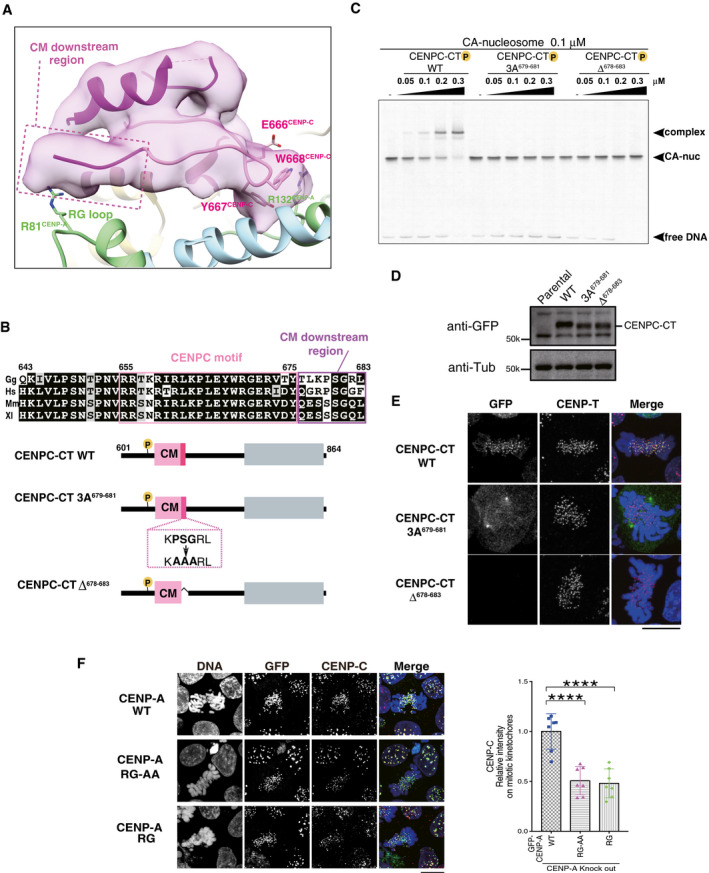
The RG loopCENP‐A binding site of CENPC‐CT is shown. The backbone structure of the CENPC‐CT is presented in a cartoon model, which is colored in magenta, except for the pink canonical CENPC motif (aa 655‐675). The cryo‐EM density map of CENPC‐CT is overlaid on the cartoon model. The CM downstream region beyond Y675CENP‐C is indicated by a dotted box. Key residues involved in binding to the C‐terminal tail of CENP‐A are indicated as stick models. The cartoon models of CENP‐A and histone H4 are shown in pale green and pale blue, respectively.
Alignment of sequences around the CENPC motif region of CENP‐C from various species: Gg, chicken; Hs, human; Mm, mouse; and Xl, frog. The CENPC motif and the CM downstream region are depicted by pink and purple boxes, respectively, in the sequence alignment. Schematic diagram of chicken CENPC‐CT wild‐type (CENPC‐CT WT), CENPC‐CT, in which PSG residues in the CM downstream region were substituted with AAA (CENPC‐CT 3A679‐681), and CENPC‐CT, in which six residues were deleted (CENPC‐CT Δ678‐683), are shown.
EMSA results of the binding affinities of CENPC‐CT WT, CENPC‐CT 3A679‐681, and CENPC‐CT Δ678‐683 to the CENP‐A nucleosome.
Stable expression of GFP‐fused CENPC‐CT and its mutants (shown in (B)) in CENP‐C knockout chicken DT40 cells. α‐Tubulin (Tub) was probed as a loading control. Parental CENP‐C knockout cells (parental) were also examined.
Localization analysis of GFP‐fused CENPC‐CT WT, CENPC‐CT 3A679‐681, and CENPC‐CT Δ678‐683 (green) on the mitotic chromosomes in chicken DT40 cells. CENP‐T (red) was used as a centromere marker. DNA was stained using 4',6‐diamidino‐2‐phenylindole (DAPI; blue). Scale bar indicates 10 μm.
Localization of CENP‐C in CENP‐A knockout DT40 cells stably expressing GFP‐fused chicken CENP‐A WT, RG‐AA, or ∆RG. Scale bar indicates 10 μm. CENP‐C was stained by an anti‐CENP‐C antibody (red), and DNA was stained by DAPI (blue). CENP‐C signals on kinetochores in mitotic cells were quantified in each cell. Bar graph indicates mean ± SD (n = 7; ****, P < 0.0001, unpaired t‐test, two‐tailed).
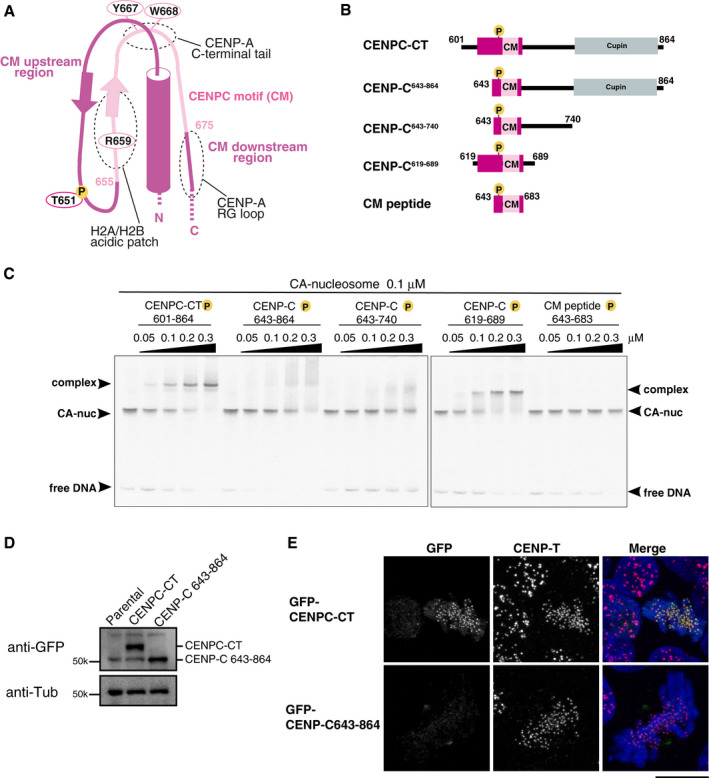
Schematic representation of the structure of the CENP‐A nucleosome‐binding region in CENPC‐CT. The canonical CENPC motif segment is shown in pink. The CDK1 phosphorylation site (T651) is also indicated. The CM upstream and downstream regions are shown in magenta. Dot circles indicate the recognition sites for H2A/B acidic patch, CENP‐A C‐terminal tail, and RG loopCENP‐A.
Schematic diagrams of deletion mutants of chicken CENPC‐CT. The fragments contain the canonical CENPC motif and the CM downstream region. CENP‐C643‐864, CENP‐C643‐740, and CM peptide lack the CM upstream region. CENPC‐CT and CENP‐C619‐689 contain the CM upstream region.
EMSA results of the binding affinities of CENP‐C fragments indicated in (B) to the CENP‐A nucleosome. All fragments were phosphorylated by CDK1.
Stable expression of GFP‐fused CENPC‐CT and CENP‐C643‐864 (shown in (B)) in CENP‐C knockout chicken DT40 cells. α‐Tubulin (Tub) was probed as a loading control.
Localization analysis of GFP‐fused CENPC‐CT and CENP‐C643‐864 lacking the CM upstream region (green) on mitotic chromosomes in CENP‐C knockout DT40 cells. CENP‐T (red) was used as a centromere marker. DNA was stained using DAPI (blue). Scale bar indicates 10 μm.
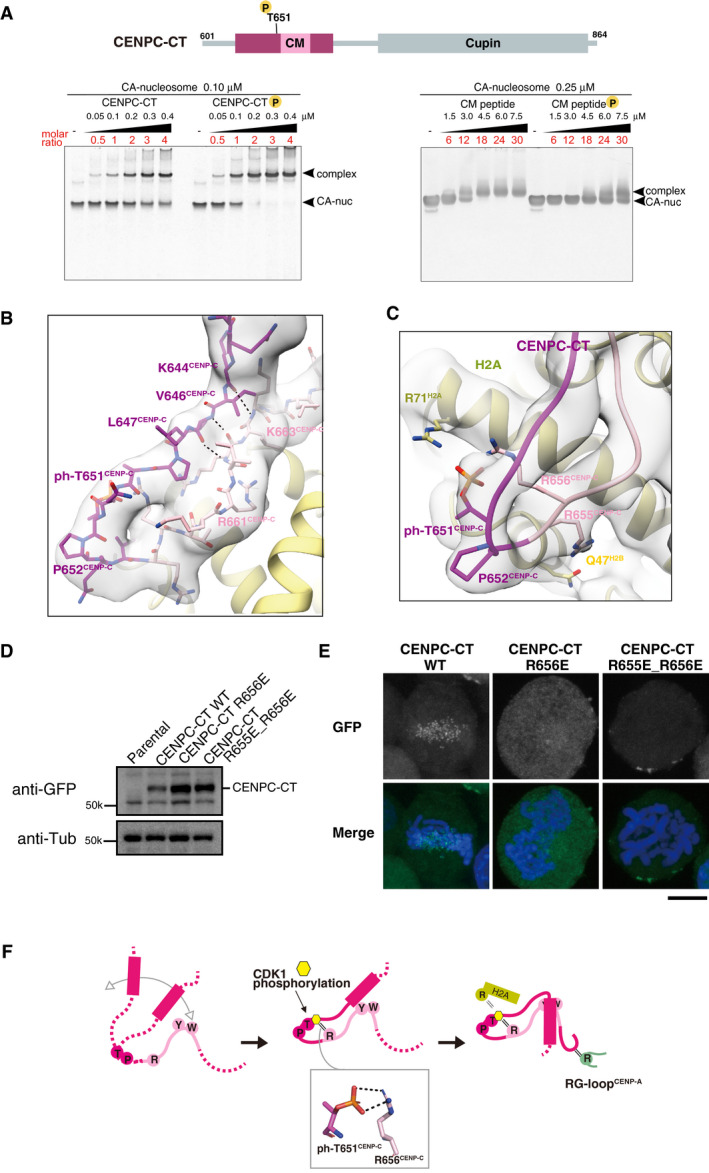
The position of a CDK1 phosphorylation site, T651CENP‐C, is indicated in the diagram of chicken CENPC‐CT. EMSA was performed to examine the binding affinities of phosphorylated or nonphosphorylated CENPC‐CT (left panel) and CM peptide (right panel) to the CENP‐A nucleosome.
Structure of the loop region harboring phosphorylated T651CENP‐C. CENPC‐CT is shown in magenta, except for the pink canonical CENPC motif. The cryo‐EM density map is overlaid on the cartoon model. The main chain interactions forming a short β‐sheet are indicated by black dotted lines.
Magnified view of the structure around phosphorylated T651CENP‐C. Key residues in this region are shown as stick models. The side chains of R656CENP‐C and R71H2A are situated in the vicinity of the phosphoryl group of T651CENP‐C in the distance ranges of 3.5‐4 Å and 3.5‐4.5 Å, respectively.
All constructs analyzed in (E) were stably expressed in CENP‐C knockout cells.
Localization analysis of GFP‐fused CENPC‐CT, CENPC‐CTR656E, and CENPC‐CTR655E_R656E (green) on mitotic chromosomes in chicken DT40 cells. DNA was stained using DAPI (blue). Scale bar indicates 10 μm.
Model indicating the functional role of T651CENP‐C phosphorylation in the CENP‐A‐CENP‐C interaction. Primarily, the CENPC motif associates with CENP‐A nucleosome. Phosphorylation of T651CENP‐C by CDK1 facilitates the loop conformation in the CM upstream region through an intramolecular bridge with the side chain of R656CENP‐C. Subsequently, the N‐terminal α‐helix is folded over to stabilize the CENP‐C‐CENP‐A nucleosome interfaces mediated by the CENPC motif and CM downstream regions.
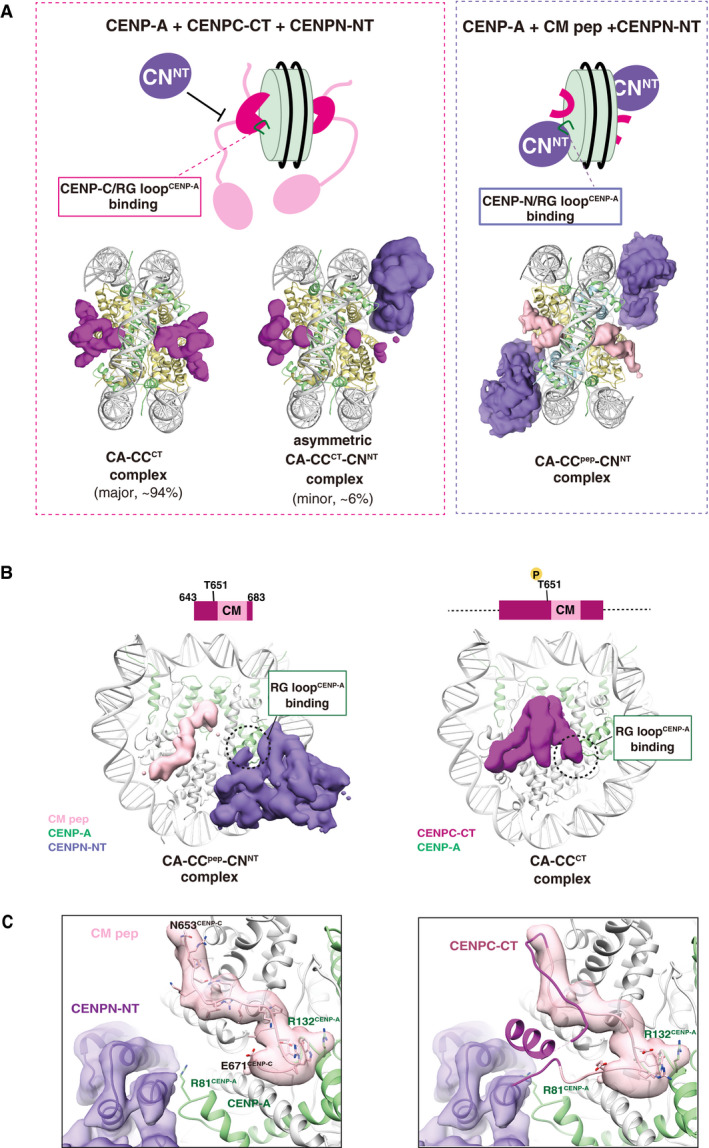
Structural comparison of the CA‐CCCT with CENPN‐NT (left) and CA‐CCpep with CENPN‐NT (right). The cryo‐EM density maps of the CENPC‐CT fragment, CM peptide, and CENPN‐NT are indicated as a surface representation. The cryo‐EM density maps indicate that the structure of the CENP‐A nucleosomes bound with two CENPC‐CT fragments symmetrically (CA‐CCCT complex) comprised approximately 94% of total analyzed particles. The RG loopCENP‐A is occupied by CENPC‐CT in the CA‐CCCT complex and thereby the CENPN‐NT could not access the same side of the nucleosome. The minor fraction (approximately 6% of total analyzed particles) comprised asymmetric CA‐CCCT‐CNNT complexes. In the structures of the CA‐CCpep‐CNNT (right), CM peptide and CENPN‐NT simultaneously bind to the CENP‐A nucleosome.
Side views of the CA‐CCpep‐CNNT and CA‐CCCT complexes. The RG loopCENP‐A binding site in each complex is indicated by a dotted circle.
The left panel contains the structure of the RG loopCENP‐A binding site in the CA‐CCpep‐CNNT complex. R81CENP‐A of the RG loop is recognized by CENPN‐NT. The right panel displays a superposition of the structure of CENPC‐CT in the CA‐CCCT complex on the CA‐CCpep‐CNNT complex shown in the left panel. The model of CM peptide in the CA‐CCpep‐CNNT complex has been removed for clarity. The CENPC motif region in CENPC‐CT is shown in pink. Structural collision between the CM downstream region of CENPC‐CT and CENPN‐NT is shown at RG loopCENP‐A in the CENP‐A nucleosome.
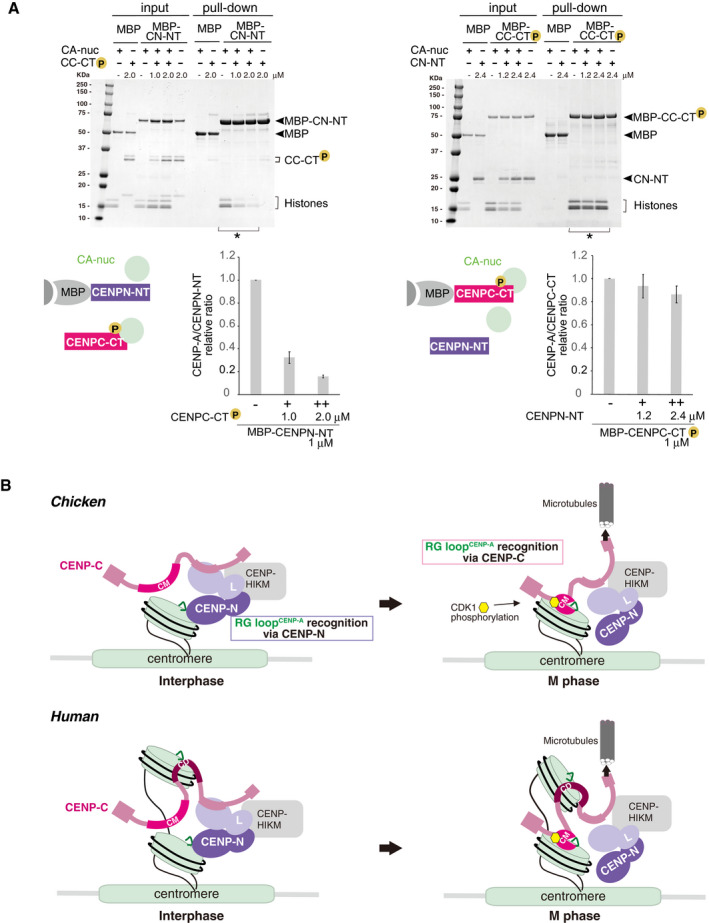
Competitive pull‐down assays for the CENP‐A nucleosome binding of CENPC‐CT and CENPN‐NT. The left panel displays a complex of MBP‐CENPN‐NT (MBP‐CN‐NT) with the CENP‐A nucleosome (CA‐nuc) incubated in the absence or presence of phosphorylated CENPC‐CT (CC‐CT) and pulled down by MBP affinity. The right panel displays a complex of phosphorylated MBP‐CENPC‐CT (MBP‐CC‐CT) with the CENP‐A nucleosome (CA‐nuc) incubated in the absence or presence of CENPN‐NT (CN‐NT) and pulled down by MBP affinity. The signal intensities of all histones in CENP‐A nucleosomes, which were precipitated with MBP proteins in indicated lanes (*), were quantified. The signal intensities were normalized to MBP‐CN‐NT or MBP‐CC‐CT signals. Bar graph indicates mean with SD (n = 3).
A model of the dynamic change of binding partners of the CENP‐A nucleosome during the cell cycle progression in chicken (upper) or human (bottom). During the interphase, chicken CENP‐C without phosphorylation at T651 is dissociated from the CENP‐A nucleosome. Then, CENP‐N can bind to the RG loopCENP‐A of the CENP‐A nucleosome in interphase cells. In mitosis, the CENP‐C C‐terminal region is phosphorylated by CDK1, and this phosphorylation facilitates CENP‐A‐CENP‐C interaction. The stable CENP‐A‐CENP‐C interaction excludes CENP‐N from the RG loop. This phospho‐regulation by the CENP‐C C‐terminal region is conserved in chicken and human. In humans, the second CENP‐A binding region (central domain, CD) might associate with the CENP‐A nucleosome throughout the cell cycle. However, it is still unclear how CD is involved in formation of centromeric chromatin structure (bottom).
References
-
- Arimura Y, Tachiwana H, Oda T, Sato M, Kurumizaka H (2012) Structural analysis of the hexasome, lacking one histone H2A/H2B dimer from the conventional nucleosome. Biochemistry 51: 3302–3309 - PubMed
Publication types
MeSH terms
Substances
Associated data
- Actions
- Actions
LinkOut - more resources
Full Text Sources
Other Literature Sources
Molecular Biology Databases
Miscellaneous
