. 2021 Jan;9(2):e14724.
doi: 10.14814/phy2.14724.

Choice of cystometric technique impacts detrusor contractile dynamics in wistar rats

Affiliations

Choice of cystometric technique impacts detrusor contractile dynamics in wistar rats

Daniel Medina-Aguinaga et al. Physiol Rep. 2021 Jan.

Abstract

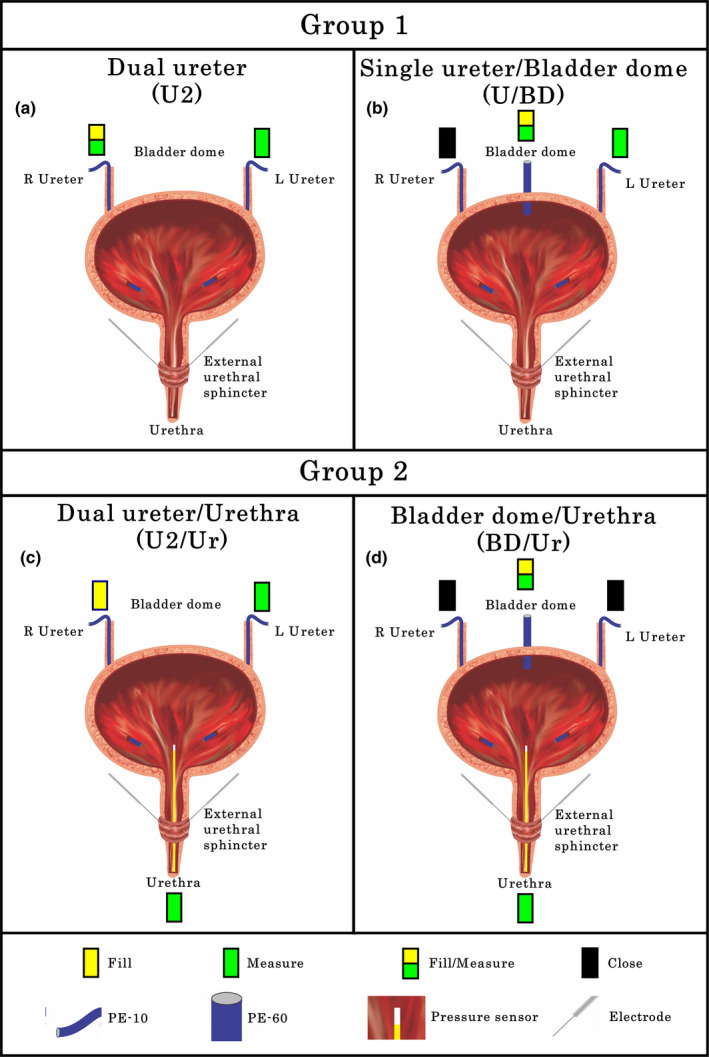
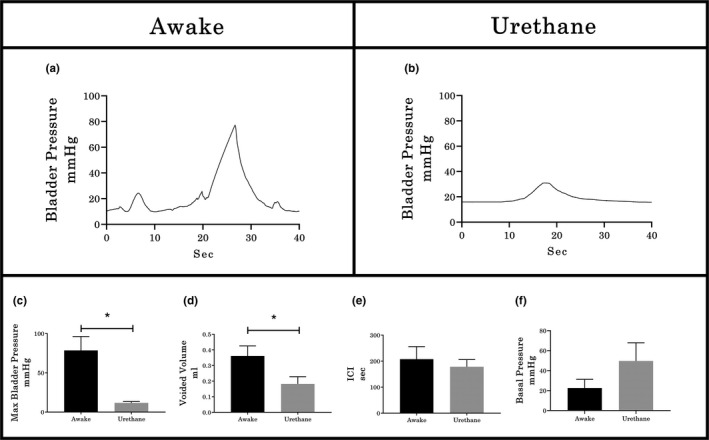
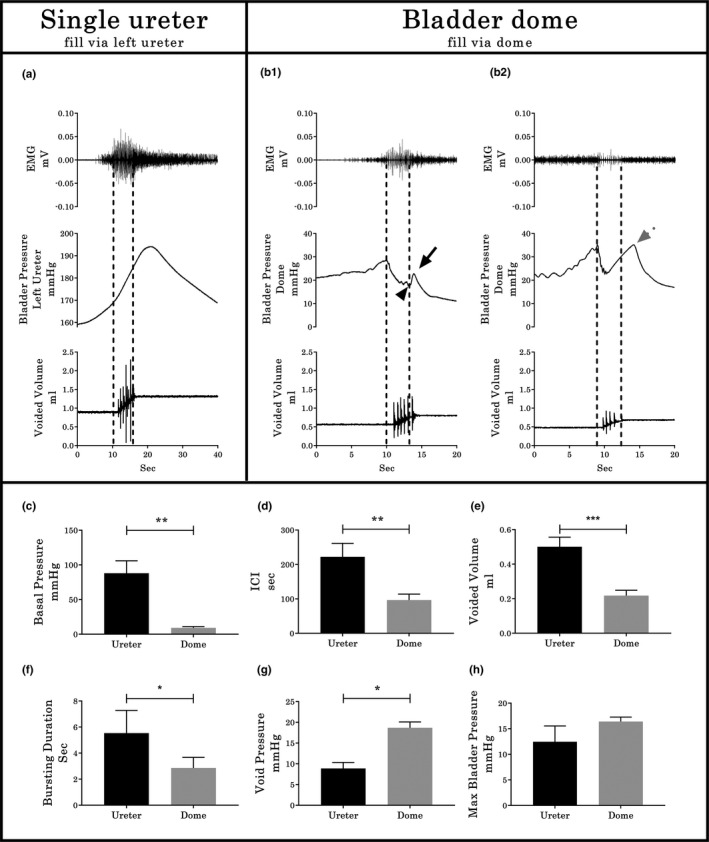
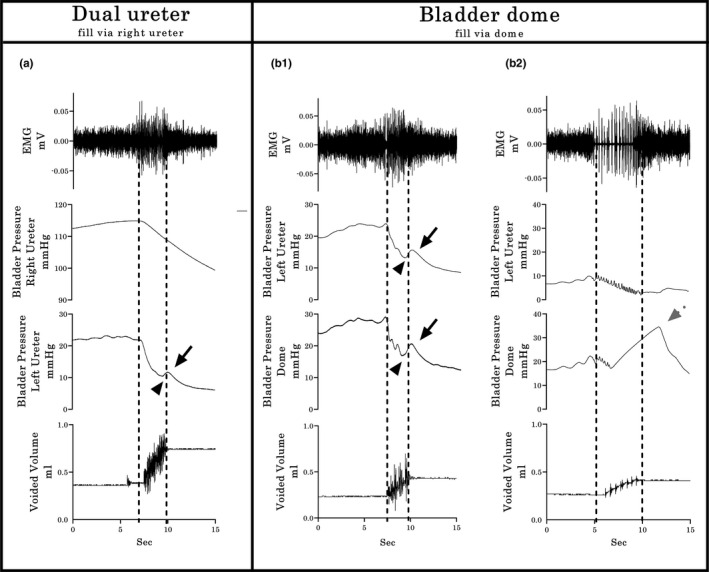
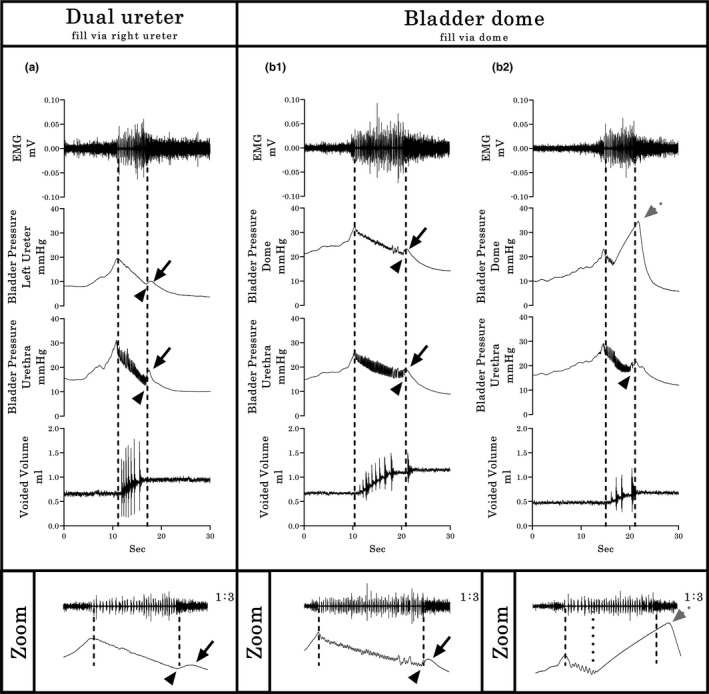
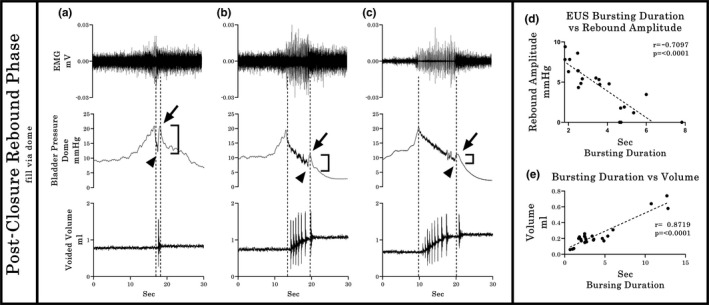
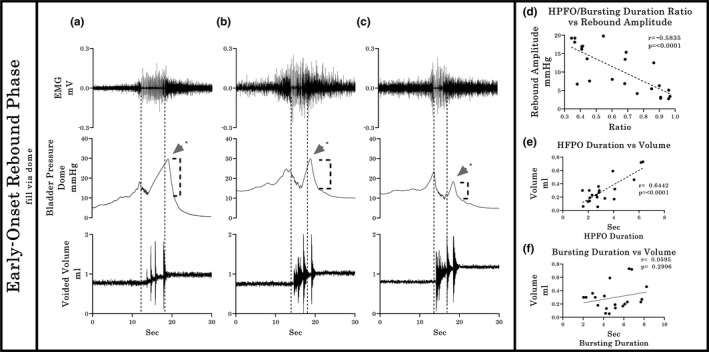
The objective of the current animal study was to investigate factors contributing to the different phases of the cystometrogram (CMG) in order to address disparities in research data reported in the current literature. Three experiments in 20 female Wistar rats were designed to investigate (1) the effects of anesthesia on the contractile pattern of the bladder during micturition; (2) the impact of the physical characteristics of the CMG technique upon the accuracy of intra-vesical pressure recordings; and (3) identification of physiological and methodological factors associated with the emptying and rebound phases during CMG. Variables tested included awake versus urethane-anesthetized conditions, use of a single catheter for both filling and intra-vesical pressure (Pves) recording versus a separate two catheter approach, and comparisons between ureter, bladder dome, and urethral catheter placements. Both awake and anesthetized conditions contributed to variations in the shape and magnitude of the CMG pressure curves. In addition, catheter size, acute incision of the bladder dome for catheter placement, use of the same catheter for filling and Pves recordings, as well as the placement and positioning of the tubing, all contributed to alterations of the physiological properties and characteristic of the various CMG phases, including the frequent occurrence of an artificial rebound during the third phase of micturition. The present results demonstrate how different experimental conditions lead not only to variability in Pves curves, but consistency of the measurements as well, which needs to be accounted for when interpreting CMG outcome data.

Keywords: bladder; cystometrogram; external urethral sphincter; micturition; urodynamics.


Conflict of interest statement

The authors declare that there is no conflict of interests.

Figures

FIGURE 1
FIGURE 1
Different configurations for non‐stop cystometrograms used in Experiment 3. (a) Two ureter catheter (U2) approach: PE‐10 tubing was placed in the right ureter for saline infusion and Pves measurement. A second PE‐10 tubing in the left ureter was used for Pves measurement only. (b) Single ureter (U) and bladder dome (BD) catheter (U/BD) approach: A PE‐60 catheter was placed in the bladder dome for filling and Pves measurement. A PE‐10 catheter in the left ureter was used for Pves measurement and the right ureter catheter was closed. (c) U2 with urethra catheter (U2/Ur) approach: A PE‐10 tubing was placed in the right ureter for filling and PE‐10 in left ureter for Pves measurement. Additionally, a pressure transducer was placed into the urinary bladder through the urethra. (d) BD with urethra catheter (BD/Ur) approach: A PE‐60 catheter was placed in the bladder dome for filling and Pves measurement and both ureteral catheters were closed. A pressure transducer was placed into the urinary bladder through the urethra
FIGURE 2
FIGURE 2
Examples of CMG in awake and urethane‐anesthetized rats. (a) In awake animals, 24 hours post‐catheter placement, the contractile curves were smooth (with no HFPO or appreciable rebound) with high maximal bladder pressure. (b) After an additional 24 hours, the same animals under urethane anesthesia still had smooth contractile curves but with lower amplitude. Histograms represent the quantification of cystometrographic variables showing that urethane anesthesia results in significantly reduced maximum bladder pressure (c) and void volume (d), but no effect on either intercontractile interval (e; ICI) or basal pressure (f). Values represent mean ± SEM; * indicates p < .05 between groups (paired T‐test)
FIGURE 3
FIGURE 3
Cystometrographic and electromyographic differences between ureter or bladder dome catheterization sites. (a) CMG/EUS‐EMG traces in rats where the bladder was filled via the ureter and the bladder remained intact. (b) CMG/EUS‐EMG traces in rats after subsequent catheterization via an incision of the vesical dome. In both a and b, Pves is recorded through the same catheter used for filling. Note the two different CMG/EUS‐EMG patterns (b1 and b2) for the fill/Pves performed through the bladder dome. Differences found in the baseline pressure (c), ICI (d), voided volume (e), EMG bursting time (f), void pressure (g), and maximal bladder pressure (h) between groups are shown (n = 6, pair‐wise comparisons). In b1, the black arrowhead indicates the closing pressure and the black arrow the post‐closing pressure rebound phase. In b2, the dotted gray arrow indicates an early onset rebound phase. Values represent mean ± SD. * indicates p < .05; ** indicates p < .01; *** indicates p < .001 by paired T‐test
FIGURE 4
FIGURE 4
Typical Group 1 examples of bladder pressure curves recorded by different cystometrographic techniques. (a) The dual ureter shows a dimorphic pattern: The Pves shape obtained by the right catheter, which was used for filling and measurement, has a continuous descending pressure, even during expulsion of urine, without HFPO in the plateau phase and rebound effects. The second pattern, obtained simultaneously through the left catheter, which was used only for Pves measurement, includes the second CMG phase plateau with HFPO’s and similar timing in relation to bursting time and urine flow (dashed lines), with small amplitude rebound events in the third phase (black solid arrows indicate rebound phase of the pressure curve; arrowheads indicate closing pressure). (b1 & b2) Filling through a dome‐placed catheter shows two distinct response patterns (as in Experiment 2; see Figure 3(b)). However, in this experiment, the simultaneous Pves only ureter recordings indicate a profound post‐void pressure increase coupled with a reduced HFPO duration within the pressure curve recorded with the dome catheter (gray dotted arrow in b2), indicating early onset of the rebound phase. Shown from top to bottom are the EMG’s of the external urethral sphincter (EUS), the Pves curves obtained by a catheter (in a, right ureter for both fill and Pves recording and left ureter from Pves‐measure only; in b, left ureter for Pves‐measure only and bladder dome for fill and Pves record), and the volume captured during the voids. Dashed vertical lines show the onset and offset of EUS‐EMG bursting, thereby highlighting the temporal relationship to changes in the other dependent measures
FIGURE 5
FIGURE 5
Typical Group 2 examples of bladder pressure curves recorded by different cystometrographic techniques. Shown from top to bottom are the EMG’s of the external urethral sphincter (EUS), the Pves curves obtained by a catheter (ureteral from Pves‐only catheter in a or bladder dome from same fill catheter in b), the Pves recorded by a pressure transducer placed in the bladder through the urethra, and the volume captured during the voids. Dashed vertical lines show the onset and offset of EUS‐EMG bursting, thereby highlighting the temporal relationship to changes in the other dependent measures. At the bottom of each column, a zoomed (1:3) image of the EUS‐EMG and corresponding CMG traces are shown, indicating with black arrowheads the closing pressure (CP) and with black arrows the rebound phase of the pressure curve. (a) The dual ureter with urethra placement shows similar timing in relation to bursting time and urine flow, with a small amplitude post‐closure rebound phase (PC‐RP). (b1 & b2) Filling through a dome‐placed catheter shows two distinct response patterns. The first pattern (b1) consists of both Pves recordings, urethral and dome, with identical PC‐RP patterns as with the ureter filling in a. Importantly, although the second pattern (b2) shows the same PC‐RP pattern in the urethral sensor, the dome catheter recording again indicates a profound post‐void pressure increase coupled with a reduced HFPO duration (gray dotted arrow). The dotted line in the zoomed figure of b2 highlights the temporal discoordination between the onset of the early onset of the rebound phase (EO‐RP) and the offset of the EUS‐EMG bursting
FIGURE 6
FIGURE 6
Relationship between EUS burst duration, HFPOs duration, rebound amplitude, and voided volume in the Post‐Closure Rebound Phase group. Typical examples (a–c), showing the variability of Pves amplitude in the third phase of micturition. In the PC‐RP group, the EUS burst duration and Pves rebound amplitude showed a negative relationship (r = −0.7097), indicating a shorter burst duration is associated with a larger amplitude rebound (d). At the same time, the EUS bursting duration correlates positively (r = 0.8719) with the voided volume in this group (e)
FIGURE 7
FIGURE 7
Relationship between EUS burst duration, HFPOs duration, rebound amplitude, and voided volume in the Early Onset—Rebound Phase group. For the EO‐RP patterns (typical examples provided in a–c), a negative correlation (r = −0.5835) was found for the Pves rebound amplitude and the Bursting/ HPFO duration ratio, meaning that the earliest occurrences of the onset of the Pves rise in relation with the EUS‐EMG bursting offset correlates with larger maximum rebound amplitude (a). There is also a positive correlation (r = 0.6442) between the HFPO duration and the voided volume (e). However, the direct proportionality between the duration of the EUS‐EMG bursting duration and voided volume is lost (f; p = 0.2996). The dotted vertical lines show the temporal relationship between the bursting period, the HFPO and the duration of urine flow

Similar articles

Cited by

References

    1. Andersson, K.‐E. , Soler, R. , & Füllhase, C. (2011). Rodent models for urodynamic investigation. Neurourology and Urodynamics, 30(5), 636–646. - PubMed
    1. Birder, L. A. (2006). Urinary bladder urothelium: Molecular sensors of chemical/thermal/mechanical stimuli. Ascular Pharmacology, 45(4), 221–226. - PubMed
    1. Birder, L. , Kullmann, F. A. , Lee, H. , Barrick, S. , de Groat, W. , Kanai, A. , & Caterina, M. (2007). Activation of urothelial transient receptor potential vanilloid 4 by 4α‐phorbol 12,13‐didecanoate contributes to altered bladder reflexes in the rat. Journal of Pharmacology and Experimental Therapeutics, 323(1), 227–235. - PubMed
    1. Brantley, S. F. , Quesada, E. M. , & David, C. (1964). Studies on the dynamics of micturition: Observations on healthy men*. Journal of Urology, 92(5), 455–463. - PubMed
    1. Cannon, T. W. , & Damaser, M. S. (2001). Effects of anesthesia on cystometry and leak point pressure of the female rat. Life Sciences, 69, 1193–1202. - PubMed

Publication types

LinkOut - more resources