Review
. 2021 Mar;298(3):517-530.
doi: 10.1148/radiol.2020200028. Epub 2021 Jan 19.

Molecular Imaging Approaches in Dementia

Affiliations
Review

Molecular Imaging Approaches in Dementia

Victor L Villemagne et al. Radiology. 2021 Mar.

Abstract

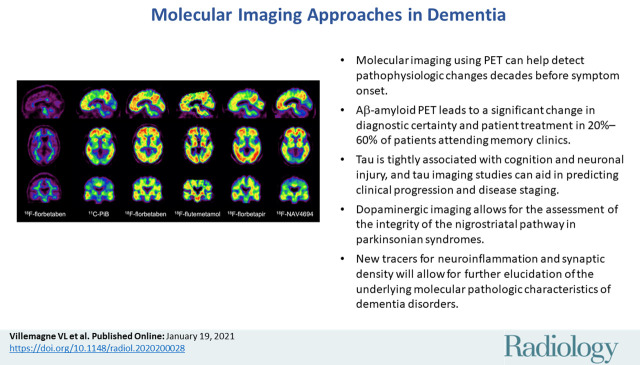
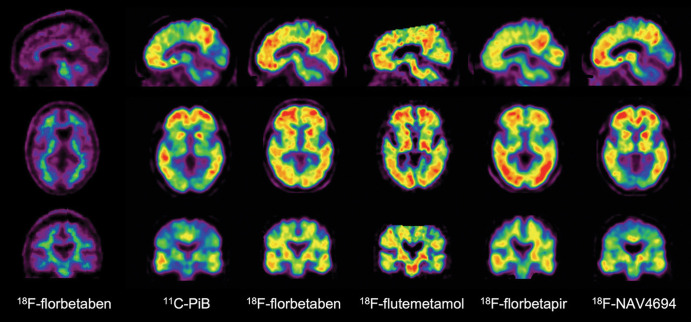
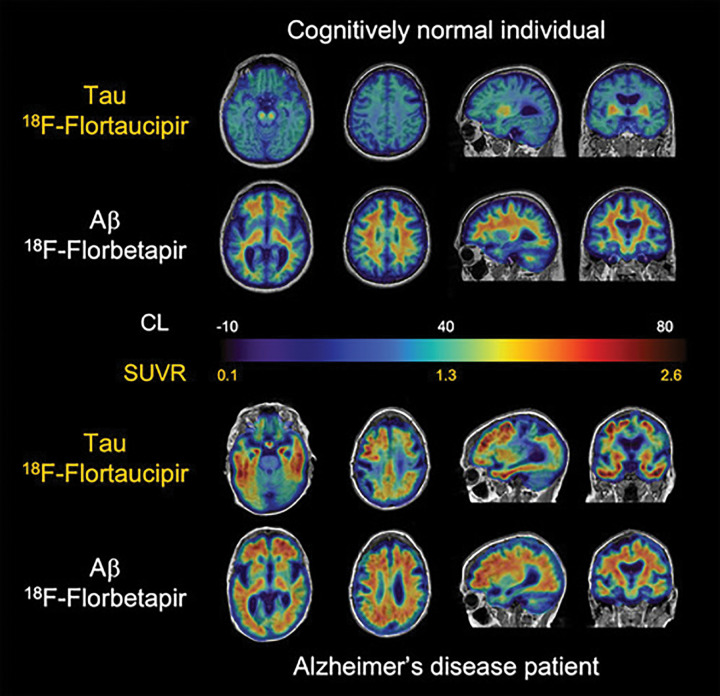
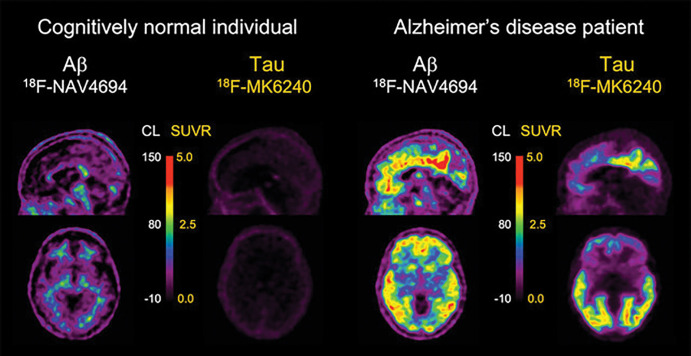
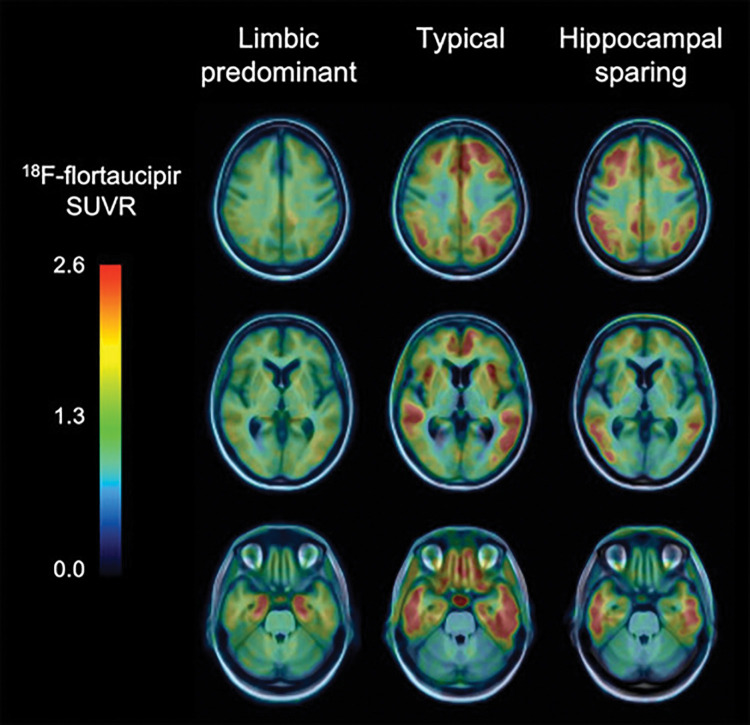
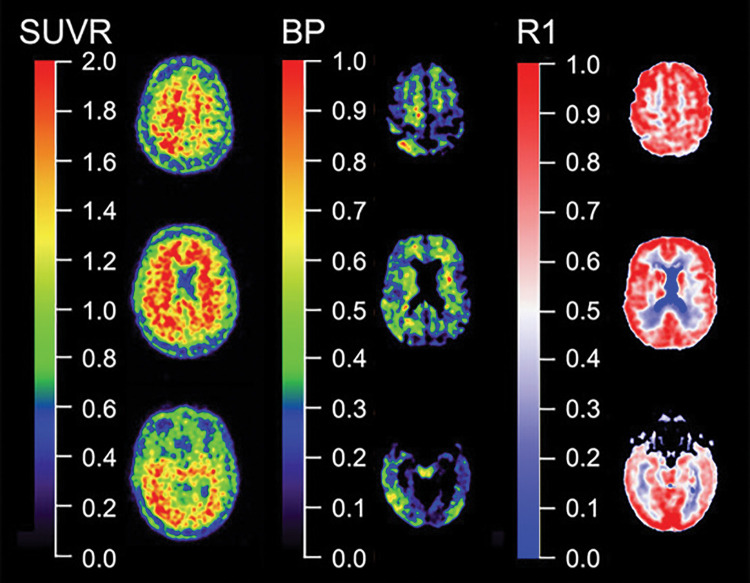
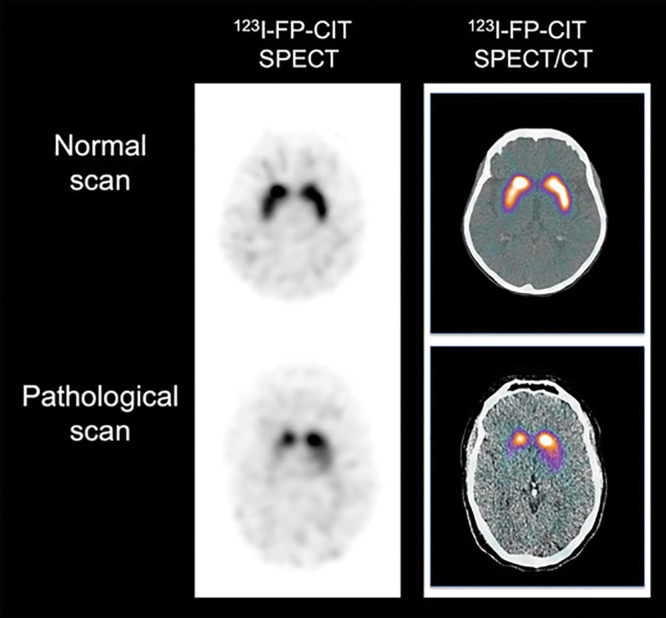
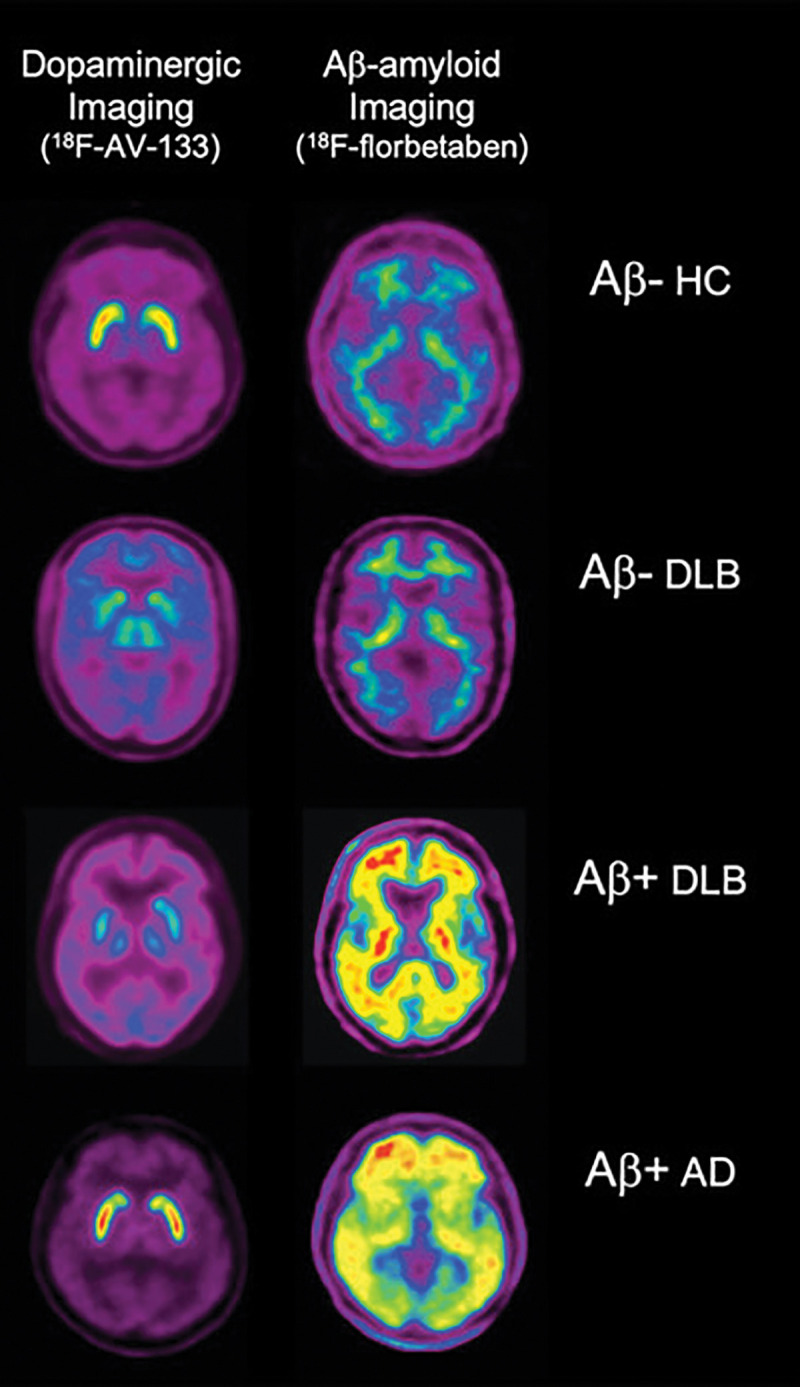
The increasing prevalence of dementia worldwide places a high demand on healthcare providers to perform a diagnostic work-up in relatively early stages of the disease, given that the pathologic process usually begins decades before symptoms are evident. Structural imaging is recommended to rule out other disorders and can only provide diagnosis in a late stage with limited specificity. Where PET imaging previously focused on the spatial pattern of hypometabolism, the past decade has seen the development of novel tracers to demonstrate characteristic protein abnormalities. Molecular imaging using PET/SPECT is able to show amyloid and tau deposition in Alzheimer disease and dopamine depletion in parkinsonian disorders starting decades before symptom onset. Novel tracers for neuroinflammation and synaptic density are being developed to further unravel the molecular pathologic characteristics of dementia disorders. In this article, the authors review the current status of established and emerging PET tracers in a diagnostic setting and also their value as prognostic markers in research studies and outcome measures for clinical trials in Alzheimer disease.


Figures

None
Graphical abstract
Aβ imaging. Representative sagittal, transaxial, and coronal PET images in control patient without cognitive impairment (left column) and five different patients with Alzheimer disease (AD). At visual inspection, fluorine 18 (18F) florbetaben scan in control patient without cognitive impairment shows nonspecific tracer retention in white matter. All patients with AD have present high Aβ burdens, reflected in marked radiotracer retention in cortical and subcortical gray matter areas. Cortical tracer retention is higher in patients with AD compared with the control patient, leading to blurring of normally visible gray matter and white matter interface. Tracer retention in AD is particularly higher in frontal, cingulate, precuneus, striatum, parietal, and lateral temporal cortices, whereas occipital, sensorimotor, and mesial temporal lobes are much less affected. All of these tracers show a variable degree of nonspecific binding to white matter. Patients with AD were scanned with carbon 11 Pittsburgh compound B (11C-PiB), 18F-florbetaben, 18F-flutemetamol, 18F-florbetapir, and 18F-NAV-4696. 18F-flutemetamol (Vizamyl; GE Healthcare), 18F-florbetaben (Neuraceq; Life Molecular Imaging), and 18F-florbetapir (Amyvid; Avid Radiopharmaceuticals) have already been approved for clinical use by the U.S. Food and Drug Administration and European Medicines Agency. A binary visual readout approach ruling out Aβ-amyloid pathologic findings is recommended for the clinically approved tracers and is the one used for exclusion and/or inclusion in most anti-Aβ-amyloid therapeutic trials.
Figure 1:
Aβ imaging. Representative sagittal, transaxial, and coronal PET images in control patient without cognitive impairment (left column) and five different patients with Alzheimer disease (AD). At visual inspection, fluorine 18 (18F) florbetaben scan in control patient without cognitive impairment shows nonspecific tracer retention in white matter. All patients with AD have present high Aβ burdens, reflected in marked radiotracer retention in cortical and subcortical gray matter areas. Cortical tracer retention is higher in patients with AD compared with the control patient, leading to blurring of normally visible gray matter and white matter interface. Tracer retention in AD is particularly higher in frontal, cingulate, precuneus, striatum, parietal, and lateral temporal cortices, whereas occipital, sensorimotor, and mesial temporal lobes are much less affected. All of these tracers show a variable degree of nonspecific binding to white matter. Patients with AD were scanned with carbon 11 Pittsburgh compound B (11C-PiB), 18F-florbetaben, 18F-flutemetamol, 18F-florbetapir, and 18F-NAV-4696. 18F-flutemetamol (Vizamyl; GE Healthcare), 18F-florbetaben (Neuraceq; Life Molecular Imaging), and 18F-florbetapir (Amyvid; Avid Radiopharmaceuticals) have already been approved for clinical use by the U.S. Food and Drug Administration and European Medicines Agency. A binary visual readout approach ruling out Aβ-amyloid pathologic findings is recommended for the clinically approved tracers and is the one used for exclusion and/or inclusion in most anti-Aβ-amyloid therapeutic trials.
Aβ and tau imaging. Representative transaxial, sagittal, and coronal Aβ-amyloid fluorine 18 (18F) florbetapir and tau (18F-flortaucipir) PET images overlayed on MRI scans in individual with normal cognition (top two rows) and patient with Alzheimer disease (AD) (bottom two rows). Individual with normal cognition has typical pattern of flortaucipir off-target binding in basal ganglia and choroid plexus but minimal on-target binding related to tau accumulation in medial temporal lobe or throughout cortex. Florbetapir PET images are representative of typical “negative” Aβ-amyloid scan, showing typical widespread nonspecific retention throughout white matter, but this retention does not extend to cortex. Although patient with AD has similar flortaucipir off-target binding, there is extensive and marked on-target tracer retention in medial and lateral temporal lobes, extending to frontal and parietal lobes, despite considerable atrophy that is apparent from structural MRI. Florbetapir PET scans show Aβ-amyloid accumulation distributed relatively uniformly throughout neocortex. CL = Centiloids, SUVR = standardized uptake value ratio.
Figure 2:
Aβ and tau imaging. Representative transaxial, sagittal, and coronal Aβ-amyloid fluorine 18 (18F) florbetapir and tau (18F-flortaucipir) PET images overlayed on MRI scans in individual with normal cognition (top two rows) and patient with Alzheimer disease (AD) (bottom two rows). Individual with normal cognition has typical pattern of flortaucipir off-target binding in basal ganglia and choroid plexus but minimal on-target binding related to tau accumulation in medial temporal lobe or throughout cortex. Florbetapir PET images are representative of typical “negative” Aβ-amyloid scan, showing typical widespread nonspecific retention throughout white matter, but this retention does not extend to cortex. Although patient with AD has similar flortaucipir off-target binding, there is extensive and marked on-target tracer retention in medial and lateral temporal lobes, extending to frontal and parietal lobes, despite considerable atrophy that is apparent from structural MRI. Florbetapir PET scans show Aβ-amyloid accumulation distributed relatively uniformly throughout neocortex. CL = Centiloids, SUVR = standardized uptake value ratio.
Aβ and tau imaging. Representative transaxial and sagittal Aβ-amyloid and tau PET images in older control patient with normal cognition (left) and in patient with Alzheimer disease (AD) (right) obtained with fluorine 18 (18F) NAV4694 for Aβ and 18F-MK6240 for tau, respectively. 18F-NAV4694 images show typical nonspecific tracer retention in white matter in control patient with normal cognition, whereas typical pattern of tracer retention in frontal, temporal, and posterior cingulate cortices is observed in patient with AD. 18F-MK6240 images show low tracer brain retention in control patient with normal cognition, whereas in patient with AD, a typical widespread pattern of high-contrast tracer retention, involving mesial temporal lobes and temporoparietal and posterior cingulate areas, and to a lesser extent in prefrontal cortex, is observed. Faint off-target retention in meninges is clearly observed in control patient with normal cognition. CL = Centiloids, SUVR = standardized uptake value ratio.
Figure 3:
Aβ and tau imaging. Representative transaxial and sagittal Aβ-amyloid and tau PET images in older control patient with normal cognition (left) and in patient with Alzheimer disease (AD) (right) obtained with fluorine 18 (18F) NAV4694 for Aβ and 18F-MK6240 for tau, respectively. 18F-NAV4694 images show typical nonspecific tracer retention in white matter in control patient with normal cognition, whereas typical pattern of tracer retention in frontal, temporal, and posterior cingulate cortices is observed in patient with AD. 18F-MK6240 images show low tracer brain retention in control patient with normal cognition, whereas in patient with AD, a typical widespread pattern of high-contrast tracer retention, involving mesial temporal lobes and temporoparietal and posterior cingulate areas, and to a lesser extent in prefrontal cortex, is observed. Faint off-target retention in meninges is clearly observed in control patient with normal cognition. CL = Centiloids, SUVR = standardized uptake value ratio.
Tau imaging helps identify pathologic subtypes in Alzheimer disease (AD). Fluorine 18 (18F) flortaucipir PET images in three patients with AD show three different pathologic subtypes of AD: limbic predominant (left column) with tracer retention mostly restricted to mesial temporal lobes, typical presentation (center column) with widespread retention in both mesial temporal lobes and neocortical areas, and hippocampal sparing subtype (right column) where tracer retention is predominantly in neocortex. SUVR = standardized uptake value ratio.
Figure 4:
Tau imaging helps identify pathologic subtypes in Alzheimer disease (AD). Fluorine 18 (18F) flortaucipir PET images in three patients with AD show three different pathologic subtypes of AD: limbic predominant (left column) with tracer retention mostly restricted to mesial temporal lobes, typical presentation (center column) with widespread retention in both mesial temporal lobes and neocortical areas, and hippocampal sparing subtype (right column) where tracer retention is predominantly in neocortex. SUVR = standardized uptake value ratio.
Quantitative versus semiquantitative imaging. Representative standard uptake value ratio (SUVR) (left column), binding potential (BP) (center column), and relative perfusion measure (R1) (right column) carbon 11 Pittsburgh compound B images. In contrast with semiquantitative SUVR from a 20–30–minute static acquisition, quantitative parametric BP images derived from dynamic acquisition not only yield much higher contrast images than SUVR, facilitating visual inspection by eliminating nonspecific binding, but dynamic acquisition also allows for quantification of regional relative perfusion measures that add valuable information for assessment of a patient or therapeutic trial participant.
Figure 5:
Quantitative versus semiquantitative imaging. Representative standard uptake value ratio (SUVR) (left column), binding potential (BP) (center column), and relative perfusion measure (R1) (right column) carbon 11 Pittsburgh compound B images. In contrast with semiquantitative SUVR from a 20–30–minute static acquisition, quantitative parametric BP images derived from dynamic acquisition not only yield much higher contrast images than SUVR, facilitating visual inspection by eliminating nonspecific binding, but dynamic acquisition also allows for quantification of regional relative perfusion measures that add valuable information for assessment of a patient or therapeutic trial participant.
Dopaminergic imaging with SPECT. Representative transaxial iodine 123–2β-carbomethoxy-3β-(4-iodophenyl)-N-(3-fluoropropyl)-nortropane (123I-FP-CIT) SPECT (left column) and 123I-FP-CIT SPECT/CT (right column) images show normal binding of tracer (top row) in healthy control patient with symmetrical and homogeneous tracer retention in striatum. Bottom row shows pathologic 123I-FP-CIT binding, with marked and asymmetric decrease of tracer binding in striatum. Images reflect typical progression of decreased 123I-FP-CIT binding reflecting asymmetric loss of nigrostriatal terminals in striatum, usually starting in tail of putamen progressing rostrally through anterior putamen and into head of caudate nucleus.
Figure 6:
Dopaminergic imaging with SPECT. Representative transaxial iodine 123–2β-carbomethoxy-3β-(4-iodophenyl)-N-(3-fluoropropyl)-nortropane (123I-FP-CIT) SPECT (left column) and 123I-FP-CIT SPECT/CT (right column) images show normal binding of tracer (top row) in healthy control patient with symmetrical and homogeneous tracer retention in striatum. Bottom row shows pathologic 123I-FP-CIT binding, with marked and asymmetric decrease of tracer binding in striatum. Images reflect typical progression of decreased 123I-FP-CIT binding reflecting asymmetric loss of nigrostriatal terminals in striatum, usually starting in tail of putamen progressing rostrally through anterior putamen and into head of caudate nucleus.
Comparison of vesicular monoamine transporter type 2 (VMAT2) imaging with fluorine 18 (18F) AV-133 and Aβ imaging with 18F florbetaben. Representative coregistered transaxial 18F AV-133 and florbetaben PET images in an older healthy control (HC) patient show low Aβ burden and normal striatal VMAT2 densities. PET images in patient with Alzheimer disease (AD) show high Aβ burden and normal striatal VMAT2 densities. For the two patients with dementia with Lewy bodies (DLB), images in patient with DLB with low Aβ burden are indistinguishable from those in the HC patient, and images in patient with DLB with high Aβ burden are indistinguishable from those in the patient with AD. In contrast to Aβ burden images, both patients show markedly reduced VMAT2 densities in striatum, clearly differentiating them from the healthy control patient and the patient with AD. Moreover, PET images provide higher resolution and sensitivity, making separation between caudate and putaminal binding by internal capsule better visible.
Figure 7:
Comparison of vesicular monoamine transporter type 2 (VMAT2) imaging with fluorine 18 (18F) AV-133 and Aβ imaging with 18F florbetaben. Representative coregistered transaxial 18F AV-133 and florbetaben PET images in an older healthy control (HC) patient show low Aβ burden and normal striatal VMAT2 densities. PET images in patient with Alzheimer disease (AD) show high Aβ burden and normal striatal VMAT2 densities. For the two patients with dementia with Lewy bodies (DLB), images in patient with DLB with low Aβ burden are indistinguishable from those in the HC patient, and images in patient with DLB with high Aβ burden are indistinguishable from those in the patient with AD. In contrast to Aβ burden images, both patients show markedly reduced VMAT2 densities in striatum, clearly differentiating them from the healthy control patient and the patient with AD. Moreover, PET images provide higher resolution and sensitivity, making separation between caudate and putaminal binding by internal capsule better visible.
Imaging of astrocytosis. Carbon 11-deuterium-l-deprenyl PET surface projection images of astrocyte activation in healthy control patient and patient with mild cognitive impairment (MCI). Both patients are Aβ-amyloid positive. Color scale indicates modified reference (cerebellar gray matter) Paltak slope values (Nordberg Translational Molecular Imaging Laboratory, Karolinska Institutet, Sweden).
Figure 8:
Imaging of astrocytosis. Carbon 11-deuterium-l-deprenyl PET surface projection images of astrocyte activation in healthy control patient and patient with mild cognitive impairment (MCI). Both patients are Aβ-amyloid positive. Color scale indicates modified reference (cerebellar gray matter) Paltak slope values (Nordberg Translational Molecular Imaging Laboratory, Karolinska Institutet, Sweden).

References

    1. Winblad B, Amouyel P, Andrieu S, et al. Defeating Alzheimer’s disease and other dementias: a priority for European science and society. Lancet Neurol 2016;15(5):455–532. - PubMed
    1. Ten Kate M, Barkhof F, Boccardi M, et al. Clinical validity of medial temporal atrophy as a biomarker for Alzheimer’s disease in the context of a structured 5-phase development framework. Neurobiol Aging 2017;52:167–182.e1. - PubMed
    1. Nelson PT, Dickson DW, Trojanowski JQ, et al. Limbic-predominant age-related TDP-43 encephalopathy (LATE): consensus working group report. Brain 2019;142(6):1503–1527. - PMC - PubMed
    1. Rabinovici GD, Gatsonis C, Apgar C, et al. Association of Amyloid Positron Emission Tomography With Subsequent Change in Clinical Management Among Medicare Beneficiaries With Mild Cognitive Impairment or Dementia. JAMA 2019;321(13):1286–1294. - PMC - PubMed
    1. de Wilde A, van der Flier WM, Pelkmans W, et al. Association of Amyloid Positron Emission Tomography With Changes in Diagnosis and Patient Treatment in an Unselected Memory Clinic Cohort: The ABIDE Project. JAMA Neurol 2018;75(9):1062–1070. - PMC - PubMed

Publication types

Substances

LinkOut - more resources