. 2021 Apr 5;218(4):e20202187.
doi: 10.1084/jem.20202187.

Mapping and role of T cell response in SARS-CoV-2-infected mice

Affiliations

Mapping and role of T cell response in SARS-CoV-2-infected mice

Zhen Zhuang et al. J Exp Med. .

Erratum in

  • Correction: Mapping and role of T cell response in SARS-CoV-2-infected mice.
    Zhuang Z, Lai X, Sun J, Chen Z, Zhang Z, Dai J, Liu D, Li Y, Li F, Wang Y, Zhu A, Wang J, Yang W, Huang J, Li X, Hu L, Wen L, Zhuo J, Zhang Y, Chen D, Li S, Huang S, Shi Y, Zheng K, Zhong N, Zhao J, Zhou D, Zhao J. Zhuang Z, et al. J Exp Med. 2021 Nov 1;218(11):e2020218710052021c. doi: 10.1084/jem.2020218710052021c. Epub 2021 Oct 15. J Exp Med. 2021. PMID: 34653240 Free PMC article. No abstract available.

Abstract

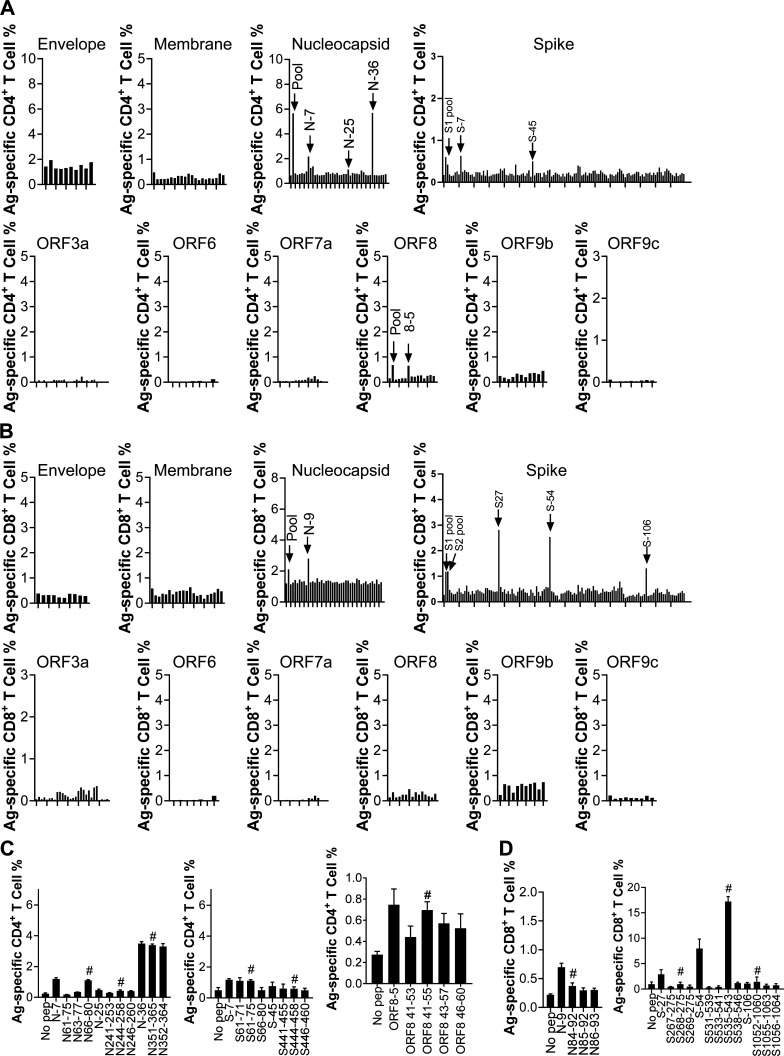
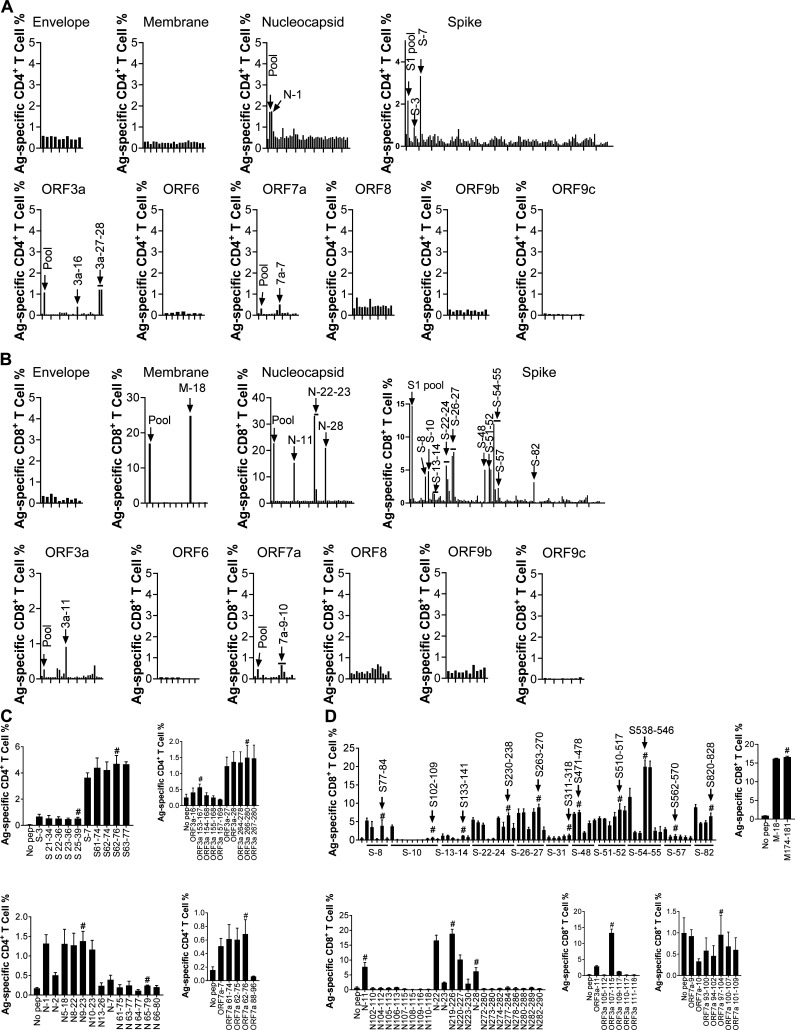
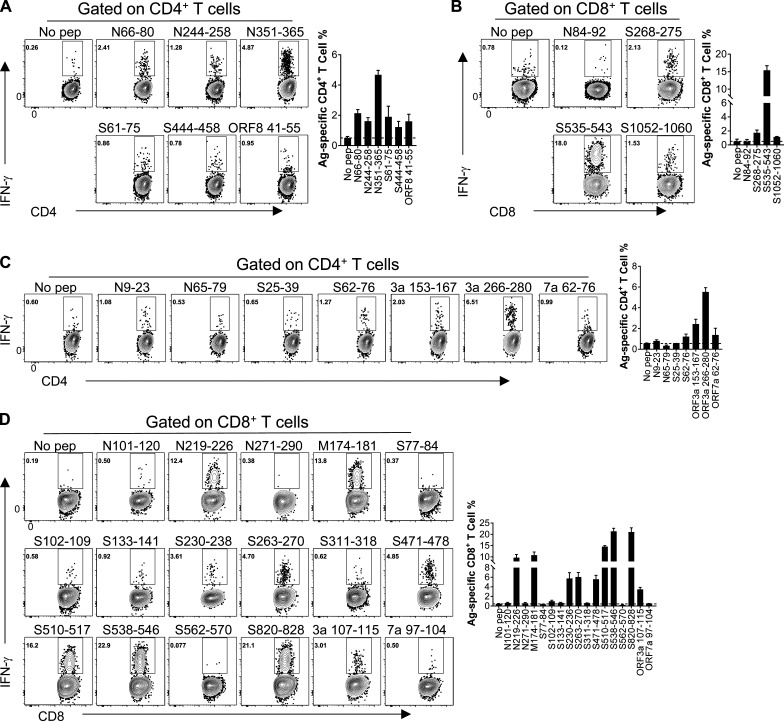
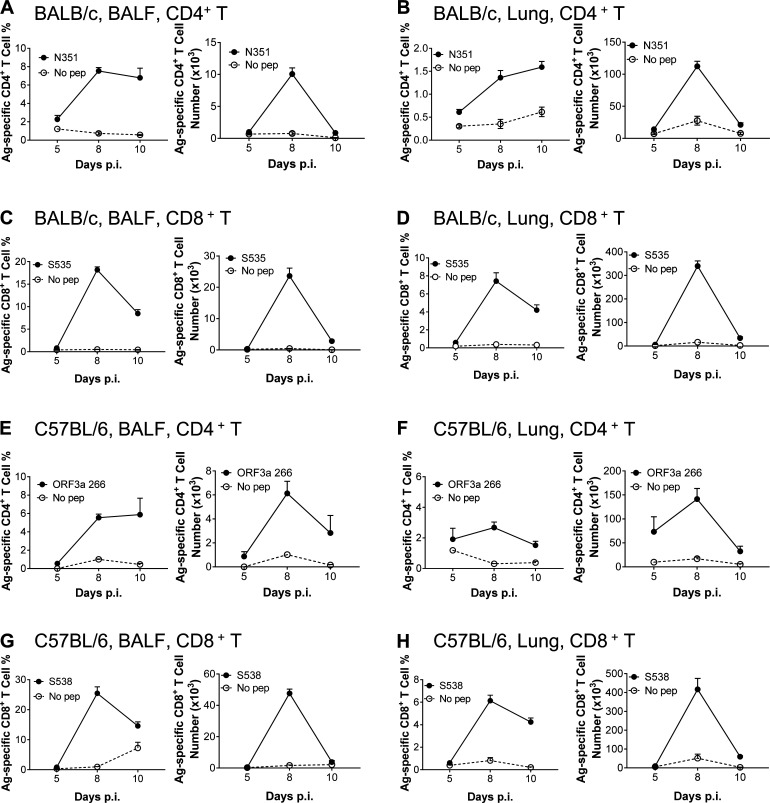
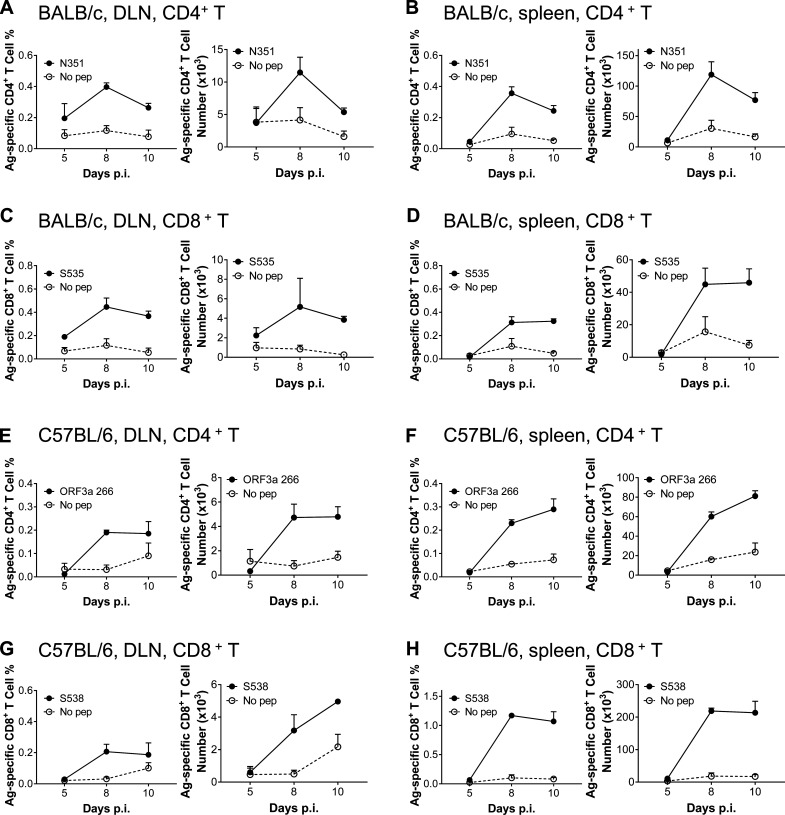
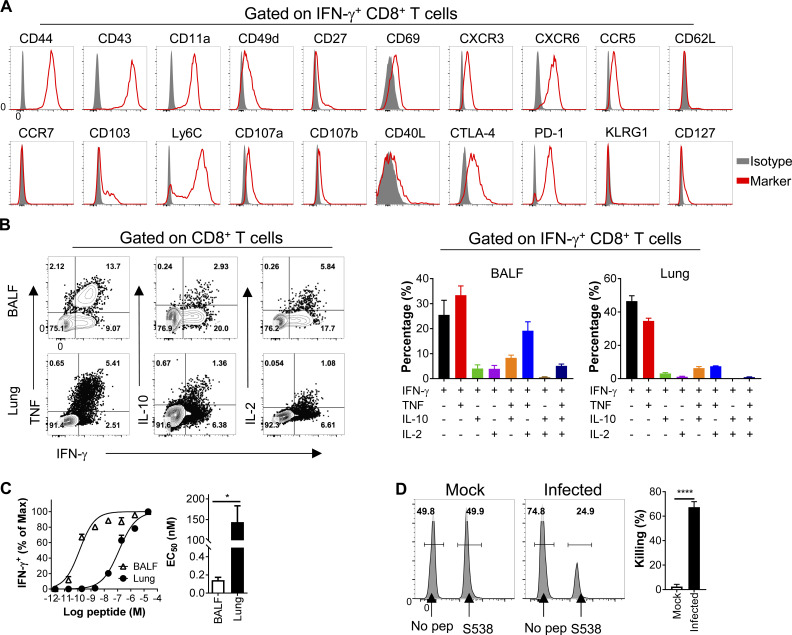
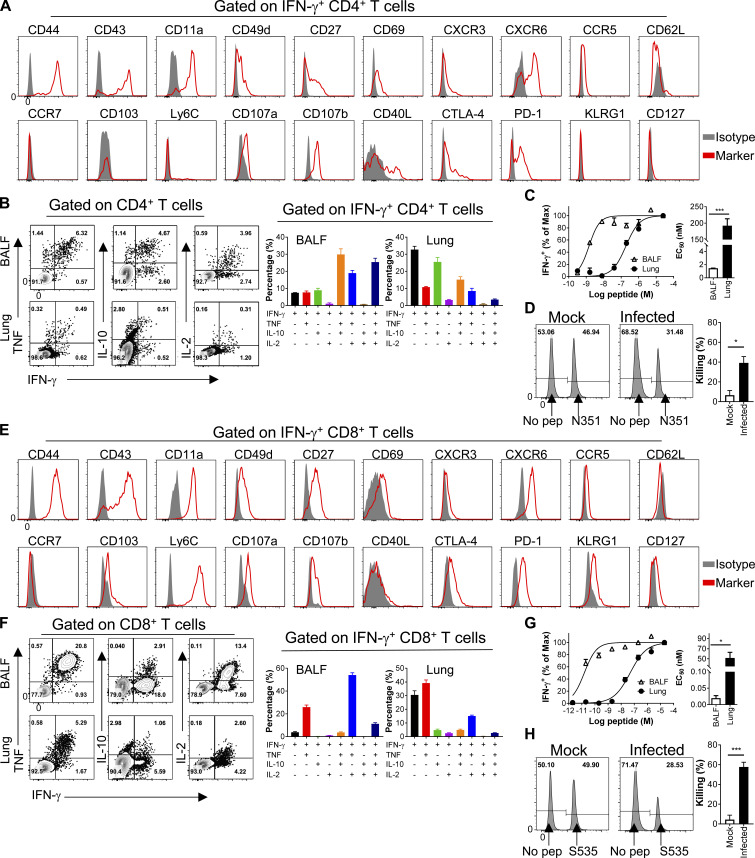
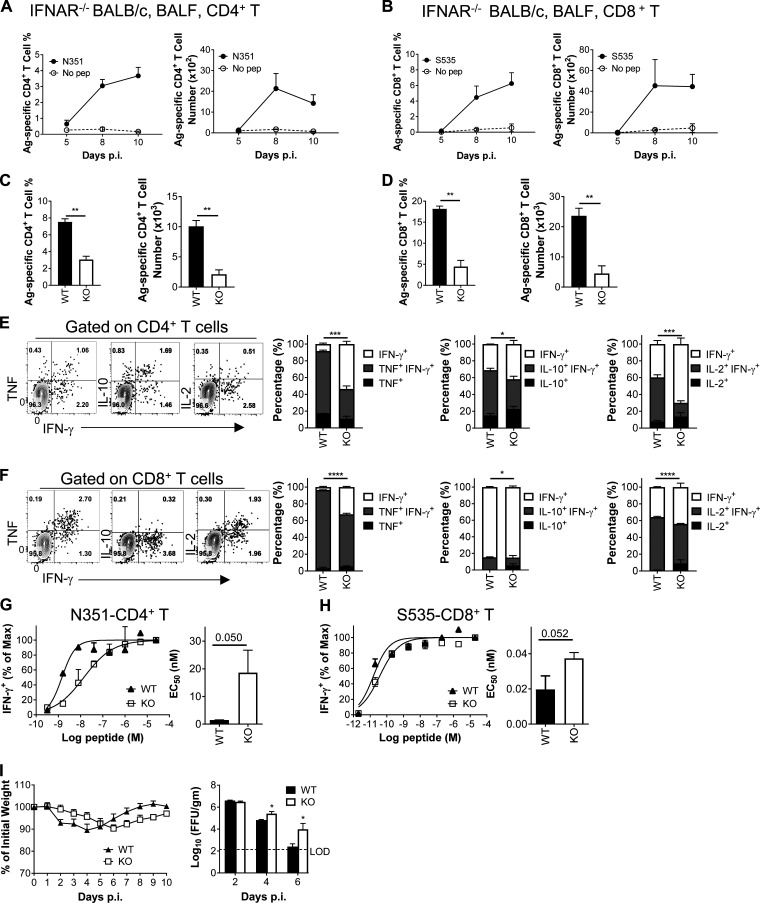
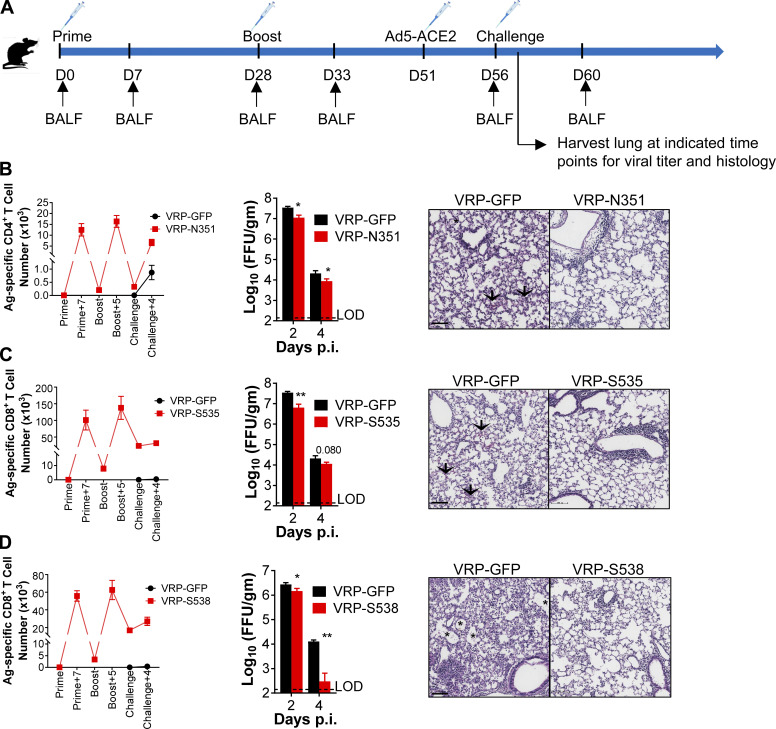
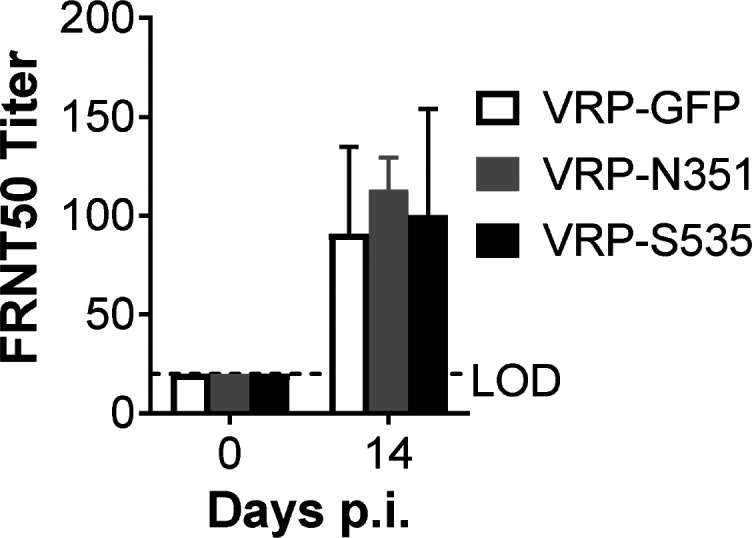
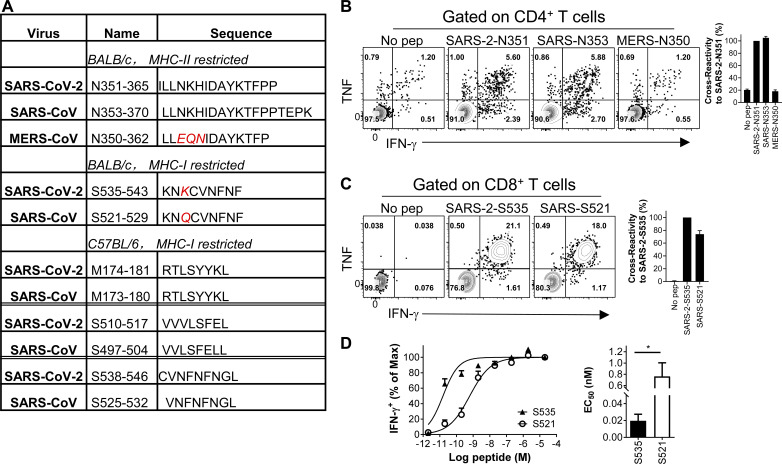
Virus-specific T cells play essential roles in protection against multiple virus infections, including SARS-CoV and MERS-CoV. While SARS-CoV-2-specific T cells have been identified in COVID-19 patients, their role in the protection of SARS-CoV-2-infected mice is not established. Here, using mice sensitized for infection with SARS-CoV-2 by transduction with an adenovirus expressing the human receptor (Ad5-hACE2), we identified SARS-CoV-2-specific T cell epitopes recognized by CD4+ and CD8+ T cells in BALB/c and C57BL/6 mice. Virus-specific T cells were polyfunctional and were able to lyse target cells in vivo. Further, type I interferon pathway was proved to be critical for generating optimal antiviral T cell responses after SARS-CoV-2 infection. T cell vaccination alone partially protected SARS-CoV-2-infected mice from severe disease. In addition, the results demonstrated cross-reactive T cell responses between SARS-CoV and SARS-CoV-2, but not MERS-CoV, in mice. Understanding the role of the T cell response will guide immunopathogenesis studies of COVID-19 and vaccine design and validation.


Conflict of interest statement

Disclosures: The authors declare no competing interests exist.

Figures

Figure S1.
Figure S1.
Mapping SARS-CoV-2 T cell epitopes in BALB/c mice. (A) Lymphocytes from vaccinated lungs were stimulated with 5 µM 20-mer (20 amino acids) peptides. Antigen-specific CD4+ T cell responses were determined by intracellular IFN-γ staining. (B) Lymphocytes from vaccinated lungs were stimulated with 5 µM 20-mer (20 amino acids) peptides. Antigen-specific CD8+ T cell responses were determined. (C) Lymphocytes from vaccinated lungs were stimulated with 5 µM 20-mer (20 amino acids) and corresponding truncated 13–15-mer peptides for 5–6 h in the presence of brefeldin A. Antigen-specific CD4+ T cell responses were determined. (D) Lymphocytes from vaccinated lungs were stimulated with 5 µM 20-mer (20 amino acids) and corresponding truncated 8–9-mer peptides for 5–6 h in the presence of brefeldin A. Antigen-specific CD8+ T cell responses were determined. Candidate truncated epitopes are labeled with # (n = 3; data are representative of at least two independent experiments). All results are expressed as mean ± SEM. Ag, antigen; pep, peptide.
Figure S2.
Figure S2.
Mapping SARS-CoV-2 T cell epitopes in C57BL/6 mice. (A) Lymphocytes from vaccinated lungs were stimulated with 5 µM 20-mer (20 amino acids) peptides. Antigen-specific CD4+ T cell responses were determined by intracellular IFN-γ staining. (B) Lymphocytes from vaccinated lungs were stimulated with 5 µM 20-mer (20 amino acids) peptides. Antigen-specific CD8+ T cell responses were determined. (C) Lymphocytes from vaccinated lungs were stimulated with 5 µM 20-mer (20 amino acids) and corresponding truncated 13–15-mer peptides. Antigen-specific CD4+ T cell responses were determined. (D) Lymphocytes from vaccinated lungs were stimulated with 5 µM 20-mer (20 amino acids) and corresponding truncated 8–9-mer peptides. Antigen-specific CD8+ T cell responses were determined. Candidate truncated epitopes are labeled with # (n = 3; data are representative of at least two independent experiments). All results are expressed as mean ± SEM. Ag, antigen; pep, peptide.
Figure 1.
Figure 1.
Identification of CD4+ and CD8+ T cell epitopes in SARS-CoV-2–infected WT BALB/c and C57BL/6 mice. (A and B) Confirmation of CD4+ T cell epitopes (A) and CD8+ T cell epitopes (B) in infected BALB/c mice. Flow plots and summary columns are shown (n = 3; data verified in two independent experiments). (C and D) Confirmation of CD4+ T cell epitopes (C) and CD8+ T cell epitopes (D) in infected C57BL/6 mice. Flow plots and summary columns are shown (n = 3; data verified in two independent experiments). All results are expressed as mean ± SEM. Ag, antigen; pep, peptide.
Figure 2.
Figure 2.
Kinetics of virus-specific T cell responses in BALF and lung of SARS-CoV-2–infected BALB/c and C57BL/6 mice. (A–D) Lymphocytes from airway and lung of transduced/infected WT BALB/c mice were harvested at indicated time points after infection and stimulated with 5 µM N351 (A and B) and 1 µM S535 (C and D) for 6 h in the presence of brefeldin A. The frequencies (left) and cell numbers of antigen-specific T cells (right) in BALF (A and C) and lung (B and D) are shown (n = 3 or 4 mice; data are representative of three independent experiments). (E–H) Lymphocytes from airway and lung of transduced/infected C57BL/6 mice were harvested at indicated time points and stimulated with 5 µM ORF3a 266 (E and F) and 1 µM S538 (G and H) for 6 h in the presence of brefeldin A. The frequencies (left) and cell numbers (right) of antigen-specific T cells are shown (n = 3 or 4 mice; data are representative of three independent experiments). All results are expressed as mean ± SEM. Ag, antigen; pep, peptide; p.i., post-infection.
Figure S3.
Figure S3.
Kinetics of virus-specific T cell responses in DLNs and spleens of SARS-CoV-2–infected BALB/c and C57BL/6 mice. (A–D) Lymphocytes from DLN and spleen of transduced/infected WT BALB/c mice were harvested at indicated time points after infection and stimulated with 5 µM N351 (A and B) and 1 µM S535 (C and D) for 6 h in the presence of brefeldin A. The frequencies (left) and cell numbers of antigen-specific T cells (right) in DLN (A and C) and spleen (B and D) are shown (n = 3 mice; data are representative of one experiment). (E–H) Lymphocytes from DLN and spleen of transduced/infected C57BL/6 mice were harvested at indicated time points and stimulated with 5 µM ORF3a 266 (E and F) and 1 µM S538 (G and H) for 6 h in the presence of brefeldin A. The frequencies (left) and cell numbers (right) of antigen-specific T cells are shown (n = 3; data are representative of one experiment). All results are expressed as mean ± SEM. Ag, antigen; pep, peptide; p.i., post-infection.
Figure S4.
Figure S4.
SARS-CoV-2–specific CD8+ T cells were polyfunctional in infected C57BL/6 mice. (A) Cells from BALF were stained with antibodies against the indicated markers. Histograms shown here were gated on SARS-CoV-2-S538–specific CD8+ T cells. (B) Cytokine expression of airway derived SARS-CoV-2-S538–specific CD8+ T cells are shown (n = 3 or 4 mice; data are representative of one experiment). (C) Functional avidity curves (left) of airway- and lung-derived SARS-CoV-2-S538–specific CD8+ T cells and the amount of peptide required for half-maximum response (EC50) are shown (right; n = 3; data are representative of two independent experiments; Student’st tests; P value of C is 0.011). (D) Representative flow histograms (left) and killing rates (right) of in vivo cytotoxicity of SARS-CoV-2-S538–specific CD8+ T cells in SARS-CoV-2–infected mice and mock-infected mice are shown (n = 5; data are representative of one experiment; Student’st tests; P value of C is <0.0001). ****, P < 0.0001. All results are expressed as mean ± SEM. Max, maximum; pep, peptide.
Figure 3.
Figure 3.
SARS-CoV-2–specific CD4+ T cells and CD8+ T cells were polyfunctional. (A and E) Phenotyping BALF-derived SARS-CoV-2-N351–specific CD4+ T cells (A) and SARS-CoV-2-S535–specific CD8+ T cells (E). (B and F) Cytokine expression of airway-derived N351-specific CD4+ T cells (B) and S535-specific CD8+ T cells (F) are shown (n = 3 mice; data are representative of two independent experiments). (C and G) Functional avidity curves (left) of airway- and lung-derived N351-specific CD4+ T cells (C) and S535-specific CD8+ T cells (G) and the amount of peptide required for half-maximum response (EC50) are shown (right; n = 3 mice; data are representative of two independent experiments; Student’st tests; P value of C is 0.0004; P value of G is 0.0051). (D and H) Representative flow histograms (left) and killing rates (right) of in vivo cytotoxicity of N351-specific CD4+ T cells (D) and S535-specific CD8+ T cells (H) in SARS-CoV-2–infected mice and mock-infected mice are shown (n = 5 mice per group; data are representative of two independent experiments; Student’st tests; P value of D is 0.0062; P value of H is 0.0002). *, P < 0.05; ***, P < 0.0005. All results are expressed as mean ± SEM. Max, maximum; pep, peptide.
Figure 4.
Figure 4.
IFN-I signaling was critical for the generation of robust T cell responses against SARS-CoV-2 infection. (A and B) Frequencies (left) and cell numbers (right) of airway-derived N351-specific CD4+ T cells (A) and S535-specific CD8+ T cells (B) at indicated time points are shown (n = 3 or 4 mice per time point; data are representative of three independent experiments). (C and D) Airway-derived N351-specific CD4+ T cell responses (C) and S535-specific CD8+ T cell responses (D) in WT and KO BALB/c mice are compared (n = 3 or 4 mice; data are representative of two independent experiments; Student’st tests; P values of C are 0.0006 and 0.0013; P values of D are 0.0005 and 0.0029). (E and F) Representative flow plots of N351-specific CD4+ T cells (E) and S535-specific CD8+ T cells (F) are shown (left). Bi-cytokine expression capability (right three panels) is statistically different between WT and KO mice (n = 3 or 4 mice; data are representative of two independent experiments; Student’st tests; P values of E are 0.0003, 0.0057, and 0.0004; P values of F are <0.0001, 0.0445, and <0.0001). (G and H) Functional avidity curves (left) of N351-specific CD4+ T cells (G) and S535-specific CD8+ T cells (H) in KO and WT mice and the amount of peptide required for half-maximum response (EC50) are shown (right; n = 3 mice; data are representative of two independent experiments; Student’st tests; P value of G is 0.050; P value of H is 0.052). (I) Weight loss and viral titers in the lungs were measured at the indicated time points (n = 3–5 mice per group per time point for viral titer; data are representative of two independent experiments; Student’st tests; P values are 0.0291 and 0.0394). *, P < 0.05; **, P < 0.005; ***, P < 0.0005; ****, P < 0.0001. All results are expressed as mean ± SEM. Ag, antigen; FFU, focus-forming unit; Max, maximum; pep, peptide; p.i., post-infection.
Figure 5.
Figure 5.
Epitope-specific CD4+ and CD8+ T cells partially protected SARS-CoV-2–infected mice from severe disease. (A) Strategy of VRP vaccination and SARS-CoV-2 challenge. (B and C) Effects of N351-specific CD4+ T cells (B) and S535-specific CD8+ T cells (C) in BALB/c mice. Cell numbers of airway-derived antigen-specific T cells are shown (n = 3 or 4 mice per group per time point; left). Viral titers in the lungs were measured at the indicated time points (n = 4 mice per group per time point; middle; data are representative of at least two independent experiments; Student’st tests; P values of B are 0.0051 and 0.0403; P values of C are 0.0026 and 0.0804). Sections of paraffin-embedded lungs from infected mice at 4 d.p.i. were stained with hematoxylin/eosin (n = 3 mice per group per time point; right; data are representative of at least two independent experiments). Scale bar, 100 mm. (D) Effects of S538-specific CD8+ T cells in C57BL/6 mice. Cell numbers at indicated time points are shown (n = 3 mice per group per time point; left). Viral titers in the lungs were measured at the indicated time points (n = 4 mice per group per time point; middle; data are representative of at least two independent experiments; Student’st tests; P values of D are 0.0372 and 0.0043). Sections of paraffin-embedded lungs from infected mice at 6 d after infection were stained with hematoxylin/eosin (n = 3 mice per group per time point; right; data are representative of at least two independent experiments). Scale bar, 100 mm. *, P < 0.05; **, P < 0.005. All results are expressed as mean ± SEM. Arrowheads, hemorrhage; asterisks, edema; Ag, antigen; D, day; FFU, focus-forming unit; p.i., post-infection.
Figure S5.
Figure S5.
No neutralizing antibodies in BALB/c mice at the time of challenge. Neutralizing antibodies titers in the sera of vaccinated and infected BALB/c mice at time of challenge and 14 d.p.i. (n = 6; data are representative of one experiment). All results are expressed as mean ± SEM. LOD, limit of detection; p.i., post-infection.
Figure 6.
Figure 6.
Cross-reactive T cell responses were found between SARS-CoV-2 and SARS-CoV in SARS-CoV-2–infected mice. (A) Characteristics of conserved T cell epitopes in SARS-CoV-2, SARS-CoV, and MERS-CoV. (B and C) BALB/c mice were transduced and infected with SARS-CoV-2. Lymphocytes derived from airway were prepared at 8 d.p.i. and stimulated with conversed epitopes. CD4+ (B) and CD8+ T cell responses (C) were detected by IFN-γ expression. Flow plots (left) and cross-reactivity rate (right) are shown (n = 3 or 4 mice per group; data are representative of two independent experiments). (D) Functional avidity curves (left) of S535-specific CD8+ T cells and S521–cross-reactive CD8+ T cells and the amount of peptide required for half-maximum response (EC50) are shown (right; n = 3 mice; data are representative of two independent experiments; Student’st tests; P value of D is 0.0182). *, P < 0.05. All results are expressed as mean ± SEM. Max, maximum; pep, peptide.

Similar articles

Cited by

References

    1. Braun, J., Loyal L., Frentsch M., Wendisch D., Georg P., Kurth F., Hippenstiel S., Dingeldey M., Kruse B., Fauchere F., et al. . 2020. SARS-CoV-2-reactive T cells in healthy donors and patients with COVID-19. Nature. 587:270–274. 10.1038/s41586-020-2598-9 - DOI - PubMed
    1. Brien, J.D., Uhrlaub J.L., and Nikolich-Zugich J.. 2008. West Nile virus-specific CD4 T cells exhibit direct antiviral cytokine secretion and cytotoxicity and are sufficient for antiviral protection. J. Immunol. 181:8568–8575. 10.4049/jimmunol.181.12.8568 - DOI - PMC - PubMed
    1. Brummelman, J., Pilipow K., and Lugli E.. 2018. The Single-Cell Phenotypic Identity of Human CD8+ and CD4+ T Cells. Int. Rev. Cell Mol. Biol. 341:63–124. 10.1016/bs.ircmb.2018.05.007 - DOI - PubMed
    1. Christensen, J.P., Doherty P.C., Branum K.C., and Riberdy J.M.. 2000. Profound protection against respiratory challenge with a lethal H7N7 influenza A virus by increasing the magnitude of CD8(+) T-cell memory. J. Virol. 74:11690–11696. 10.1128/JVI.74.24.11690-11696.2000 - DOI - PMC - PubMed
    1. Coler, R.N., Hudson T., Hughes S., Huang P.W., Beebe E.A., and Orr M.T.. 2015. Vaccination Produces CD4 T Cells with a Novel CD154-CD40-Dependent Cytolytic Mechanism. J. Immunol. 195:3190–3197. 10.4049/jimmunol.1501118 - DOI - PMC - PubMed

Publication types

MeSH terms