

HIF1α is a direct regulator of steroidogenesis in the adrenal gland
- PMID: 33464382
- PMCID: PMC8038963
- DOI: 10.1007/s00018-020-03750-1
HIF1α is a direct regulator of steroidogenesis in the adrenal gland
Abstract
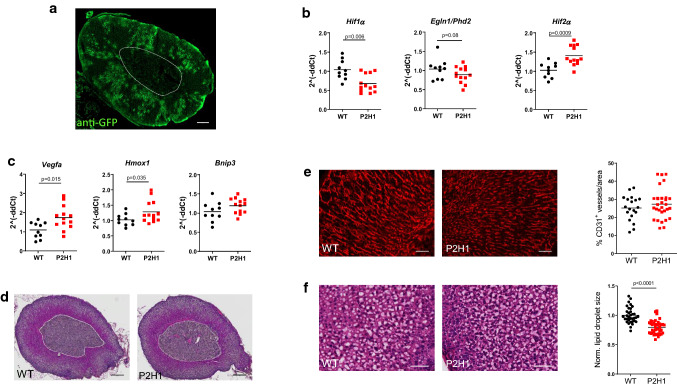
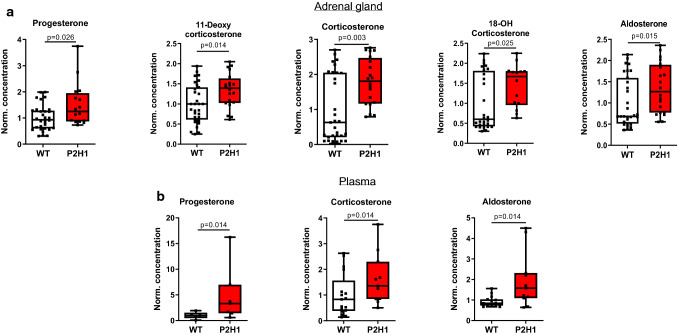
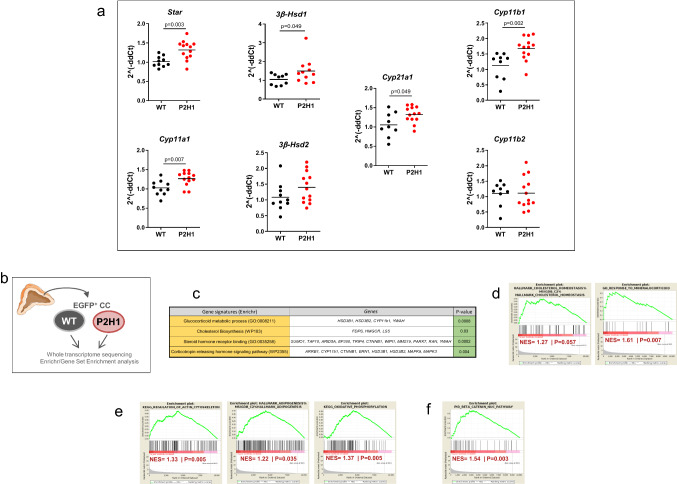
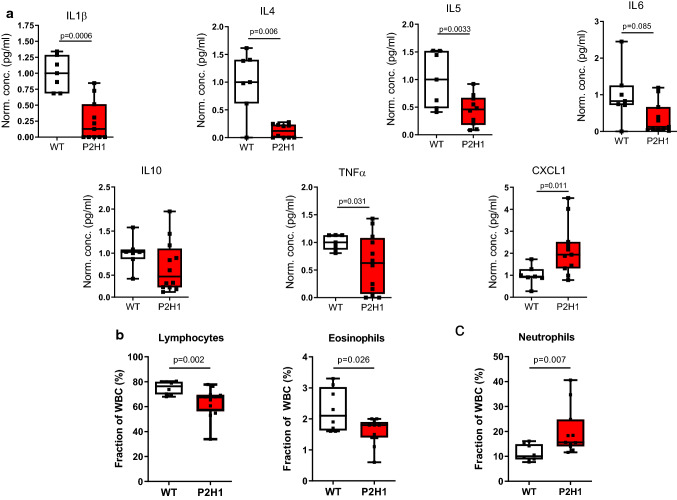
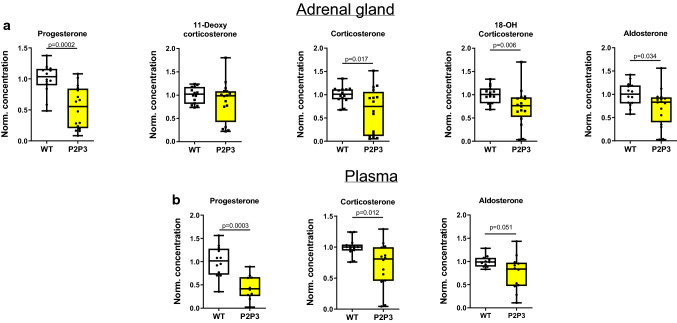
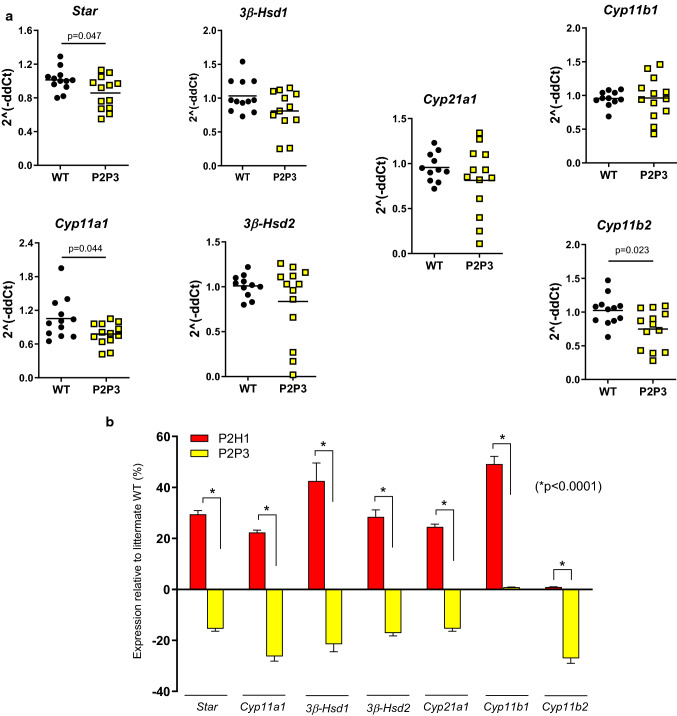
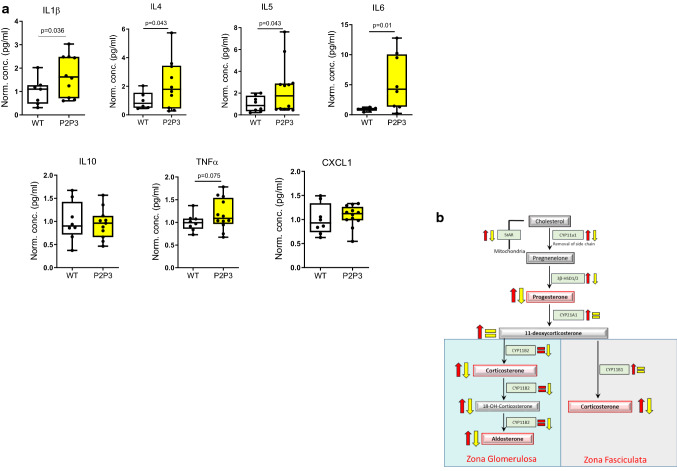
Endogenous steroid hormones, especially glucocorticoids and mineralocorticoids, derive from the adrenal cortex, and drastic or sustained changes in their circulatory levels affect multiple organ systems. Although hypoxia signaling in steroidogenesis has been suggested, knowledge on the true impact of the HIFs (Hypoxia-Inducible Factors) in the adrenocortical cells of vertebrates is scant. By creating a unique set of transgenic mouse lines, we reveal a prominent role for HIF1α in the synthesis of virtually all steroids in vivo. Specifically, mice deficient in HIF1α in adrenocortical cells displayed enhanced levels of enzymes responsible for steroidogenesis and a cognate increase in circulatory steroid levels. These changes resulted in cytokine alterations and changes in the profile of circulatory mature hematopoietic cells. Conversely, HIF1α overexpression resulted in the opposite phenotype of insufficient steroid production due to impaired transcription of necessary enzymes. Based on these results, we propose HIF1α to be a vital regulator of steroidogenesis as its modulation in adrenocortical cells dramatically impacts hormone synthesis with systemic consequences. In addition, these mice can have potential clinical significances as they may serve as essential tools to understand the pathophysiology of hormone modulations in a number of diseases associated with metabolic syndrome, auto-immunity or even cancer.
Keywords: Adrenocortical steroids; Cytokines; Hypoxia-inducible factor; Oxygen sensors.
Conflict of interest statement
The authors have declared that no conflict of interest exists.
Figures
Similar articles
-
HIF1α controls steroidogenesis under acute hypoxic stress.Cell Commun Signal. 2025 Feb 13;23(1):86. doi: 10.1186/s12964-025-02080-8. Cell Commun Signal. 2025. PMID: 39948619 Free PMC article.
-
Intertwined regulators: hypoxia pathway proteins, microRNAs, and phosphodiesterases in the control of steroidogenesis.Pflugers Arch. 2024 Sep;476(9):1383-1398. doi: 10.1007/s00424-024-02921-4. Epub 2024 Feb 15. Pflugers Arch. 2024. PMID: 38355819 Free PMC article. Review.
-
Hypoxia-inducible miR-182 enhances HIF1α signaling via targeting PHD2 and FIH1 in prostate cancer.Sci Rep. 2015 Jul 24;5:12495. doi: 10.1038/srep12495. Sci Rep. 2015. PMID: 26205124 Free PMC article.
-
Cigarette smoke extract (CSE) induces transient receptor potential ankyrin 1(TRPA1) expression via activation of HIF1αin A549 cells.Free Radic Biol Med. 2016 Oct;99:498-507. doi: 10.1016/j.freeradbiomed.2016.07.028. Epub 2016 Jul 29. Free Radic Biol Med. 2016. PMID: 27480844
-
Steroid biomarkers in human adrenal disease.J Steroid Biochem Mol Biol. 2019 Jun;190:273-280. doi: 10.1016/j.jsbmb.2019.01.018. Epub 2019 Jan 29. J Steroid Biochem Mol Biol. 2019. PMID: 30707926 Free PMC article. Review.
Cited by
-
Role of Exercise Intensity on Th1/Th2 Immune Modulations During the COVID-19 Pandemic.Front Immunol. 2021 Dec 22;12:761382. doi: 10.3389/fimmu.2021.761382. eCollection 2021. Front Immunol. 2021. PMID: 35003073 Free PMC article. Review.
-
Effect of melatonin on steroidogenesis-related enzymes expression and testosterone synthesis following CoCl2-induced hypoxia in TM3 Leydig cells.Iran J Basic Med Sci. 2023;26(9):1041-1046. doi: 10.22038/IJBMS.2023.69570.15152. Iran J Basic Med Sci. 2023. PMID: 37605723 Free PMC article.
-
HIF1α controls steroidogenesis under acute hypoxic stress.Cell Commun Signal. 2025 Feb 13;23(1):86. doi: 10.1186/s12964-025-02080-8. Cell Commun Signal. 2025. PMID: 39948619 Free PMC article.
-
Neuroadaptive Biochemical Mechanisms of Remote Ischemic Conditioning.Int J Mol Sci. 2023 Dec 1;24(23):17032. doi: 10.3390/ijms242317032. Int J Mol Sci. 2023. PMID: 38069355 Free PMC article. Review.
-
Intertwined regulators: hypoxia pathway proteins, microRNAs, and phosphodiesterases in the control of steroidogenesis.Pflugers Arch. 2024 Sep;476(9):1383-1398. doi: 10.1007/s00424-024-02921-4. Epub 2024 Feb 15. Pflugers Arch. 2024. PMID: 38355819 Free PMC article. Review.
References
MeSH terms
Substances
Grants and funding
LinkOut - more resources
Full Text Sources
Other Literature Sources
Molecular Biology Databases
