Comparative Study
. 2021 Aug;149(1-2):213-231.
doi: 10.1007/s11120-020-00814-y. Epub 2021 Jan 19.

Evidence for variable chlorophyll fluorescence of photosystem I in vivo

Affiliations
Comparative Study

Evidence for variable chlorophyll fluorescence of photosystem I in vivo

Ulrich Schreiber et al. Photosynth Res. 2021 Aug.

Abstract

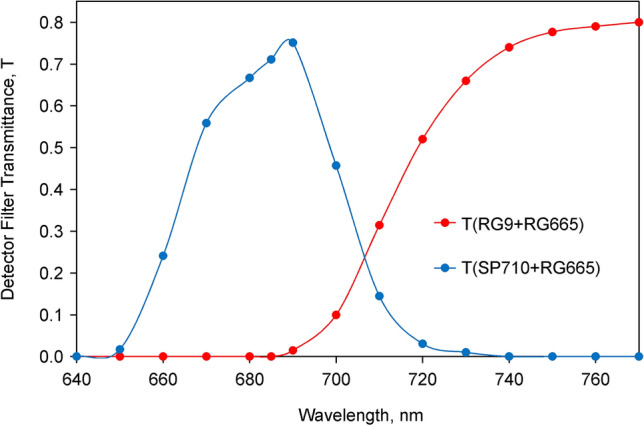
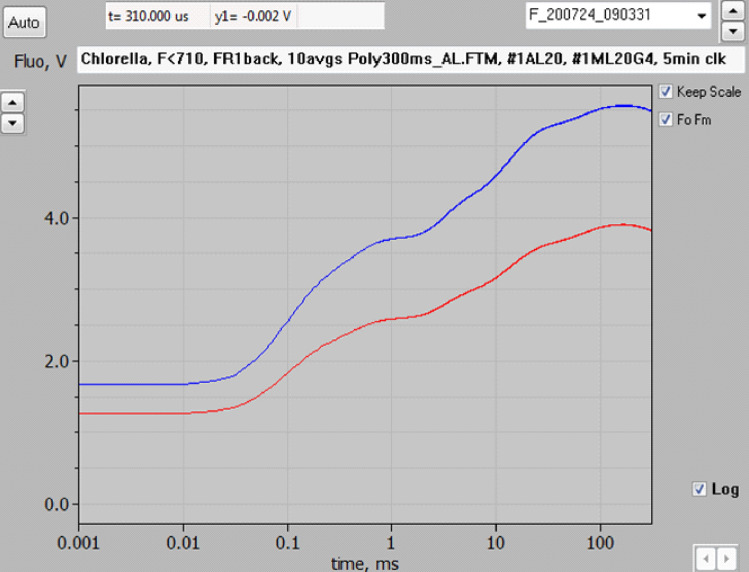
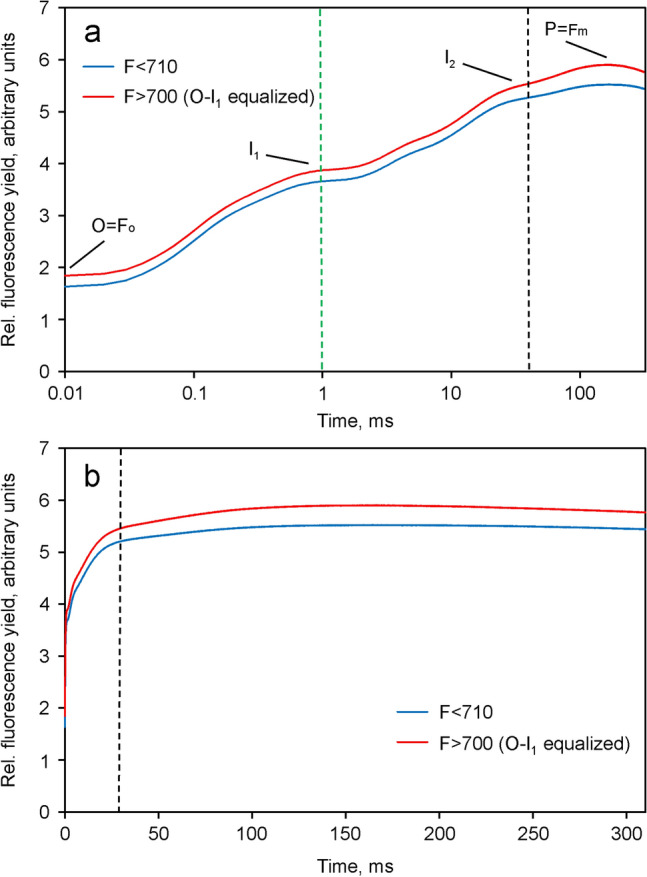
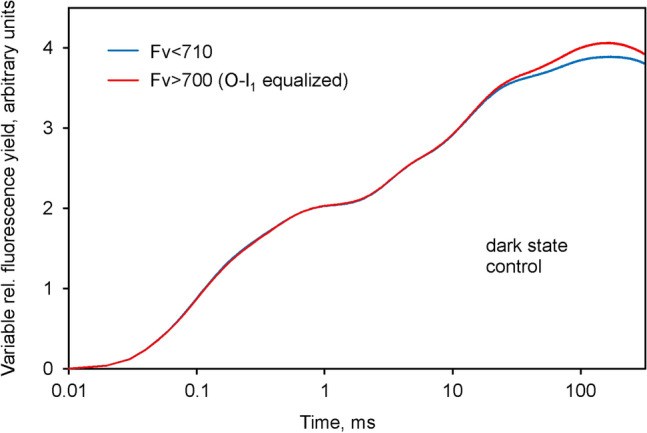
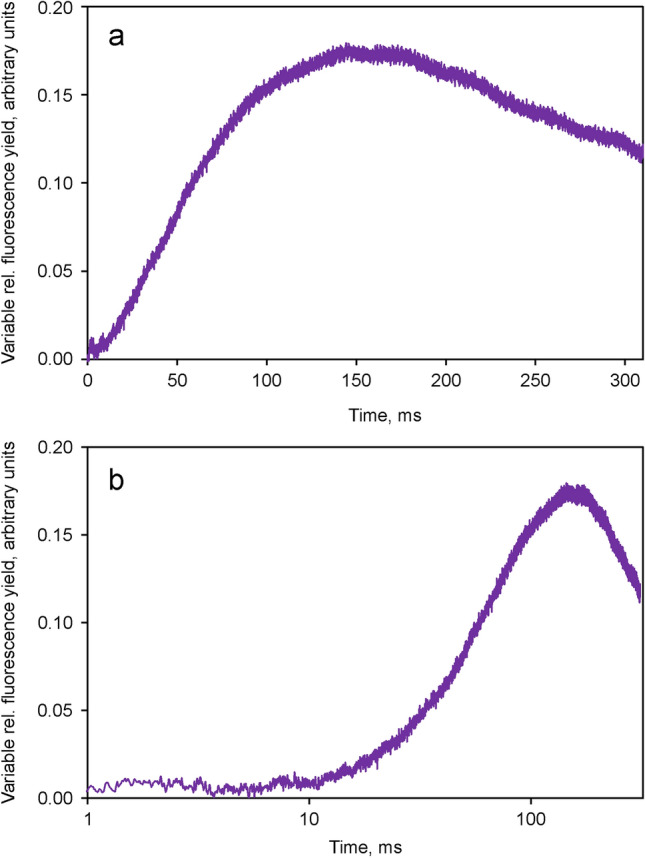
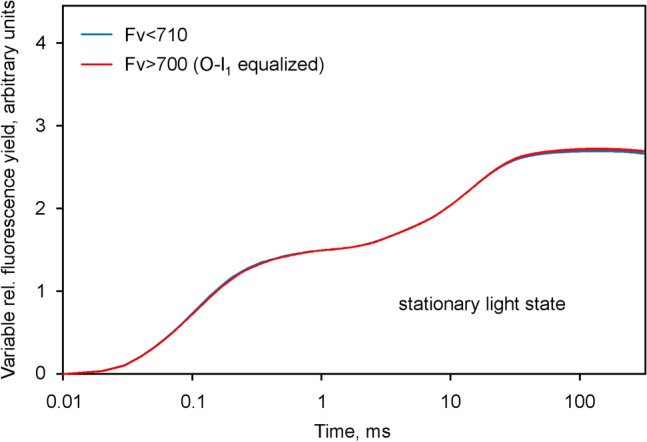
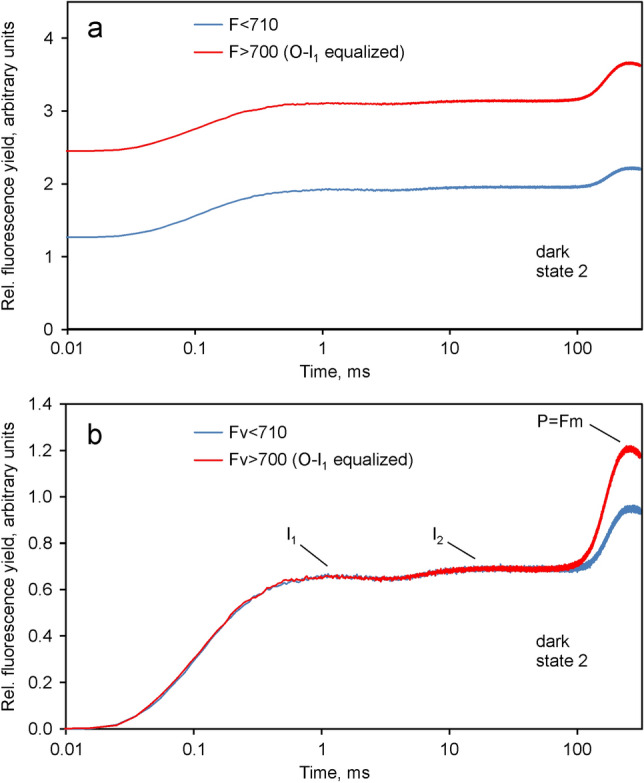
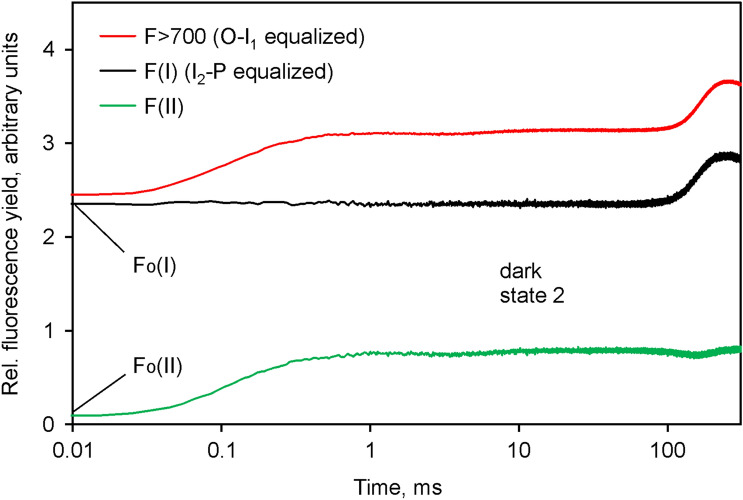
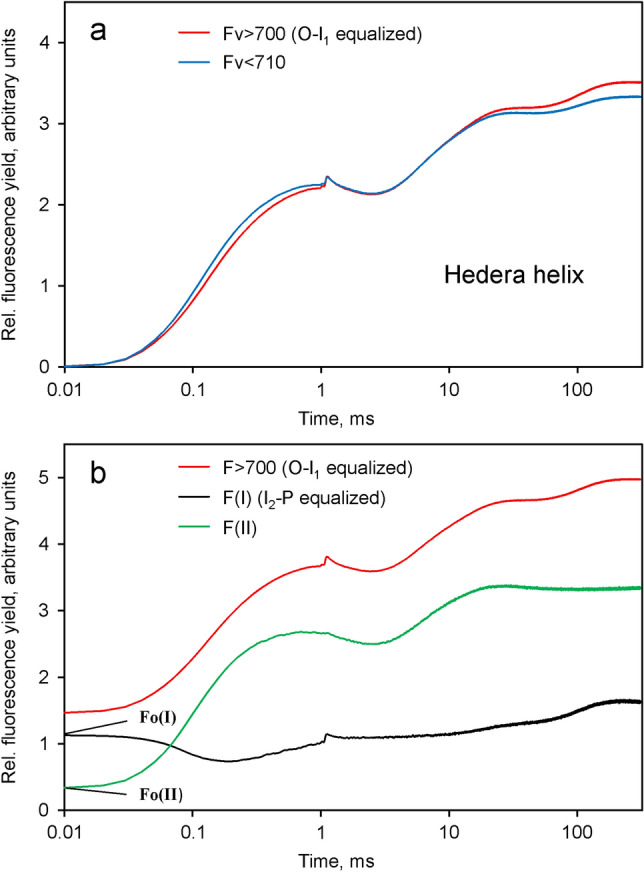
Room temperature fluorescence in vivo and its light-induced changes are dominated by chlorophyll a fluorescence excited in photosystem II, F(II), peaking around 685 nm. Photosystem I fluorescence, F(I), peaking around 730 nm, so far has been assumed to be constant in vivo. Here, we present evidence for significant contributions of F(I) to variable fluorescence in the green unicellular alga Chlorella vulgaris, the cyanobacterium Synechococcus leopoliensis and a light-green ivy leaf. A Multi-Color-PAM fluorometer was applied for measurements of the polyphasic fluorescence rise (O-I1-I2-P) induced by strong 440 nm light in a dilute suspension of Chlorella, with detection alternating between emission above 700 nm (F > 700) and below 710 nm (F < 710). By averaging 10 curves each of the F > 700 and F < 710 recordings even small differences could be reliably evaluated. After equalizing the amplitudes of the O-I1 phase, which constitutes a specific F(II) response, the O-I1-I2 parts of the two recordings were close to identical, whereas the I2-P phase was larger in F > 700 than in F < 710 by a factor of 1.42. In analogous measurements with Synechococcus carried out in the dark state 2 using strong 625 nm actinic light, after O-I1 equalization the I2-P phase in F > 700 exceeded that in F < 710 even by a factor of 1.99. In measurements with Chlorella, the I2-P phase and with it the apparent variable fluorescence of PS I, Fv(I), were suppressed by moderate actinic background light and by the plastoquinone antagonist DBMIB. Analogous measurements with leaves are rendered problematic by unavoidable light intensity gradients and the resulting heterogenic origins of F > 700 and F < 710. However, a light-green young ivy leaf gave qualitatively similar results as those obtained with the suspensions, thus strongly suggesting the existence of Fv(I) also in leaves.

Keywords: Chlorella; F > 700 nm; MULTI-COLOR-PAM; Polyphasic fluorescence rise O-I 1-I 2-P; Room temperature fluorescence emission; Synechococcus leopoliensis.


Conflict of interest statement

On behalf of both authors, the corresponding author states that there is no conflict of interest.

Figures

Fig. 1
Fig. 1
Transmittance spectra of detector filter sets used for measuring F > 700 (1 mm RG9 plus 2 mm low-fluorescent RG665) and F < 710 (short pass 710 nm plus 2 mm low-fluorescent RG665)
Fig. 2
Fig. 2
Comparison of the polyphasic fluorescence rise curves in Chlorella measured with the Multi-Color-PAM fluorometer at F > 700 (red) and F < 710 (blue). 440 nm pulse-modulated measuring light and 440 nm actinic light (4018 µmol m−2 s−1). 200 µg Chl l−1. 10 averages each of F > 700 and F < 710 curves that were measured alternatingly with 5 min intervals. Weak far-red background light (1 µmol m−2 s−1 730 nm quanta, applied for inducing standard reference conditions with respect to the states of PS II donor and acceptor sides and for the sake of long term reproducibility. Screenshot of original recordings in PamWin-3 Fast Kinetics window
Fig. 3
Fig. 3
Comparison of the F > 700 (red) and F < 710 (blue) signals after rescaling of the F > 700 response to give the same amplitude of the O-I1 phase as in the F < 710 response. Derived from the original data presented in Fig. 2. Application of 4018 µmol m−2 s−1440 nm quanta. The I1 plateau is reached at 1 ms (green vertical broken line). The black vertical broken line is placed at 40 ms to mark the beginning of the I2-P phase. The characteristic fluorescence levels O = Fo, I1, I2 and P = Fm are indicated using the original nomenclature of Schreiber (1986). a Logarithmic time scale. b Linear time scale
Fig. 4
Fig. 4
Comparison of the O-I1 equalized Fv > 700 and Fv < 710 curves. Derived from the data in Fig. 3 by subtraction of the respective Fo values
Fig. 5
Fig. 5
Kinetics of variable PS I fluorescence, Fv(I), derived from the difference between the O-I1 equalized Fv > 700 and Fv < 710 curves shown in Fig. 4. Ordinate scaling as in Fig. 3. Panel a, linear time scale. Panel b, logarithmic time scale
Fig. 6
Fig. 6
Comparison of the O-I1 equalized Fv > 700 and Fv < 710 curves derived from polyphasic fluorescence rise curves measured in the stationary state of illumination with 96 µmol m−2 s−1 440 nm quanta. Except for background illumination, identical conditions as in the experiment of Fig. 4, carried out with the same sample. 10 averages each for F > 700 and F < 710 recordings. Scaling identical to that in Fig. 4. Application of 4018 µmol m−2 s−1440 nm quanta
Fig. 7
Fig. 7
Comparison of the O-I1 equalized Fv > 700 and Fv < 710 curves derived from polyphasic fluorescence rise curves measured in the presence of 1 µM DBMIB. Otherwise identical conditions as in the experiment of Fig. 4, carried out with the same sample as for the measurements of Figs.4 and 6. The measurements in the presence of DBMIB were started 2 h after termination of continuous illumination in the presence of weak far-red background light. Scaling identical to that in Figs. 4 and 6. Application of 4018 µmol m−2 s−1 440 nm quanta
Fig. 8
Fig. 8
Deconvolution of the O-I1 equalized F > 700 response (red) into the F(I) (black) and F(II) (green) components in Chlorella. Rescaling of F(I) by I2-P equalization, carried out under the assumption of I2-P being caused exclusively by Fv(I). F(II) (green) derived by subtraction of I2-P equalized F(I) (black) from O-I1 equalized F > 700 (red). The amplitudes of Fo(I) and Fo(II) contributions are indicated
Fig. 9
Fig. 9
Quantification of Fv(I) in Synechococcus leopoliensis in the dark pigment state 2 based on parallel recordings of the polyphasic fluorescence rise curves induced upon onset of strong actinic light measured at > 700 nm and < 710 nm. Excitation: pulse modulated 440 nm ML. Actinic illumination: 4229 m−2 s−1 625 nm quanta plus 891 µmol m−2 s−1440 nm quanta (due to the pulse-modulated ML at hight pulse repetition rate). Each trace is the average of 4 recordings, with F > 700 and F < 710 measured alternatingly every 5 min. a Comparison of the F > 700 (red) and F < 710 (blue) signals after rescaling of the F > 700 response to give the same amplitude of the O-I1 phase as the F < 710 response. b Comparison of the O-I1 equalized Fv > 700 and Fv < 710 responses. The characteristic fluorescence levels are indicated
Fig. 10
Fig. 10
Deconvolution of the O-I1 equalized F > 700 response (red) into the F(I) (black) and F(II) (green) components in Synechococcus leopoliensis in the dark state 2 state. Rescaling of F(I) carried out under the assumption of I2-P being caused exclusively by Fv(I). F(II) (green) derived by subtraction of I2-P equalized F(I) (black) from O-I1 equalized F > 700 (red). The amplitudes of Fo(I) and Fo(II) contributions are indicated
Fig. 11
Fig. 11
Comparison of the light induced changes of F > 700 (red) and F < 710 (blue) measured from the surface of a light-green young ivy leaf. Application of a saturating single turnover flash at 1 ms to induce maximal QA reduction. Rescaling of the F > 700 response to give the same amplitude of the O-I1 phase as in the F < 710 response. Intensity of incident light: 7800 µmol m−2 s−1440 nm quanta. a Comparison of the O-I1 equalized variable fluorescence yields. b Tentative deconvolution of the F(I) (black) and F(II) (green) contributions to the overall Fv > 700 response (red), formally following the same procedure as applied in Figs. 8 and 10 for Chlorella and Synechococcus leopoliensis, respectively

References

    1. Badger MR, Schreiber U. Effects of inorganic carbon accumulation on photosynthetic oxygen reduction and cyclic flow in the cyanobacterium Synechococcus PCC7942. Photosynth Res. 1993;37:177–191. doi: 10.1007/BF00032822. - DOI - PubMed
    1. Bonaventura C, Myers J. Fluorescence and oxygen evolution from Chlorella pyrenoidosa. Biochim Biophys Acta. 1969;189:366–383. doi: 10.1016/0005-2728(69)90168-6. - DOI - PubMed
    1. Briantais J-M, Vernotte C, Krause GH, Weis E. Chlorophyll a fluorescence of higher plants: chloroplasts and leaves. In: Govindjee G, Amesz J, Fork DJ, editors. Light emission by plants and bacteria. New York: Academic Press; 1986. pp. 539–583.
    1. Byrdin M, Rimke I, Schlodder E, Stehlik D, Roelofs TA. Decay kinetics and quantum yields of fluorescence in photosystem I from Synechococcus elongatus with P700 in the reduced and oxidized state:are the kinetics of excited state decay trap-limited or transfer-limited? Biophys J. 2000;79:992–1007. doi: 10.1016/S0006-3495(00)76353-3. - DOI - PMC - PubMed
    1. Campbell D, Hurry V, Clarke A, Gustafsson P, Öquist G. Chlorophyll fluorescence analysis of cyanobacterial photosynthesis and acclimation. Microbiol Mol Biol Rev. 1998;62:667–683. doi: 10.1128/MMBR.62.3.667-683.1998. - DOI - PMC - PubMed

Publication types

MeSH terms

Substances

Supplementary concepts

LinkOut - more resources