. 2021;97(5):664-674.
doi: 10.1080/09553002.2021.1876950. Epub 2021 Mar 15.

Noninvasive assessment of radiation-induced renal injury in mice

Affiliations

Noninvasive assessment of radiation-induced renal injury in mice

Anis Ahmad et al. Int J Radiat Biol. 2021.

Abstract

Purpose: The kidney is a radiosensitive late-responding normal tissue. Injury is characterized by radiation nephropathy and decline of glomerular filtration rate (GFR). The current study aimed to compare two rapid and cost-effective methodologies of assessing GFR against more conventional biomarker measurements.

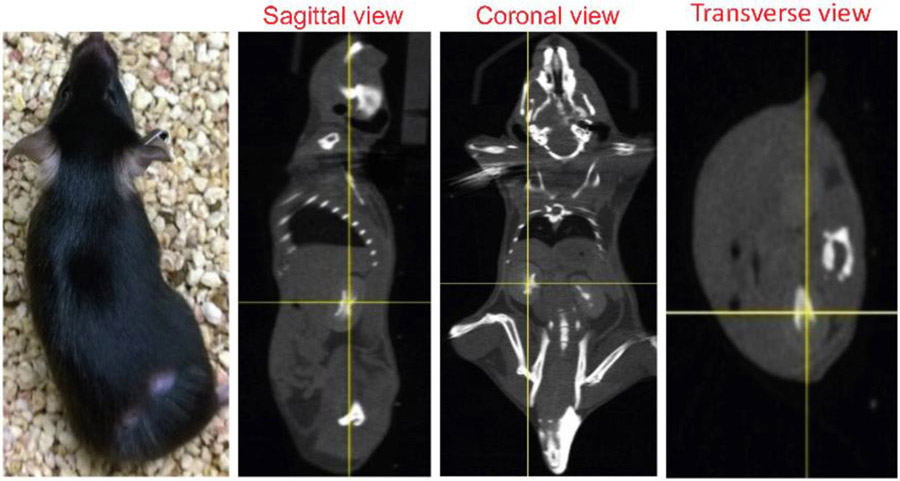
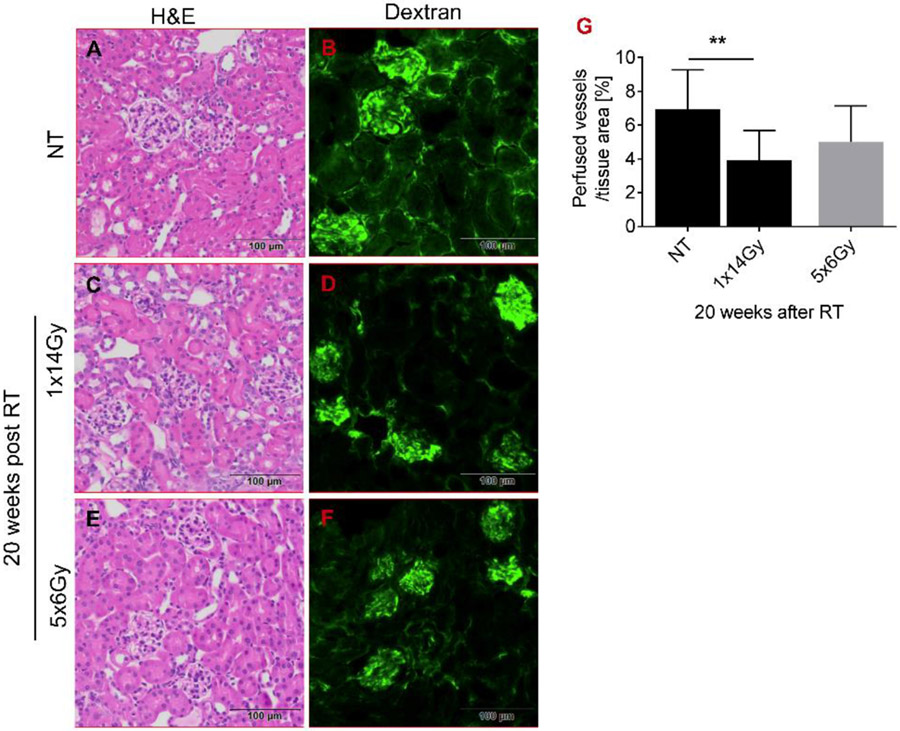
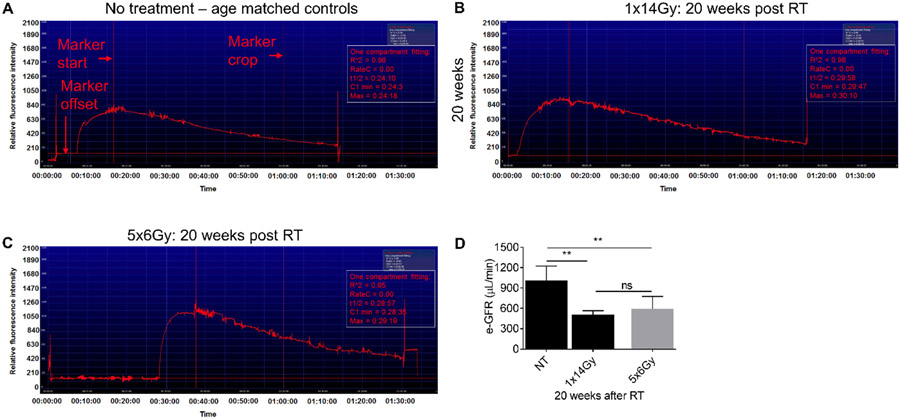
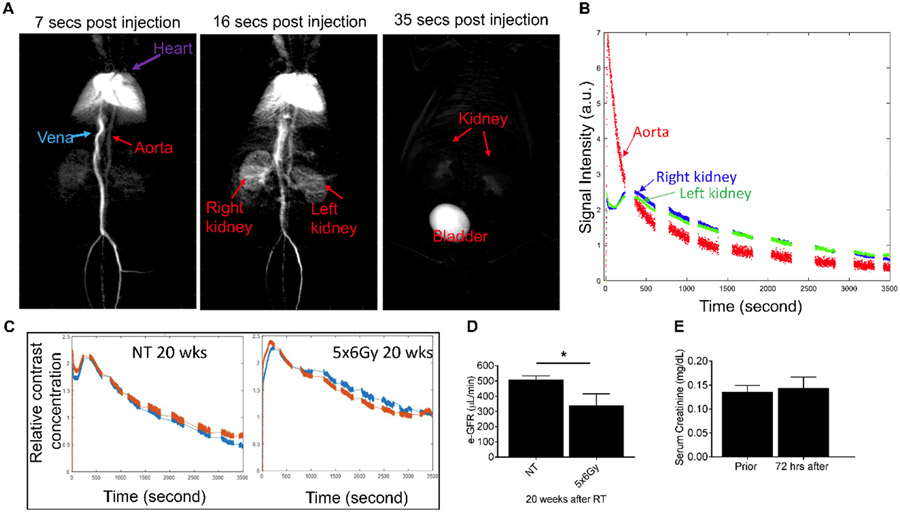
Methods: C57BL/6 mice were treated with bilateral focal X-irradiation (1x14Gy or 5x6Gy). Functional measurements of kidney injury were assessed 20 weeks post-treatment. GFR was estimated using a transcutaneous measurement of fluorescein-isothiocyanate conjugated (FITC)-sinistrin renal excretion and also dynamic contrast-enhanced CT imaging with a contrast agent (ISOVUE-300 Iopamidol).

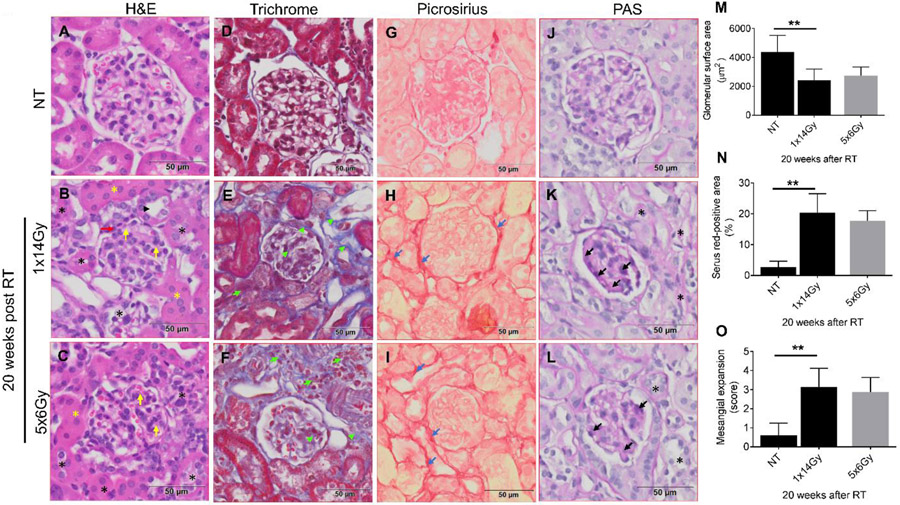
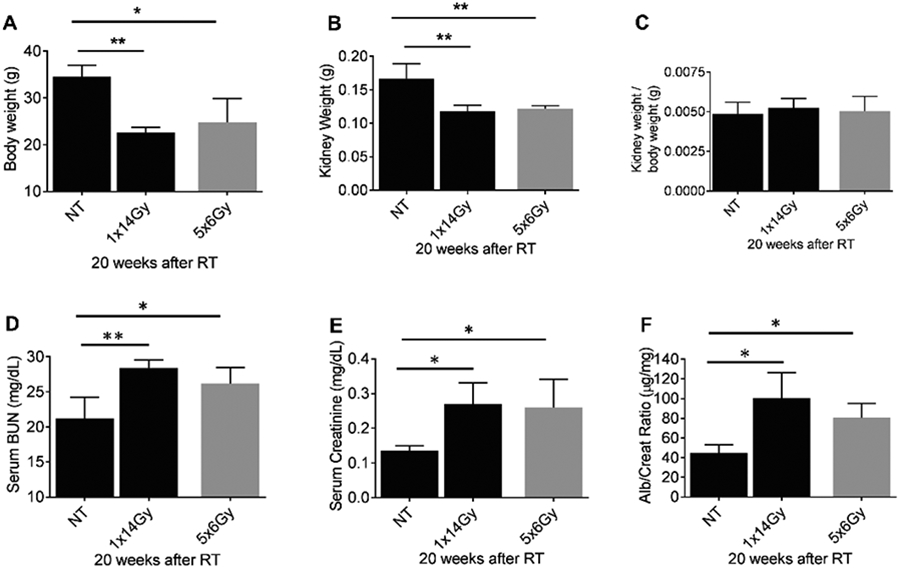
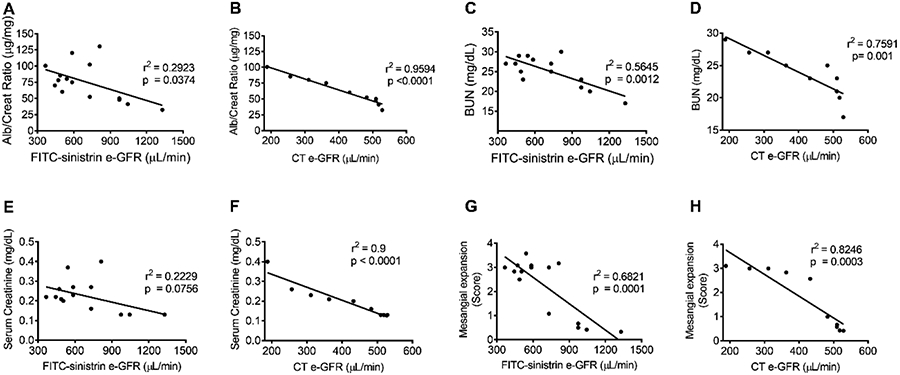
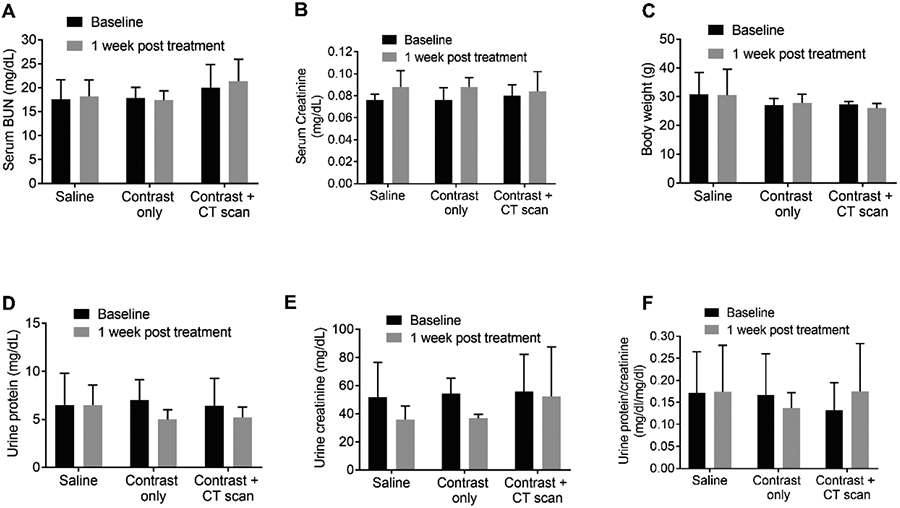
Results: Hematoxylin and eosin (H&E) and Periodic acid-Schiff staining identified comparable radiation-induced glomerular atrophy and mesangial matrix accumulation after both radiation schedules, respectively, although the fractionated regimen resulted in less diffuse tubulointerstitial fibrosis. Albumin-to-creatinine ratios (ACR) increased after irradiation (1x14Gy: 100.4 ± 12.2 µg/mg; 6x5Gy: 80.4 ± 3.02 µg/mg) and were double that of nontreated controls (44.9 ± 3.64 µg/mg). GFR defined by both techniques was negatively correlated with BUN, mesangial expansion score, and serum creatinine. The FITC-sinistrin transcutaneous method was more rapid and can be used to assess GFR in conscious animals, dynamic contrast-enhanced CT imaging technique was equally safe and effective.

Conclusion: This study demonstrated that GFR measured by dynamic contrast-enhanced CT imaging is safe and effective compared to transcutaneous methodology to estimate kidney function.

Keywords: Radiobiology; irradiation; mouse; renal damage.


Conflict of interest statement

Conflicts of Interest: Alessia Fornoni is consultant for Hoffman-La Roche, Alexion, and Mesoblast on subject matters that are unrelated to this publication. The authors declare no conflict of interest.

Figures

Figure 1.
Figure 1.. Representative three orthogonal x-ray CT views of an anesthetized mouse 5 minutes post intravenous ISOVUE-300 Iopamidol (150 μL) injection.
The yellow crosshair indicates the kidney center, which was subsequently aligned to the system isocenter for irradiation.
Figure 2.
Figure 2.. Representative photomicrographs of nontreated (NT) and irradiated 10-14 weeks old C57BL/6 mice at 20 weeks post-radiation (RT).
Paraffin-embedded sections, 5 μm thick, were stained with H&E, Masson trichrome, Picrosirius Red, Periodic Acid-Schiff (PAS). (A-C) Show degeneration of the renal tubules (black asterisks). Intact tubules are marked with (black arrowhead). H&E sections with diffuse tubular dilatation (yellow asterisks). (M) Quantification of the glomerular surface area. (D-F) Masson's trichrome staining section shows the blue-appearing collagen particularly evident in radiated specimens (green arrowhead). Interstitial fibrosis (green arrow). (G-I) Representative photomicrographs of picrosirius red-stained kidney sections show increased collagen deposits (dark red color shown by the blue arrow) in radiated mice. (N) Sirius-red positive area indicates the ratio of the mean picrosirius red-stained area to the whole mean area of the section. (J-L) shows the mesangial expansion in glomerulus after RT (black arrow). (O) shows the quantification of the mesangial expansion score from PAS staining. Values are mean ± SD. Scale bar = 50 μm. RT= radiation therapy, NT = No treatment.
Figure 3.
Figure 3.. Radiation changes the blood flow and vessel structure.
Five minutes before sacrifice, mice were injected intravenously with 200μl (1mg) of a FITC-labelled dextran/0.9% NaCl solution (2000 kDa). Frozen sections were fixed with 4% paraformaldehyde and images were captured using an Olympus VS120 fluorescence microscope. Analysis of renal perfusion showed that (A-B) non treated (NT) animals displayed a well-perfused honeycomb-like vascular network. This network was disturbed in radiated mice (C-F) and (G) the perfused vessel area was significantly reduced 20 weeks post-RT.
Figure 4.
Figure 4.. Assessment of kidney phenotypic parameters.
The kidneys of 10-14 weeks old C57BL/6 mice were radiated with 1x14 Gy using iSMAART/ or 5x6Gy by RAD Source RS 2000. (A) Bodyweight was measured before sacrifice. Then, mice were anesthetized using ketamine/xylazine and were perfused with cold PBS via left ventricle and kidneys harvested. (B) Both kidney weights were measured using the electronic weighing machine, and blood and (C) kidney weight and body weight ratio was calculated. Urine samples were collected 20 weeks after RT. Blood samples were analyzed for (D) serum BUN, and (E) serum creatinine (measured by tandem mass spectrometry). ELISA was used to determine (F) albumin-to-creatinine ratios (ACR) from urine samples 20 weeks post-RT.
Figure 5.
Figure 5.. Representative image of an elimination curve of FITC-sinistrin from untreated (NT) and irradiated C57BL/6 mice 20 weeks post-irradiation.
FITC-sinistrin stock solution was prepared in PBS (40 mg/ ml) and 0.15mg/g body weight FITC-sinistrin was administered via the tail vein. The signal generated by FITC-sinistrin is detected transcutaneously and stored in the internal memory of the recording device located on the animals back. When the recorded data are downloaded onto a PC, the software generates a curve comparable to the one presented in the image (A-C). Y-axis shows the recorded fluorescence intensity [AU], emitted by the injected FITC-sinistrin marker, while the X-axis represents the duration of the measurement in time [min]. (D) estimated GFR values from t1/2values.
Figure 6.
Figure 6.. Typical x-ray transmission projection kinetic curve of left and right kidneys after bolus injection of Iopamidol, for the untreated mouse or irradiated mouse 20 weeks after 5x6Gy irradiation.
The Iopamidol was infused at the speed of 1.38 mL/min with a Chemyx NanoJet syringe pump. The 2D x-ray projection was obtained using a PerkinElmer flat-panel detector with a temporal resolution of 0.5 s. Single exponential fitting was carried out during the 1000s~3000s period to calculate the excretion half time (t1/2). (A) shows clearance of CT contrast at different time points (B) Clearance curve of CT contrast from the aorta, left and right kidney from a non-treated (NT) mice (C) relative CT contrast clearance in NT and irradiated mice 20 weeks post-RT (D) graph showing estimated GFR values and (E) graph showing the change in serum creatinine levels 72hr post CT imaging.
Figure 7.
Figure 7.. Correlation of measures of kidney function/damage parameters (albumin/creatinine ratio (ACR), blood urea nitrogen (BUN), serum creatinine and histological evaluation of mesangial expansion score) with e-GFR:
10-14 weeks old C57BL/6 mice were irradiated with either single dose of 14Gy or 5x6Gy and sacrificed 20 weeks post-RT. All function/damage parameters showed a strong positive correlation with e-GFR measured by CT imaging technique (B, D, F and H). Whereas, all four functional/damage parameters showed a positive but weaker correlation with e-GFR measured by FITC-sinistrin clearance technique (A, C, E and G).
Figure 8.
Figure 8.
Evaluation of CT contrast-induced nephrotoxicity. 30 week old male and female C57BL/6 mice were injected either 150 μL of the diluted contrast agent Iopamidol (1:1 dilution with ultra-pure normal saline), or ultra-pure saline solution intravenously only, via lateral tail injection to perform the CT scan. Urine and blood were collected at baseline and 1 week after treatment to measure (A) serum BUN, (B) serum creatine, (C) body weight, (D) urine protein mg/dL, (E) urine creatinine (mg/dL) (F) urine protein to creatinine ration = 5 in each group; groups were compared by two-way ANOVA using graph prism pad software.

Similar articles

Cited by

References

    1. Abboud I, Peraldi MN, Hingorani S. 2012. Chronic kidney diseases in long-term survivors after allogeneic hematopoietic stem cell transplantation: monitoring and management guidelines. Semin Hematol. 49(1):73–82. - PubMed
    1. Abou Daher A, Francis M, Azzam P, Ahmad A, Eid AA, Fornoni A, Marples B, Zeidan YH. 2020. Modulation of radiation-induced damage of human glomerular endothelial cells by SMPDL3B. FASEB J. - PMC - PubMed
    1. Ahmad A, Mitrofanova A, Bielawski J, Yang Y, Marples B, Fornoni A, Zeidan YH. 2017. Sphingomyelinase-like phosphodiesterase 3b mediates radiation-induced damage of renal podocytes. FASEB J. 31(2):771–780. - PMC - PubMed
    1. Arveschoug AK, Kramer SM, Iversen P, Frokiaer J, Gronbaek H. 2015. Monitoring Kidney Function in Neuroendocrine Tumor Patients Treated with (90)Y-DOTATOC: Associations with Risk Factors. Curr Radiopharm. 8(1):49–55. - PubMed
    1. Brochner-Mortensen J 1985. Current status on assessment and measurement of glomerular filtration rate. Clin Physiol. 5(1):1–17. - PubMed

Publication types