. 2021 Nov;17(11):3444-3460.
doi: 10.1080/15548627.2021.1874209. Epub 2021 Jan 19.

Autophagy restricts mitochondrial DNA damage-induced release of ENDOG (endonuclease G) to regulate genome stability

Affiliations

Autophagy restricts mitochondrial DNA damage-induced release of ENDOG (endonuclease G) to regulate genome stability

Tung Chao et al. Autophagy. 2021 Nov.

Abstract

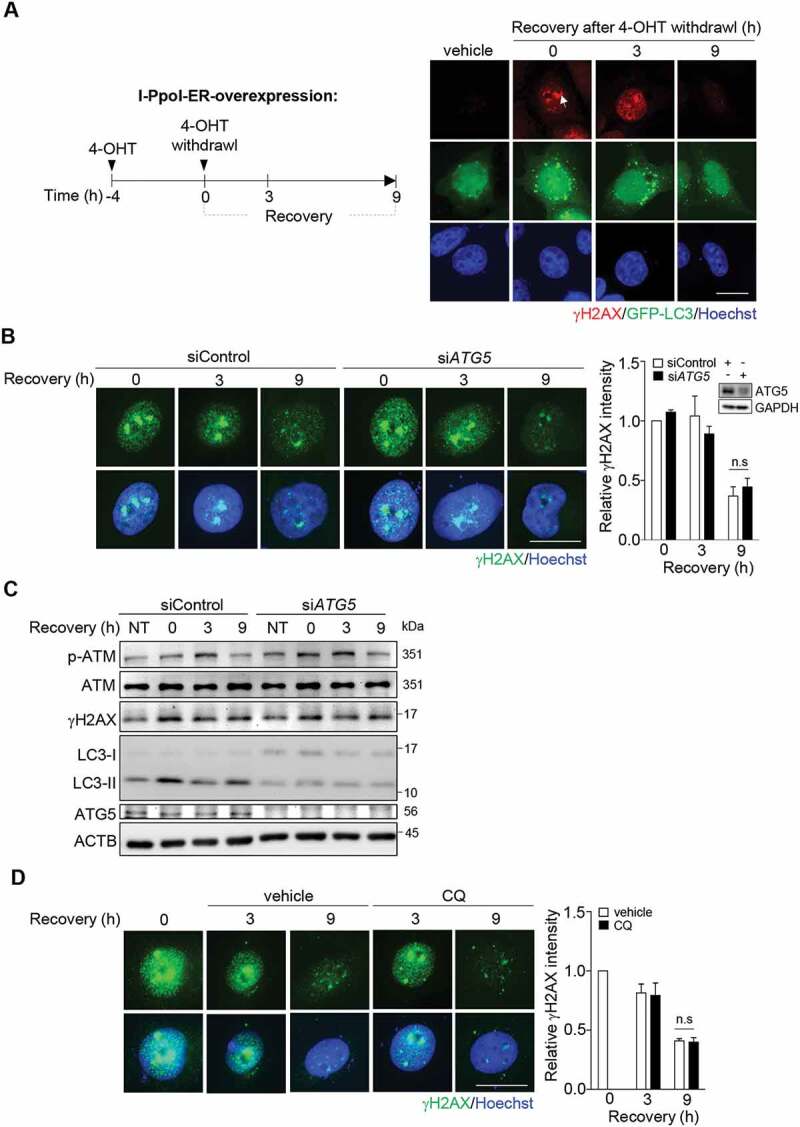
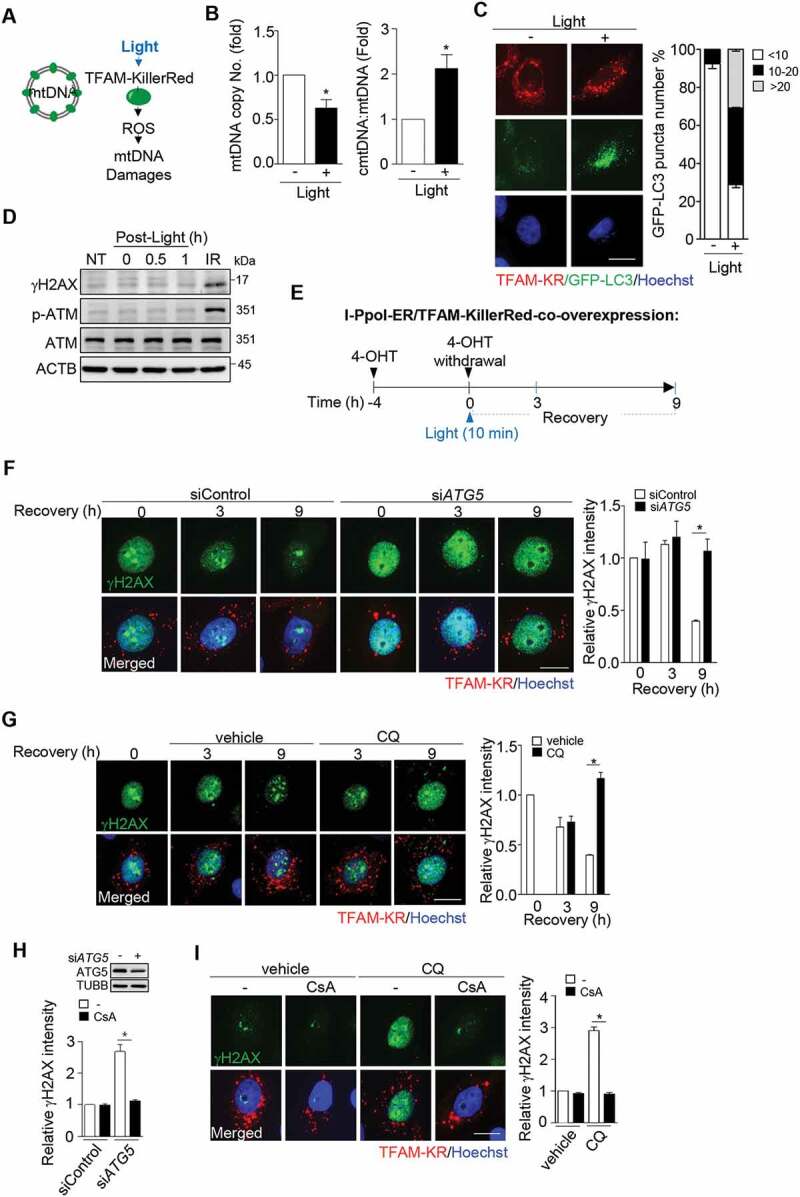
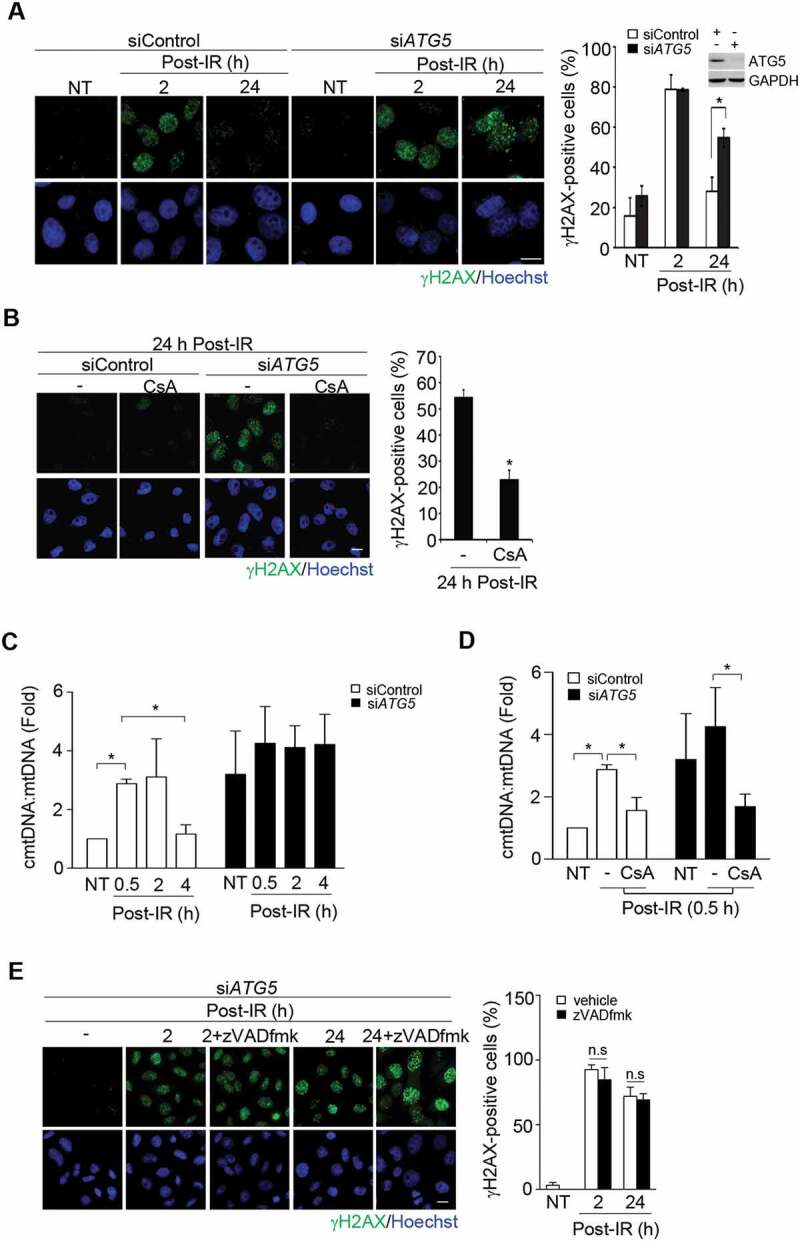
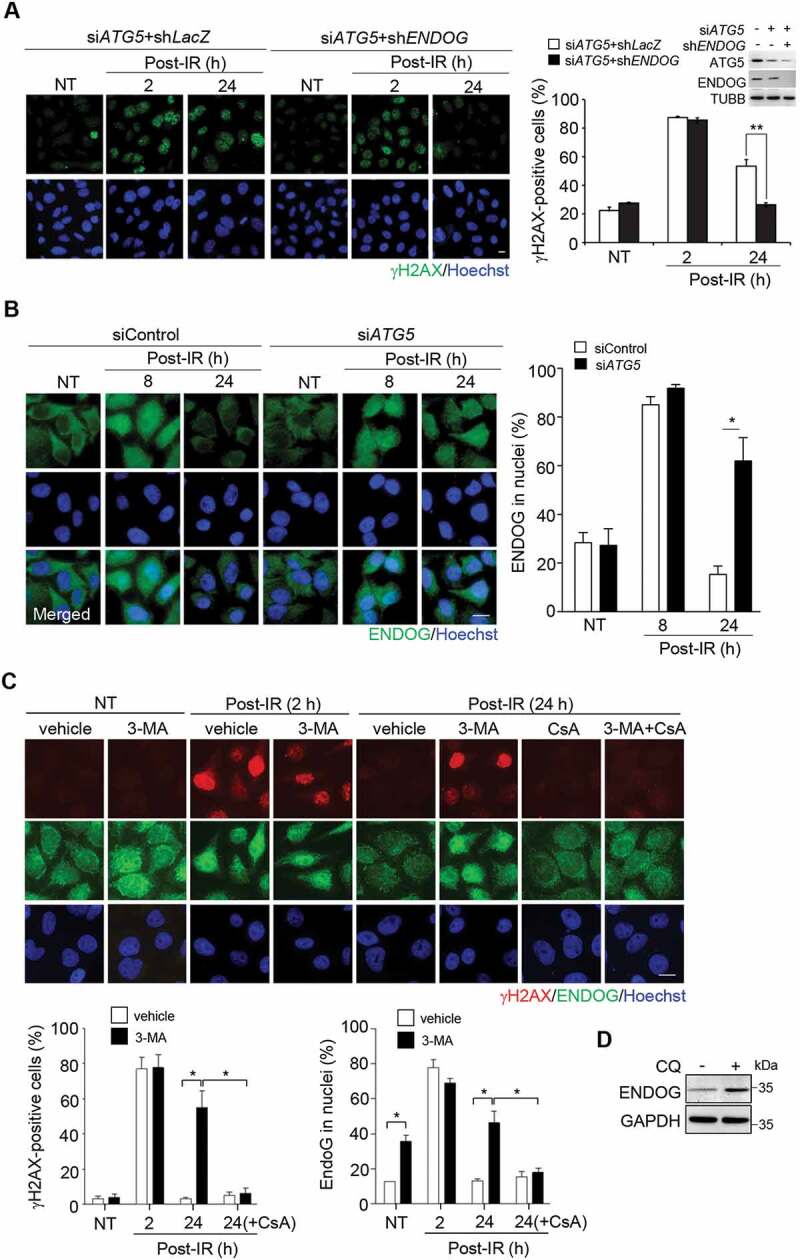
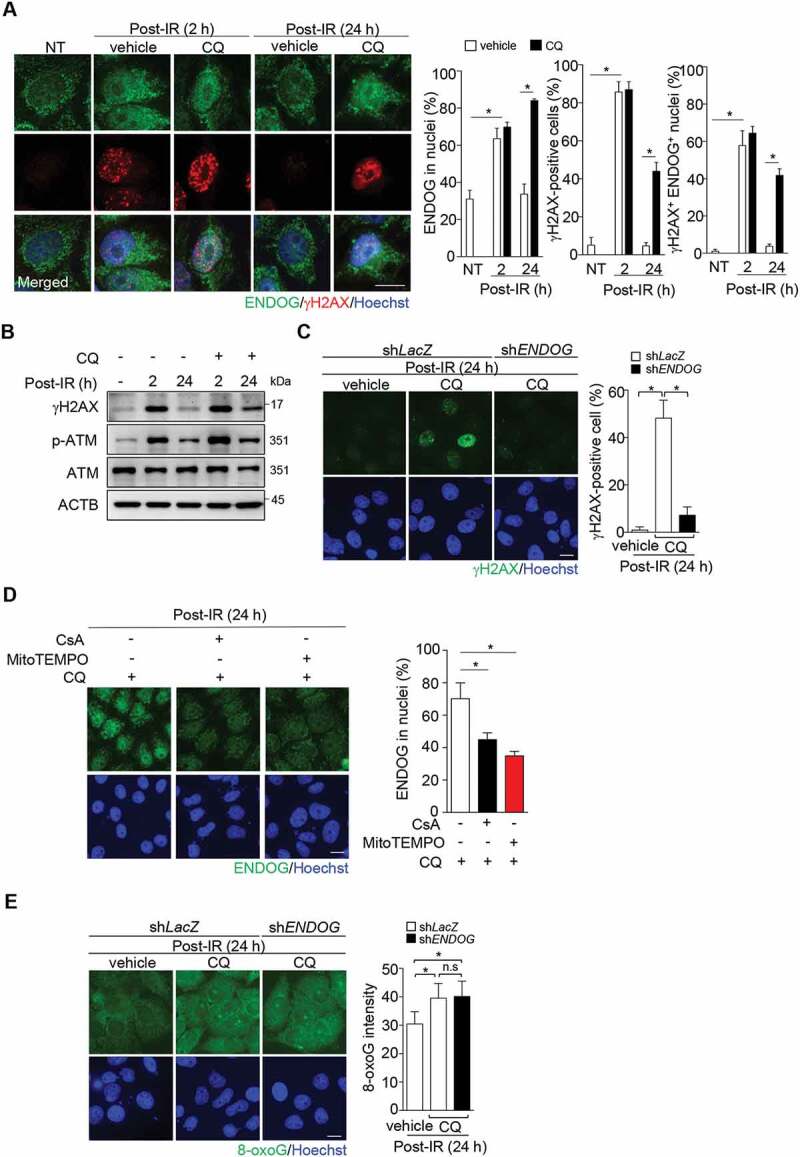
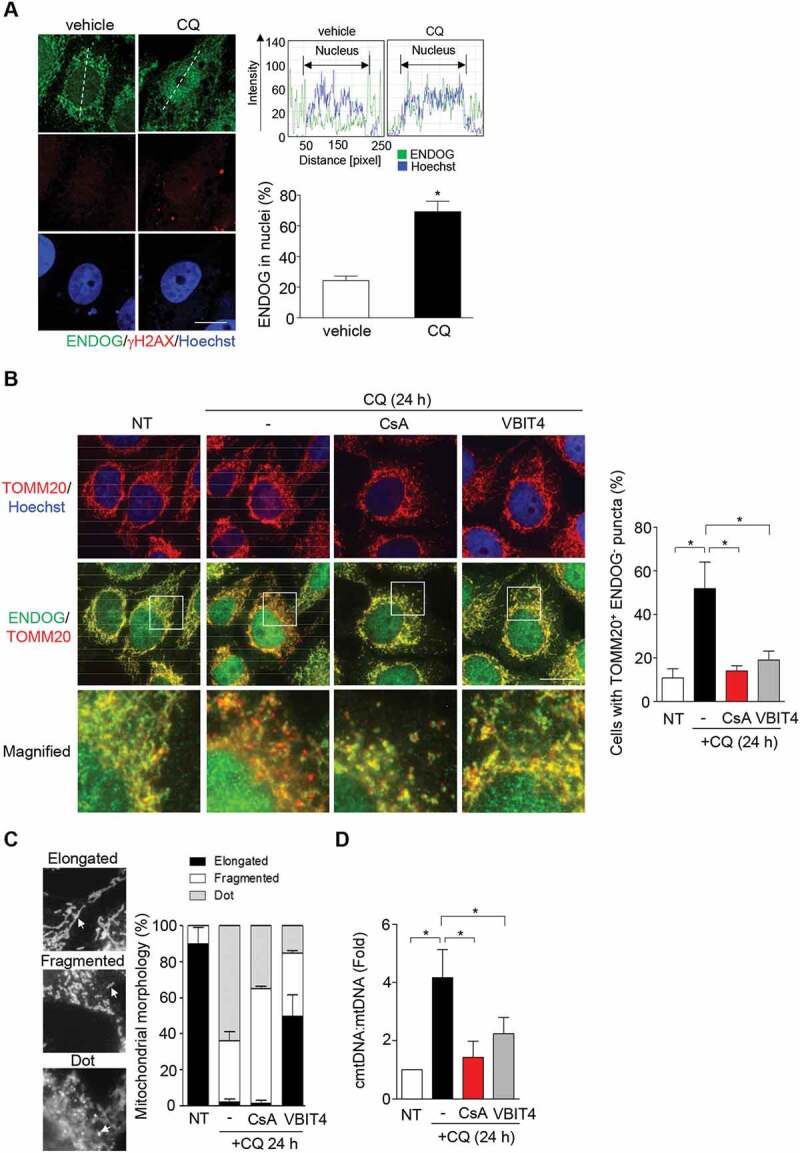
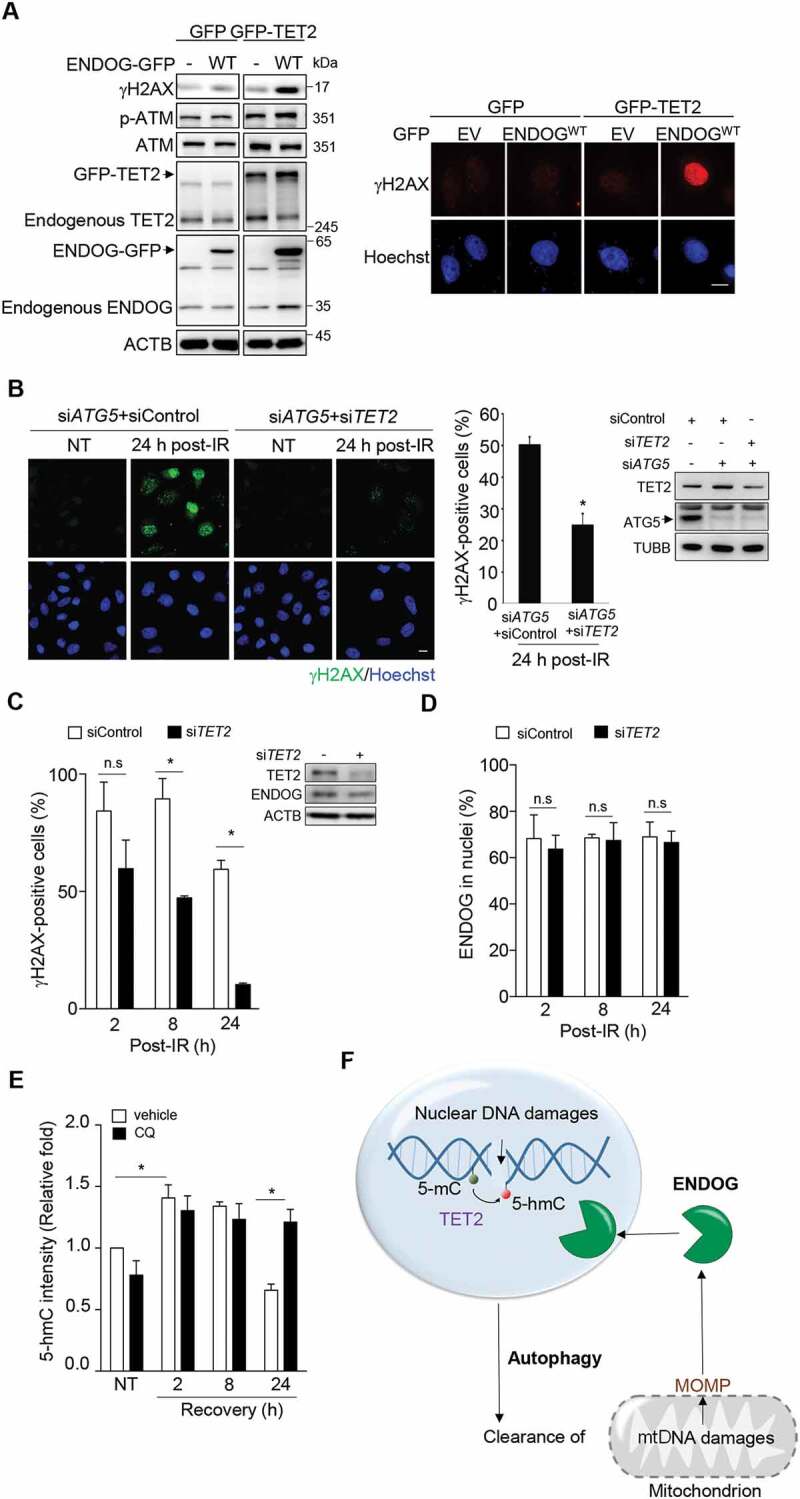
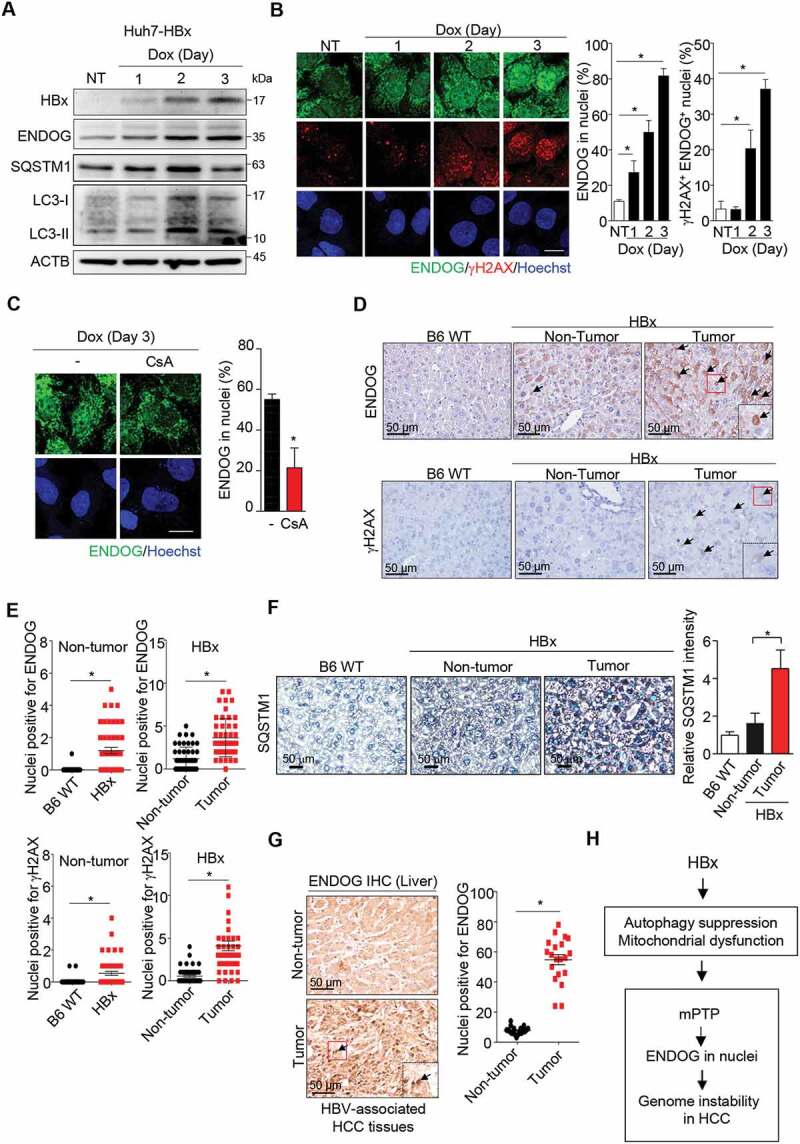
Genotoxic insult causes nuclear and mitochondrial DNA damages with macroautophagy/autophagy induction. The role of mitochondrial DNA (mtDNA) damage in the requirement of autophagy for nuclear DNA (nDNA) stability is unclear. Using site-specific DNA damage approaches, we show that specific nDNA damage alone does not require autophagy for repair unless in the presence of mtDNA damage. We provide evidence that after IR exposure-induced mtDNA and nDNA damages, autophagy suppression causes non-apoptotic mitochondrial permeability, by which mitochondrial ENDOG (endonuclease G) is released and translocated to nuclei to sustain nDNA damage in a TET (tet methylcytosine dioxygenase)-dependent manner. Furthermore, blocking lysosome function is sufficient to increase the amount of mtDNA leakage to the cytosol, accompanied by ENDOG-free mitochondrial puncta formation with concurrent ENDOG nuclear accumulation. We proposed that autophagy eliminates the mitochondria specified by mtDNA damage-driven mitochondrial permeability to prevent ENDOG-mediated genome instability. Finally, we showed that HBx, a hepatitis B viral protein capable of suppressing autophagy, also causes mitochondrial permeability-dependent ENDOG mis-localization in nuclei and is linked to hepatitis B virus (HBV)-mediated hepatocellular carcinoma development.Abbreviations: 3-MA: 3-methyladenine; 5-hmC: 5-hydroxymethylcytosine; ACTB: actin beta; ATG5: autophagy related 5; ATM: ATM serine/threonine kinase; DFFB/CAD: DNA fragmentation factor subunit beta; cmtDNA: cytosolic mitochondrial DNA; ConA: concanamycin A; CQ: chloroquine; CsA: cyclosporin A; Dox: doxycycline; DSB: double-strand break; ENDOG: endonuclease G; GFP: green fluorescent protein; Gy: gray; H2AX: H2A.X variant histone; HBV: hepatitis B virus; HBx: hepatitis B virus X protein; HCC: hepatocellular carcinoma; I-PpoI: intron-encoded endonuclease; IR: ionizing radiation; MAP1LC3/LC3: microtubule associated protein 1 light chain 3; MOMP: mitochondrial outer membrane permeability; mPTP: mitochondrial permeability transition pore; mtDNA: mitochondrial DNA; nDNA: nuclear DNA; 4-OHT: 4-hydroxytamoxifen; rDNA: ribosomal DNA; ROS: reactive oxygen species; SQSTM1/p62: sequestosome 1; TET: tet methylcytosine dioxygenase; TFAM: transcription factor A, mitochondrial; TOMM20: translocase of outer mitochondrial membrane 20; VDAC: voltage dependent anion channel.

Keywords: Autophagy; TET; endonuclease G; genome instability; mitochondrial DNA; mitochondrial permeability.


Conflict of interest statement

The authors declare that they have no conflict of interest.

Figures

Figure 1.
Figure 1.
DNA damage-induced autophagy is not necessarily essential for the repair of a moderate level of site-specific nDNA damage. (A) A schematic diagram for the induction of I-PpoI-induced rDNA damage and repair during recovery from 4-OHT withdrawal. Images of γH2AX IF staining and GFP-LC3 puncta in HeLa cells co-transfected with pLKO-HA-I-PpoI-ER and pGFP-LC3 after recovery from the 4-OHT (1 μM, 4 h) treatment at the indicated time points. scale bar: 20 μm. (B) Analysis of ATG5 knockdown on the repair of I-PpoI-induced DNA damage. representative images of γH2AX IF staining during recovery from 4-OHT-induced rDNA damage in cells with and without siATG5 RNA transfection, scale bar: 20 μm. right shows relative γH2AX IF staining intensity by ImageJ quantification (n ≥ 100). data are presented as mean ± SEM from three independent experiments (n.s: not significant). inset shows ATG5 knockdown by western blot. (C) Western blot analysis of γH2AX, p-ATM, LC3-I, LC3-II, and ACTB/β-actin in HeLa cells transfected with siControl or siATG5 RNA together with pLKO-HA-I-PpoI-ER after recovery from the 4-OHT (1 μM, 4 h) treatment at the indicated time points. (D) The effect of CQ treatment (50 μM) on the repair of I-PpoI-induced DNA damage. representative images of γH2AX IF staining during recovery from 4-OHT-induced rDNA damage in cells with CQ or vehicle treatment, scale bar: 20 μm. right shows relative γH2AX IF staining intensity by imageJ quantification (n ≥ 100). data are presented as mean ± SEM from three independent experiments (n.s: not significant)
Figure 2.
Figure 2.
mtDNA damage determines the effect of autophagy suppression on nDNA repair. (A) Light-induced mtDNA damage in TFAM-KillerRed expression cells. HeLa cells transfected with pTFAM-KillerRed (pTFAM-KR) were exposed to light for 10 min to induce site-specific ROS and mtDNA damage. (B) After recovery for 30 min from light exposure, cells were harvested for determination of the levels of cytosolic mtDNA (cmtDNA) and total mtDNA by qPCR. The primer set of MT-RNR2/16S was used for cmt- and total mtDNA. left shows mtDNA copy number normalized by genomic ACTB/β-actin. right shows the cmtDNA normalized to total mtDNA. All data are expressed relative to that in cells without light exposure and presented as mean ± SEM from three independent experiments (* P < 0.05). (C) representative images of cells transfected with pTFAM-KR and pGFP-LC3. cells with and without light exposure were observed by fluorescence microscope and quantitated for GFP-LC3 puncta in TFAM-KR positive cells (n ≥ 100). Data are presented as mean ± SEM from three independent experiments. Scale bar: 20 μm. (D) Western blot analysis of γH2AX and phospho-ATM in TFAM-KillerRed-overexpressing HeLa cells during recovery from the light exposure. Cells exposed to IR (5 Gy) were used as a positive control for the analysis of DNA damage signals. (E) Schematic diagram of I-PpoI-induced rDNA damage in the presence of light-mediated mtDNA damage. cells were co-transfected with pLKO-HA-I-PpoI-ER and pTFAM-KillerRed and treated with 4-OHT (1 μM) for 4 h. upon withdrawal from 4-OHT treatment, cells were exposed to light for 10 min and recovery for γH2AX evaluation. (F) Effect of ATG5 knockdown on I-PpoI-induced rDNA damage in the presence of light-induced mtDNA damage. representative images of γH2AX IF staining during withdrawal from 4-OHT-induced rDNA damage with light-induced mtDNA damage in cells with and without siATG5 RNA transfection, scale bar: 20 μm. right shows relative γH2AX IF staining intensity by imageJ quantification (n ≥ 100). Data are presented as mean ± SEM from three independent experiments (* P < 0.05). (G) Effect of CQ on I-PpoI-induced nDNA damage in the presence of mtDNA damage. cells were recovered from 4-OHT withdrawal and light exposure in the medium with/without CQ (50 μM). Images of TFAM-KillerRed and γH2AX IF staining of cells are shown, scale bar: 20 μm. right shows relative γH2AX IF intensity determined using ImageJ (n ≥ 100). Data are presented as mean ± SEM from three independent experiments (* P < 0.05). (H) Effect of CsA on nDNA damage. ATG5-knockdown cells were treated with cyclosporin A (CsA, 10 μM) during recovery from I-PpoI-induced rDNA damage with light-induced mtDNA damage. γH2AX IF intensity was quantified using ImageJ (n ≥ 100). Data are presented as mean ± SEM from three independent experiments (* P < 0.05). Inset shows ATG5 knockdown by western blot. (I) Effect of Cyclosporin A in CQ-treated cells. left shows representative images, scale bar: 20 μm. right shows relative γH2AX IF intensity by imageJ quantification (n ≥ 100). Data are presented as mean ± SEM from three independent experiments (* P < 0.05)
Figure 3.
Figure 3.
Non-apoptotic mitochondrial permeability controls the recovery of nDNA damage from IR. cells were exposed to IR (5 Gy) and recovered at the indicated time. (A) The requirement of autophagy for recovery from nDNA damage. Representative images of γH2AX IF staining. The bar graph shows the percentage of γH2AX foci positive cells (n ≥ 100). Data are presented as mean ± SEM from three independent experiments (* P < 0.05). Scale bar: 20 μm. inset shows ATG5 knockdown by western blot. (B) Mitochondrial permeability on nDNA damage. cells were recovered with or without cyclosporin A (CsA, 10 μM, for the last 4 h) for 24 h. left: γH2AX IF images, scale bar: 20 μm. right: the percentage of γH2AX foci positive cells in siATG5 cells with or without CsA treatment (n ≥ 100) from three independent experiments (mean ± SEM, * P < 0.05). (C) IR-induced mtDNA damage. Cells were harvested for cytosolic and total DNA extraction. The levels of cytosolic mtDNA (cmtDNA) and total mtDNA were measured by qPCR. The primer set of MT-RNR2/16S was used for cmt- and total mtDNA. The cmtDNA was normalized to total mtDNA in pellet, and was expressed relative to that in non-treated (NT) control. Data are presented as mean ± SEM from three independent experiments (* P < 0.05). (D) Quantification of cmtDNA released from mitochondria. Cells transfected with siControl and siATG5 RNA were non-treated (NT) or treated with IR exposure (5 Gy) with or without CsA (10 μM) pretreatment for 2 h for cytosolic mtDNA and total mtDNA determination. The cmtDNA was normalized to total mtDNA and was expressed relative to that in non-treated (NT) cells transfected with siControl. Data are presented as mean ± SEM from three independent experiments (* P < 0.05). (E) Non-apoptotic involvement. In siATG5 transfected cells, zVADfmk (50 μM), a pan-caspase inhibitor, was added to the medium after IR. The cells were fixed for γH2AX IF staining with Hoechst. left shows representative images. scale bar: 20 μm. right shows the percentage of γH2AX foci positive cells (n ≥ 100). Data are presented as mean ± SEM from three independent experiments (n.s: not significant)
Figure 4.
Figure 4.
ENDOG released from mitochondria sustains nDNA damage. (A) The role of ENDOG in nDNA damage. Cells infected with lentivirus of the shRNA of ENDOG for γH2AX IF staining at the time recovery from IR. Left: representative images of γH2AX IF staining, scale bar: 20 μm. Right: the percentage of γH2AX foci positive cells in cells with and without ENDOG knockdown (n ≥ 100) from three independent experiments (mean ± SEM, ** P < 0.01). Inset shows ATG5 and ENDOG knockdown by western blot. (B) nuclear localization of ENDOG. ENDOG IF staining before and after recovery from IR. Left: the representative images of ENDOG IF staining, scale bar: 20 μm. The percentage of cells (n ≥ 100 cells) with ENDOG in nuclei was quantitated and shown in the bar graph. Data are presented as mean ± SEM from three independent experiments (* P < 0.05). (C) Effect of 3-Methyladenine (3-MA) on IR (5 Gy)-induced nDNA damage. representative images of γH2AX and ENDOG IF staining during recovery from IR for 2 h or 24 h in cells with or without 3-MA treatment, or 3-MA coupled with CsA treatment, scale bar: 20 μm. The bar graphs show the percentage of γH2AX foci positive cells and the percentage of cells with ENDOG in nuclei, respectively in cells with or without 3-MA treatment (n ≥ 100) from three independent experiments (mean ± SEM, * P < 0.05). (D) Western blot of ENDOG in cells with or without CQ (50 μM) treatment for 24 h. GAPDH was used as internal control
Figure 5.
Figure 5.
Blocking lysosome function sustains nDNA damage via ENDOG. Cells recovered from IR exposure (5 Gy) were incubated with or without CQ (50 μM). (A) ENDOG localization and nDNA damage in the presence of CQ. representative images of ENDOG and γH2AX IF staining acquired by LSM700 confocal microscopy, scale bar: 20 μm. The bar graphs show the percentages of cells positive for ENDOG in nuclei, γH2AX, and ENDOG and γH2AX-double positive, respectively (n ≥ 100). Data are presented as mean ± SEM from three independent experiments (* P < 0.05). (B) Western blot analysis of γH2AX and phospho-ATM in cells during recovery with or without CQ treatment. β-actin was used as internal control. (C) The role of ENDOG in sustaining nDNA damage in the presence of CQ. Cells were transduced with lentiviral shRNA of ENDOG followed by IR exposure (5 Gy) and recovery for 24 h. Left: representative images of γH2AX IF staining, scale bar: 20 μm. right: the percentage of γH2AX foci positive cells with and without ENDOG knockdown (n ≥ 100) from three independent experiments (mean ± SEM, * P < 0.05). (D) The requirement of mitochondrial oxidative stress for ENDOG nuclear translocation. After IR (5 Gy), cells were treated with CQ for 24 h in combination with MitoTEMPO (20 μM). representative images of ENDOG IF staining, scale bar: 20 μm. The bar graphs show the percentages of cells with ENDOG in nuclei (n ≥ 100). Data are presented as mean ± SEM from three independent experiments (* P < 0.05). (E) The effect of ENDOG knockdown on oxidative stress. cells with and without ENDOG knockdown by shRNA were treated with CQ (50 μM) after recovery from IR for 8-oxoG IF staining. Left shows representative images. scale bar: 20 μm. right shows bar graph of the 8-oxoG intensity quantified by ImageJ (n ≥ 100) from three independent experiments. (* P < 0.05, n.s: not significant)
Figure 6.
Figure 6.
Chloroquine induces mtDNA release and ENDOG-free mitochondria puncta. (A) Nuclear localization of ENDOG by CQ treatment without DNA damage. Cells were fixed for ENDOG and γH2AX IF staining. Images were acquired using LSM700 confocal microscopy (Zeiss), scale bar: 20 μm. The nuclear localization of ENDOG was analyzed using ZEN software. The bar graphs show the percentage of cells with ENDOG positive in nuclei from three independent experiments (mean ± SEM, * P < 0.05). (B-D) CQ treatment increases mitochondrial puncta free of ENDOG and mtDNA release. Cell were treated with CQ for 20 h followed by CsA (10 μM) addition for another 4 h or with VBIT4 (10 μM) co-incubation for 24 h. (B) Cells were subjected to IF co-staining of ENDOG and TOMM20. Left shows the representative images with the magnified view in the white box of merged ENDOG/TOMM20 shown below. Right shows quantification of the percentage of cells with TOMM20 puncta lacking ENDOG. Data are presented as mean ± SEM from three independent experiments (* P < 0.05). (C) Representative images of different mitochondrial morphology (left) and the quantification of mitochondrial morphology (right). Data are presented as mean ± SEM from three independent experiments. (D) Quantification of cytosolic mtDNA (cmtDNA) levels. Data are presented as mean ± SEM from three independent experiments (* P < 0.05)
Figure 7.
Figure 7.
TET-mediated signal allows ENDOG-mediated nDNA cleavage. (A) Effect of TET2 and ENDOG overexpression on nDNA damage. Cells were transfected with GFP or TET2-GFP in combination with ENDOG-GFP plasmids. Left: western blot analysis of γH2AX, phospho-ATM, TET2, and ENDOG. right: representative IF images of γH2AX in cells. (B-E) cells were transfected with siRNA of control or TET2 for IR for γH2AX IF staining. (B) The requirement of TET2 for sustaining DNA damage in ATG5 knockdown cells. left: representative images, scale bar: 20 μm. Middle: the percentage of γH2AX foci positive cells (n ≥ 100) from three independent experiments (mean ± SEM, * P < 0.05). right: the western blot of ATG5 and TET2. (C-E) Effect of TET2 knockdown in CQ-treated cells. Cells recovered from IR were incubated with CQ (50 μM) and fixed for (C) γH2AX and (D) ENDOG IF staining. The bar graph shows the quantification of cells positive for γH2AX and ENDOG in nuclei, respectively. Cells (n ≥ 100) were analyzed (mean±SEM from three independent experiments,* P < 0.05). The western blotting shows the TET2 knockdown efficiency and ENDOG protein level. (E) Relative 5-hmC IF intensity of cells. Cells (n ≥ 100) were counted from three independent experiments (mean ± SEM,* P < 0.05). (F) A proposed model for the role of autophagy in DNA repair
Figure 8.
Figure 8.
The association of nuclear translocation of ENDOG with HBV-induced hepatocellular carcinoma. (A-C) HBx induces nuclear translocation of ENDOG. Huh7 cells harboring HBx under the control of the tet-on promoter were incubated with doxycycline (Dox, 1 μg/ml). (A) cells were harvested for western blot analysis using ENDOG and HBx antibodies. (B) IF staining of ENDOG and γH2AX. Left: representative images, scale bar: 20 μm. right: the percentage of cells with ENDOG in nuclei and cells with double-positive in nuclear ENDOG and γH2AX (n ≥ 100) from three independent experiments (mean ± SEM,* P < 0.05). (C) Effect of CsA on ENDOG in nuclei. At day 3 with dox treatment, cells were incubated with cyclosporin A (CsA, 10 μM) for 8 h for IF staining of ENDOG. left: representative images, scale bar: 20 μm. right: the percentage of cells positive for ENDOG in nuclei (n ≥ 100) from three independent experiments (mean ± SEM, * P < 0.05). (D,E) The correlation of nuclear ENDOG in HBx-induced HCC. IHC staining of ENDOG and γH2AX in liver tissues of B6 mice and non-tumor/tumor parts of liver tissues of HBx transgenic mice. The inset at the right bottom shows the enlarged image in the red box, scale bar: 50 μm. Graphs show nuclei positive in ENDOG and γH2AX signal from three independent tissue sections from three different pairs of mice (mean ± SEM, * P < 0.05). (F) The increase of SQSTM1 accumulation in HBx-induced HCC. IHC staining of SQSTM1 in liver tissues of B6 mice and non-tumor/tumor parts of liver tissues of HBx transgenic mice, scale bar: 50 μm. The bar graphs show the relative SQSTM1 intensity from three independent tissue sections from three different pairs of mice (mean ± SEM, * P < 0.05). (G) nuclear ENDOG in tumor of HBV-associated HCC patient. IHC staining of ENDOG in liver tissue sections from an HBV-associated HCC human patient. The inset at the right bottom shows the enlarged image in the red box, scale bar: 50 μm. nuclei positive in ENDOG signal were counted as mean ± SEM (* P < 0.05). (H) A schema of the HBx-mPTP-ENDOG pathway in promoting genome instability in HCC development

References

    1. Vessoni AT, Filippi-Chiela EC, Menck CF, et al. Autophagy and genomic integrity. Cell Death Differ. 2013;20(11):1444–54 . - PMC - PubMed
    1. Hewitt G, Korolchuk VI.. Repair, reuse, recycle: the expanding role of autophagy in genome maintenance. Trends Cell Biol. 2017;27(5):340–351. - PubMed
    1. Chen H, Wang J, Liu Z, et al. Mitochondrial DNA depletion causes decreased ROS production and resistance to apoptosis. Int J Mol Med. 2016;38(4):1039–46 . - PMC - PubMed
    1. Chandel NS, Schumacker PT.. Cells depleted of mitochondrial DNA (rho0) yield insight into physiological mechanisms. FEBS Lett. 1999;454(3):173–6. - PubMed
    1. Berkovich E, Monnat RJ Jr., Kastan MB. Roles of ATM and NBS1 in chromatin structure modulation and DNA double-strand break repair. Nat Cell Biol. 2007;9(6):683–90. - PubMed

Publication types

MeSH terms