. 2021 Mar 1;131(5):e140695.
doi: 10.1172/JCI140695.

Renal tubule Cpt1a overexpression protects from kidney fibrosis by restoring mitochondrial homeostasis

Affiliations

Renal tubule Cpt1a overexpression protects from kidney fibrosis by restoring mitochondrial homeostasis

Verónica Miguel et al. J Clin Invest. .

Abstract

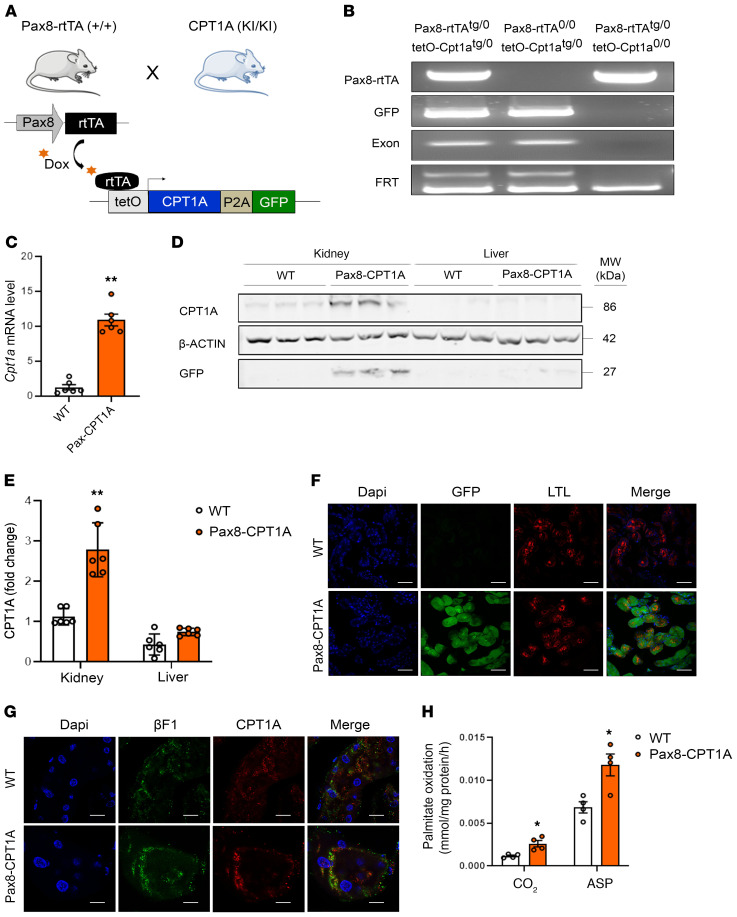
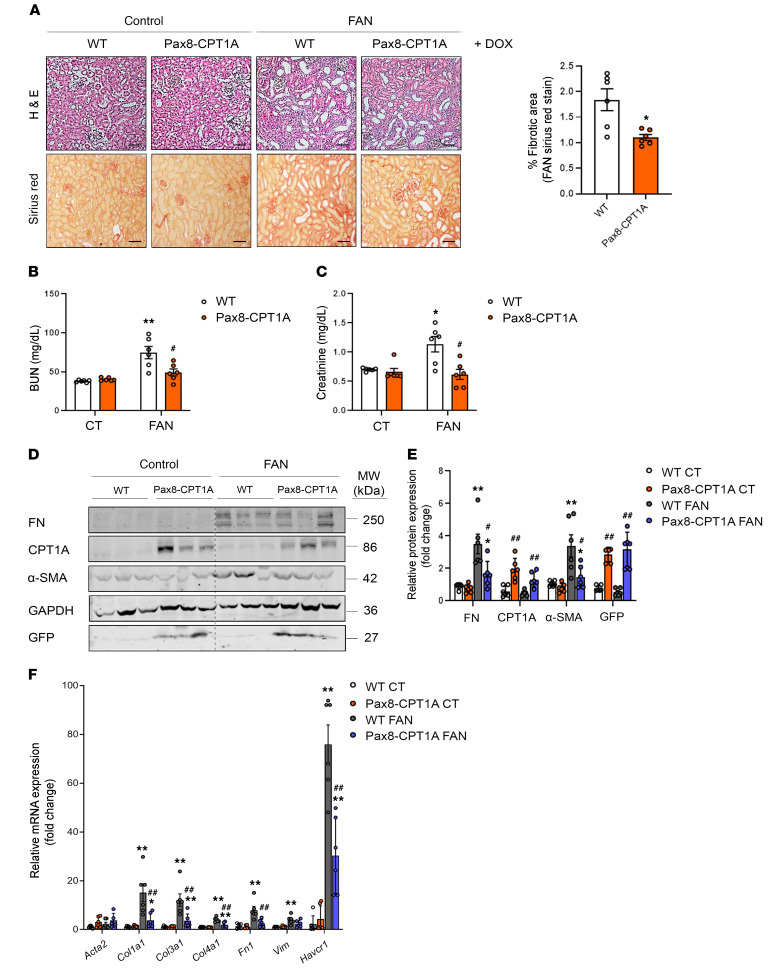
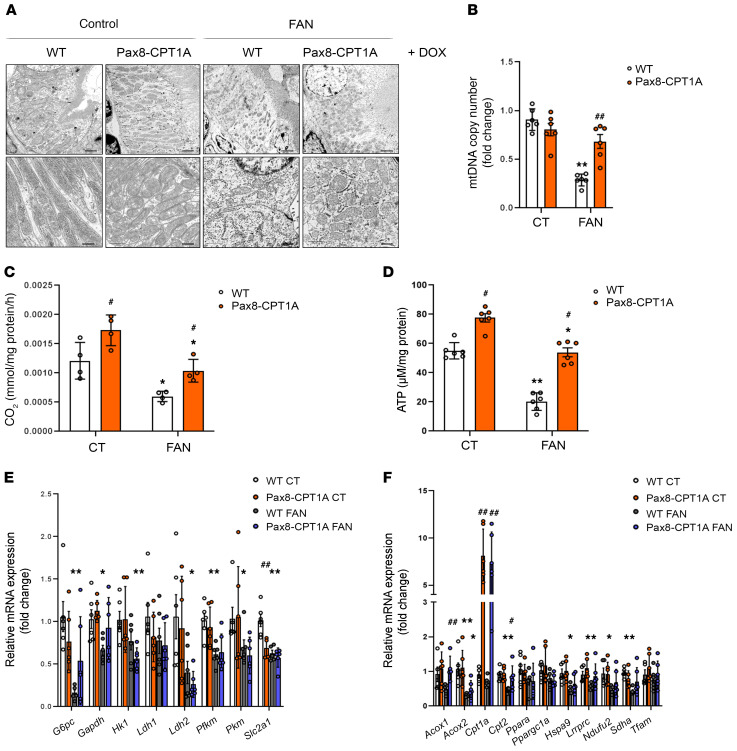
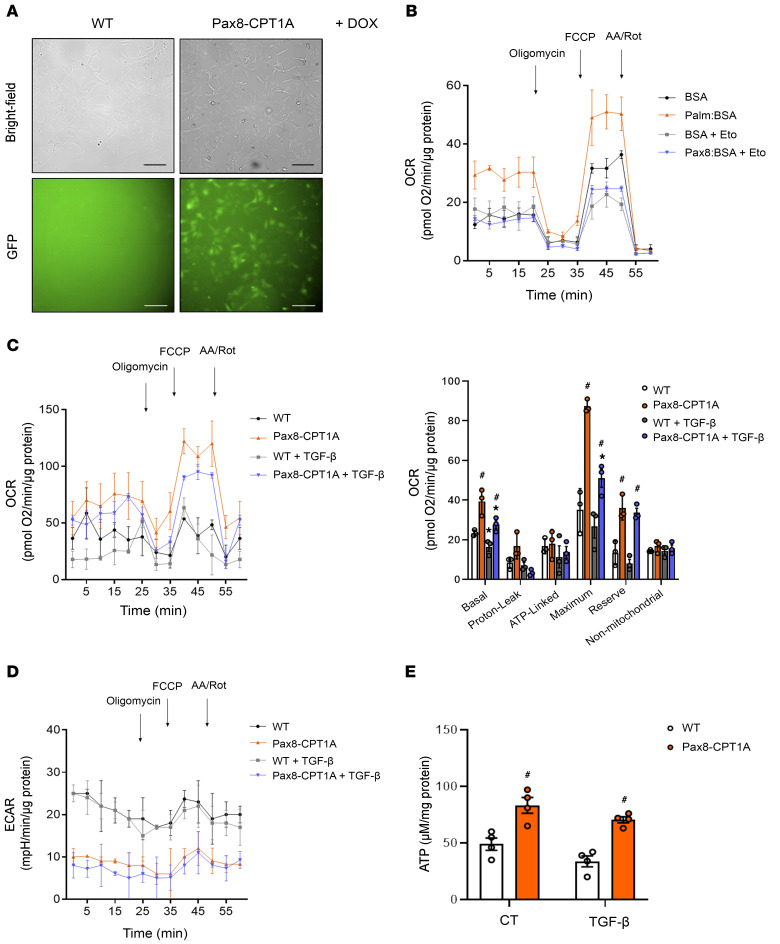
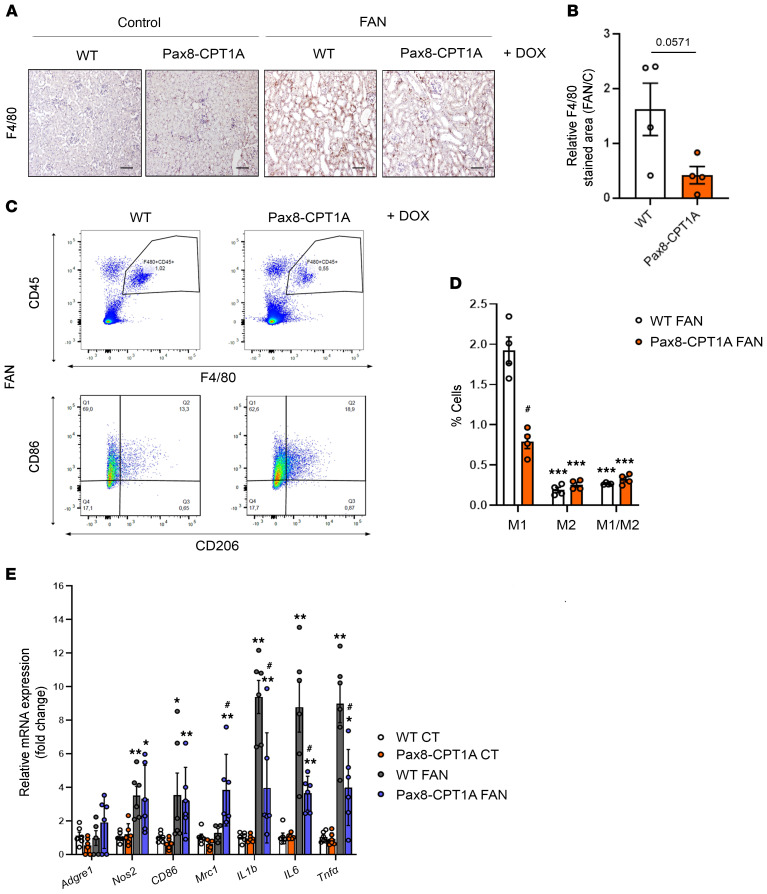
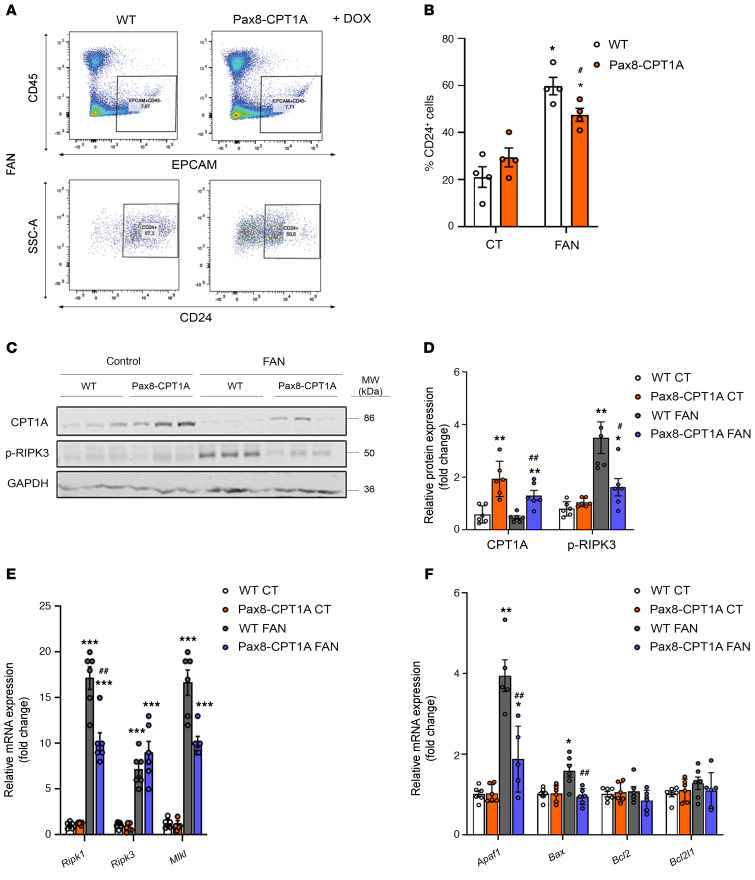
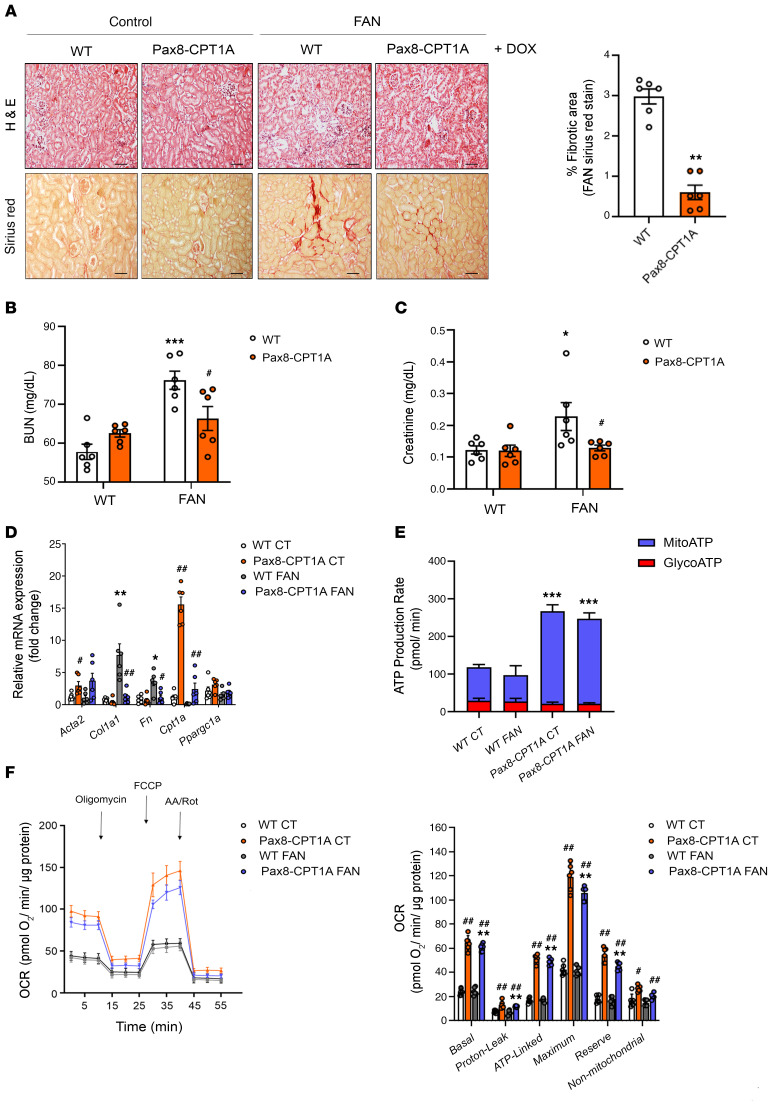
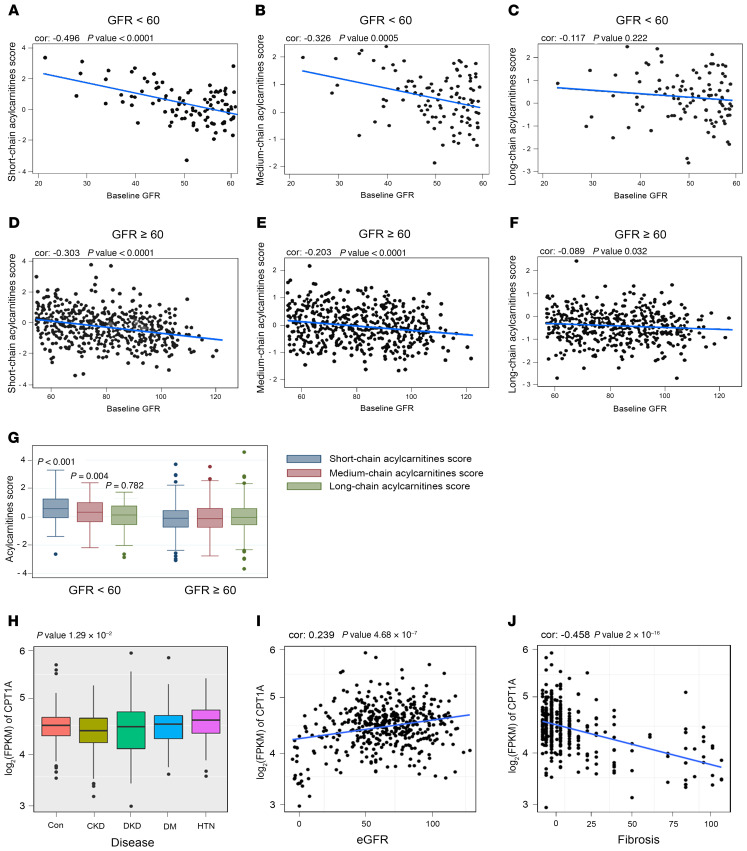
Chronic kidney disease (CKD) remains a major epidemiological, clinical, and biomedical challenge. During CKD, renal tubular epithelial cells (TECs) present a persistent inflammatory and profibrotic response. Fatty acid oxidation (FAO), the main source of energy for TECs, is reduced in kidney fibrosis and contributes to its pathogenesis. To determine whether gain of function in FAO (FAO-GOF) could protect from fibrosis, we generated a conditional transgenic mouse model with overexpression of the fatty acid shuttling enzyme carnitine palmitoyl-transferase 1A (CPT1A) in TECs. Cpt1a-knockin (CPT1A-KI) mice subjected to 3 models of renal fibrosis (unilateral ureteral obstruction, folic acid nephropathy [FAN], and adenine-induced nephrotoxicity) exhibited decreased expression of fibrotic markers, a blunted proinflammatory response, and reduced epithelial cell damage and macrophage influx. Protection from fibrosis was also observed when Cpt1a overexpression was induced after FAN. FAO-GOF restored oxidative metabolism and mitochondrial number and enhanced bioenergetics, increasing palmitate oxidation and ATP levels, changes that were also recapitulated in TECs exposed to profibrotic stimuli. Studies in patients showed decreased CPT1 levels and increased accumulation of short- and middle-chain acylcarnitines, reflecting impaired FAO in human CKD. We propose that strategies based on FAO-GOF may constitute powerful alternatives to combat fibrosis inherent to CKD.

Keywords: Chronic kidney disease; Fatty acid oxidation; Fibrosis; Nephrology.


Conflict of interest statement

Conflict of interest: The authors have declared that no conflict of interest exists.

Figures

Figure 1
Figure 1. Characterization of doxycycline-inducible Cpt1a gene overexpression in the transgenic mouse model for the inducible Cpt1a gene in renal epithelial cells.
(A) Schematic depicting the strategy to generate mice with inducible renal tubular epithelial cell–specific overexpression of CPT1A. (B) PCR analysis of offspring genotypes from these crosses. Genomic DNA analysis by PCR for the Pax8-rtTA allele generates a 595-bp band (Supplemental Table 1). The GFP, exon, and FRT PCRs are described in Supplemental Figure 1A. (C) mRNA levels of the Cpt1a gene were determined by qRT-PCR in total kidney tissue of mice treated with doxycycline for 3 weeks. Data represent the mean ± SEM (n = 6 mice). **P < 0.05 compared with kidneys from WT mice. (D) Immunoblots depicting protein levels of CPT1A and GFP in kidneys and livers of 3 individual mice per group. β-actin was used for normalization purposes. (E) Bar graphs represent the mean ± SEM of fold changes corresponding to densitometric analyses (n = 6 mice). **P < 0.01 compared with kidneys from WT mice. (F) Representative images of double immunofluorescence staining with the proximal tubular marker lotus tetragonolobus lectin (LTL), GFP, DAPI (nuclei), and merge of all 3. (G) Staining with DAPI (nuclei), CPT1A, and the mitochondrial marker ATP synthase beta-subunit (βF1). All panels show immunofluorescence images of kidneys from WT and Pax8-CPT1A mice after doxycycline administration. Scale bar: 100 μm (F and G). (H) Radiolabeled palmitate-derived CO2 and acid-soluble products (ASP) were determined after incubation of 14C-palmitate with kidney tissue from WT or Pax8-CPT1A mice after doxycycline treatment. Bar graphs represent the mean ± SEM (n = 4 mice). *P < 0.05 compared with kidneys from WT mice. Statistical significance between 2 independent groups was determined using nonparametric 2-tailed Mann-Whitney U test; more than 2 groups were compared with Kruskal-Wallis test.
Figure 2
Figure 2. CPT1A overexpression prevents FAN-associated kidney function deterioration and experimental renal fibrosis.
(A) Representative microphotographs from 1 mouse per group of H&E (upper panels) and Sirius red (lower panels) staining of kidneys from WT and Pax8-CPT1A mice subjected to FAN after doxycycline treatment (Dox). Scale bars: 50 μm. Quantification of Sirius red staining represents the mean ± SEM, n = 6 mice. *P < 0.05 compared with FAN/C kidneys in WT mice, respectively. (B and C) Serum blood urea nitrogen (BUN) (B) and serum creatinine (C) levels of WT and Pax8-CPT1A mice subjected to FAN after doxycycline treatment. Data represent the mean ± SEM (n = 6 mice). *P < 0.05, **P < 0.01 compared with respective experimental control (CT) condition; #P < 0.05 compared with WT mice with the same experimental condition. (D) Immunoblots depicting fibronectin (FN), carnitine palmitoyltransferase 1A (CPT1A), GFP, and alpha-smooth muscle actin (α-SMA) protein levels in kidneys from control (CT) and FA-treated (FAN) WT and Pax8-CPT1A mice after doxycycline induction. (E) Bar graphs represent the mean ± SEM of fold changes corresponding to densitometric analyses (n = 6 mice). (F) mRNA levels of fibrosis-associated genes were determined by qRT-PCR using TaqMan qPCR probes in kidneys from CT and FAN WT and Pax8-CPT1A mice after doxycycline induction. Bar graphs represent the mean ± SEM of fold changes (n = 6 mice). (E and F) *P < 0.05, **P < 0.01 compared with their corresponding CT kidneys; #P < 0.05, ##P < 0.01 compared with kidneys from WT mice with the same experimental condition. Statistical significance between 2 independent groups was determined using nonparametric 2-tailed Mann-Whitney U test; more than 2 groups were compared with Kruskal-Wallis test. For gene nomenclature, see Supplemental Table 4.
Figure 3
Figure 3. CPT1A prevents impaired mitochondrial morphology and FAO defect in FAN-induced kidney fibrosis.
(A) Representative electron microscopy images of cortical proximal tubules from control and Pax8-CPT1A mice subjected to FAN after doxycycline induction. Scale bars: 10 μm (upper panels), 100 nm (lower panels). (B) Mitochondrial DNA copy number (mtDNA) was determined in kidneys of WT and Pax8-CPT1A mice in the FAN model. Bar graphs represent the mean ± SEM of fold changes (n = 6 mice). **P < 0.01 compared with their corresponding control (CT) kidneys; ##P < 0.05 compared with kidneys from WT mice with the same experimental condition. (C) Radiolabeled palmitate-derived CO2 was determined after incubation of 14C-palmitate with kidney tissue from WT and Pax8-CPT1A mice in the FAN model after doxycycline induction. (D) ATP levels in total kidney tissue determined in mice subjected to FAN model. (C and D) Bar graphs represent the mean ± SEM (n = 4 mice). *P < 0.05, **P < 0.01 compared with their corresponding CT kidneys; #P < 0.05 compared with kidneys from WT mice with the same experimental condition. (E and F) mRNA levels of glucose utilization–associated genes (E) and peroxisomal/mitochondrial function–associated genes (F) were determined by qRT-PCR using TaqMan qPCR probes in kidneys from CT and FA-treated (FAN) WT and Pax8-CPT1A mice after doxycycline induction. (E and F) Bar graphs represent the mean ± SEM of fold changes (n = 6 mice). *P < 0.05, **P < 0.01 compared with their corresponding CT kidneys; #P < 0.05, ##P < 0.01 compared with kidneys from WT mice with the same experimental condition. Statistical significance between 2 independent groups was determined using nonparametric 2-tailed Kruskal-Wallis test. For detailed gene nomenclature, see Supplemental Table 4.
Figure 4
Figure 4. CPT1A overexpression prevents TGF-β1–induced FAO impairment.
(A) Bright field or GFP immunofluorescence images of primary kidney epithelial cells (TECs) isolated from kidneys of WT and Pax8-CPT1A mice. Scale bar: 20 μm. (B) Oxygen consumption rate (OCR) of TECs from WT mice was measured with a Seahorse XF24 Extracellular Flux Analyzer. Where indicated, cells were pretreated with palmitate-BSA FAO substrate (200 μM) or the CPT1 inhibitor etomoxir (Eto, 400 μM). Oligomycin (1 μM), FCCP (3 μM), and a combination of antimycin A (1 μM) and rotenone (1 μM) (AA/Rot) were injected sequentially at the time points indicated. Each data point represents the mean ± SEM of 4 independent experiments, each performed in triplicate. (C) OCR of TECs from WT and Pax8-CPT1A mice was measured with a Seahorse XF24 Extracellular Flux Analyzer. Bar graphs (right panel) show the rates of OCR associated with basal, proton-leak, ATP-linked, maximum, reserve capacity, and nonmitochondrial respiratory statuses. *P < 0.05 compared with their corresponding control (CT) TECs; #P < 0.05 compared with TECs from WT mice with the same experimental condition. (D) Extracellular acidification rate (ECAR) of cells treated as in A. Each data point represents the mean ± SEM of 4 independent experiments, each performed in triplicate. (E) ATP levels of TECs from WT and Pax8-CPT1A mice. Bar graphs represent the mean ± SEM (n = 4 mice per group). #P < 0.05 compared with kidneys from WT mice with the same experimental condition. Statistical significance between 2 independent groups was determined using nonparametric 2-tailed Kruskal-Wallis test.
Figure 5
Figure 5. Overexpression of CPT1A reduces M1 macrophage infiltration in the FAN model.
(A) Representative micrographs of 1 mouse per group showing the expression of F4/80 in kidney sections of mice treated as described above. Scale bar: 50 μm. (B) Bar graph represents the quantification of the percentage of F4/80+ stained area in FA-treated mouse kidneys (FAN). Bar graphs represent the mean ± SEM, n = 4 mice. (C) Representative multiparameter flow cytometry dot plots showing the expression of CD45 and F4/80 in kidney cells from WT and Pax8-CPT1A mice subjected to FAN after doxycycline induction (upper panels) (1 mouse per group is represented). CD86 and CD206 were used to determine the proportion of M1 and M2 macrophage subpopulations, respectively, in the total macrophage population (F4/80+, CD45+) (lower panels). Numbers in quadrants indicate cell proportions in percentage of cells that express both markers. (D) Bar graph represents the percentage of kidney cells expressing CD86 (M1), CD206 (M2), or both (M1/M2) markers. Data represent mean ± SEM (n = 4 mice). ***P < 0.001 compared with M1 subpopulation in damaged kidneys from WT mice; #P < 0.05 compared with corresponding cell subpopulation in damaged kidneys from WT mice. (E) mRNA levels of inflammation-associated genes were determined by qRT-PCR using TaqMan qPCR probes in kidneys from control (CT) and FA-treated (FAN) WT and Pax8-CPT1A mice after doxycycline induction. Bar graphs represent the mean ± SEM of fold changes (n = 6 mice). *P < 0.05, **P < 0.01 compared with their corresponding CT kidneys; #P < 0.05 compared with kidneys from WT mice with the same experimental condition. Statistical significance between 2 independent groups was determined using nonparametric 2-tailed Mann-Whitney U test; more than 2 groups were compared with Kruskal-Wallis test. For detailed gene nomenclature, see Supplemental Table 4.
Figure 6
Figure 6. CPT1A overexpression reduces epithelial cell damage in the FAN model.
(A) Representative flow cytometry dot plots from obstructed kidneys of WT and Pax8-CPT1A mice subjected to FAN after doxycycline treatment. Cells were gated for CD45 negative/epithelial cell adhesion molecule (EpCAM) positive (upper panels) and selected for the presence of CD24 (lower panels). Numbers in quadrants indicate cell proportions. (B) Bar graphs show the percentage of kidney cells positive for CD24. Data represent the mean ± SEM (n = 4 mice). *P < 0.05 compared with their corresponding control (CT) kidneys; #P < 0.05 compared with damaged kidneys in WT mice. (C and D) Representative immunoblots and densitometries corresponding to CPT1A and phosphorylated RIPK3 protein levels in kidneys as in A (n = 3 mice). *P < 0.05, **P < 0.01 compared with their corresponding CT kidneys; #P < 0.05, ##P < 0.01 compared with kidneys from WT mice with the same experimental condition. (E) mRNA levels of RIPK1, RIPK3, and MLKL were determined by qRT-PCR in kidneys as in A. Bar graphs represent the mean ± SEM of fold changes (n = 6 mice). ***P < 0.001 compared with their corresponding CT kidneys; ##P < 0.01 compared with kidneys from WT mice with the same experimental condition. (F) mRNA levels of apoptosis-associated genes were determined by qRT-PCR using TaqMan qPCR probes in kidneys from CT and FA-treated (FAN) WT and Pax8-CPT1A mice after doxycycline induction. Bar graphs represent the mean ± SEM of fold changes (n = 6 mice). *P < 0.05, **P < 0.01 compared with their CT kidneys; ##P < 0.05 compared with kidneys from WT mice with the same experimental condition. Statistical significance between 2 independent groups was determined using nonparametric 2-tailed Kruskal-Wallis test. For detailed gene nomenclature, see Supplemental Table 4.
Figure 7
Figure 7. CPT1A upregulation after FA-induced renal disease mitigates FAN-associated kidney function deterioration, renal fibrosis, and FAO defects.
(A) Representative microphotographs of H&E (upper panels) and Sirius red (lower panels) staining of kidneys from WT and Pax8-CPT1A mice subjected to FAN prior to doxycycline (Dox) (Supplemental figure 12A). Scale bars: 50 μm. Quantification of Sirius red staining represents the mean ± SEM, n = 6 mice. **P < 0.05 compared with FAN kidneys in WT mice. (B and C) Serum BUN (B) and creatinine (C) levels of WT and Pax8-CPT1A mice subjected to FAN as in A. Data represent the mean ± SEM (n = 6 mice). *P < 0.05, ***P < 0.001 compared with respective control (CT) condition; #P < 0.05 compared with WT mice with the same condition. (D) mRNA levels of α-SMA, Col1α1, FN, CPT1A, and Ppargc1a determined by qRT-PCR in kidneys of WT and Pax8-CPT1A mice subjected to FAN as in A. Bar graphs represent the mean ± SEM of fold changes (n = 6 mice). *P < 0.05, **P < 0.01 compared with corresponding CT kidneys; #P < 0.05, ##P < 0.01 compared with kidneys from WT mice with the same condition. (E and F) ATP production rate of TECs from WT and Pax8-CPT1A mice subjected to FAN as in A. ***P < 0.001 compared with TECs from WT mice with the same condition. (F) Oxygen consumption rate (OCR) of TECs from WT and Pax8-CPT1A mice subjected to FAN as in A. Bar graphs (right panel) show the rates of OCR as in Figure 4C. **P < 0.01 compared with their corresponding control (CT) TECs; #P < 0.05 and ##P < 0.01 compared with TECs from WT mice with the same condition. Statistical significance between 2 independent groups was determined using nonparametric 2-tailed Mann-Whitney U test; more than 2 groups were compared with Kruskal-Wallis test.
Figure 8
Figure 8. Plasma acylcarnitines and CPT1A levels in patients with CKD.
(AC) Correlation between baseline GFR values and plasma short-chain acylcarnitines (A), medium-chain acylcarnitines (B), and long-chain acylcarnitines (C) score in CKD patients with GFR less than 60 mL/min. (DF) Correlation between baseline GFR values and plasma short-chain acylcarnitines (D), medium-chain acylcarnitines (E), and long-chain acylcarnitines (F) score in CKD patients with GFR greater than or equal to 60 mL/min. (G) Baseline acyl-carnitine levels by CKD stage. P values for the comparison of acylcarnitine levels between participants with GFR lower than 60 mL/min versus GFR greater than or equal to 60 mL/min. (H) CPT1A levels in renal biopsies from control and patients with CKD, diabetic kidney disease (DKD), diabetes mellitus (DM), or hypertension (HTN). (I and J) Correlation between CPT1A kidney levels and eGFR (I) or fibrosis score (J). For box-and-whisker plots (G and H), within each box, horizontal white lines denote median values; boxes extend from the 25th to the 75th percentile of each group’s distribution of values; vertical extending lines denote adjacent values (i.e., the most extreme values within 1.5 IQR of the 25th and 75th percentile of each group); dots denote observations outside the range of adjacent values. (AG) χ2 and Student’s t test were used to compare categorical and quantitative variables, respectively. (H) ANOVA test was used to assess the significance across different disease groups. Cor.test function in R was used to obtain the Pearson’s correlation and the corresponding P values.

References

    1. Kazancioglu R. Risk factors for chronic kidney disease: an update. Kidney Int Suppl (2011) 2013;3(4):368–371. doi: 10.1038/kisup.2013.79. - DOI - PMC - PubMed
    1. Drawz PE, Rosenberg ME. Slowing progression of chronic kidney disease. Kidney Int Suppl (2011) 2013;3(4):372–376. doi: 10.1038/kisup.2013.80. - DOI - PMC - PubMed
    1. Kang HM, et al. Defective fatty acid oxidation in renal tubular epithelial cells has a key role in kidney fibrosis development. Nat Med. 2015;21(1):37–46. doi: 10.1038/nm.3762. - DOI - PMC - PubMed
    1. Chung KW, et al. Mitochondrial damage and activation of the STING pathway lead to renal inflammation and fibrosis. Cell Metab. 2019;30(4):784–799. doi: 10.1016/j.cmet.2019.08.003. - DOI - PMC - PubMed
    1. Ly JP, et al. Mouse models to study kidney development, function and disease. Curr Opin Nephrol Hypertens. 2011;20(4):382–390. doi: 10.1097/MNH.0b013e328347cd4a. - DOI - PubMed

Publication types

MeSH terms