

Antibody-mediated depletion of viral reservoirs is limited in SIV-infected macaques treated early with antiretroviral therapy
- PMID: 33465055
- PMCID: PMC7954603
- DOI: 10.1172/JCI142421
Antibody-mediated depletion of viral reservoirs is limited in SIV-infected macaques treated early with antiretroviral therapy
Abstract
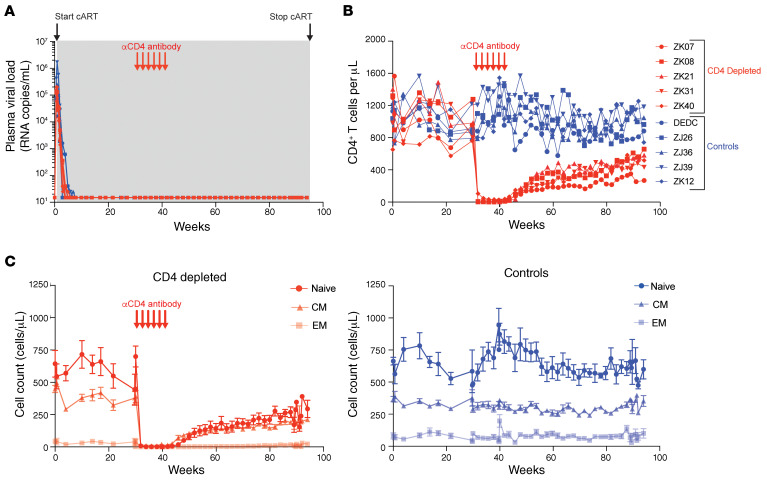
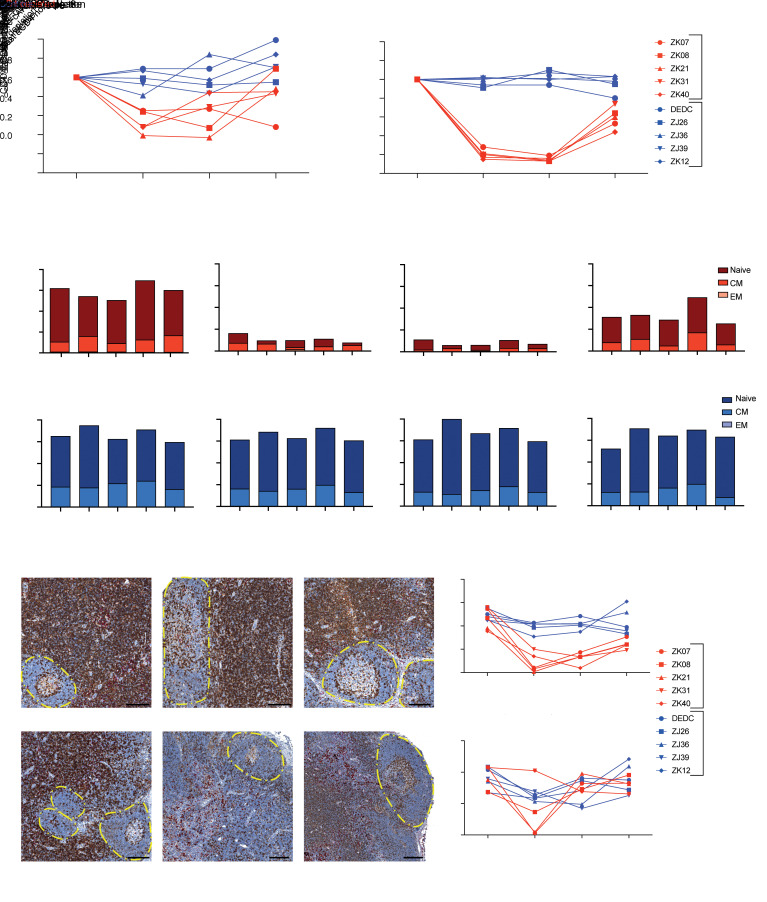
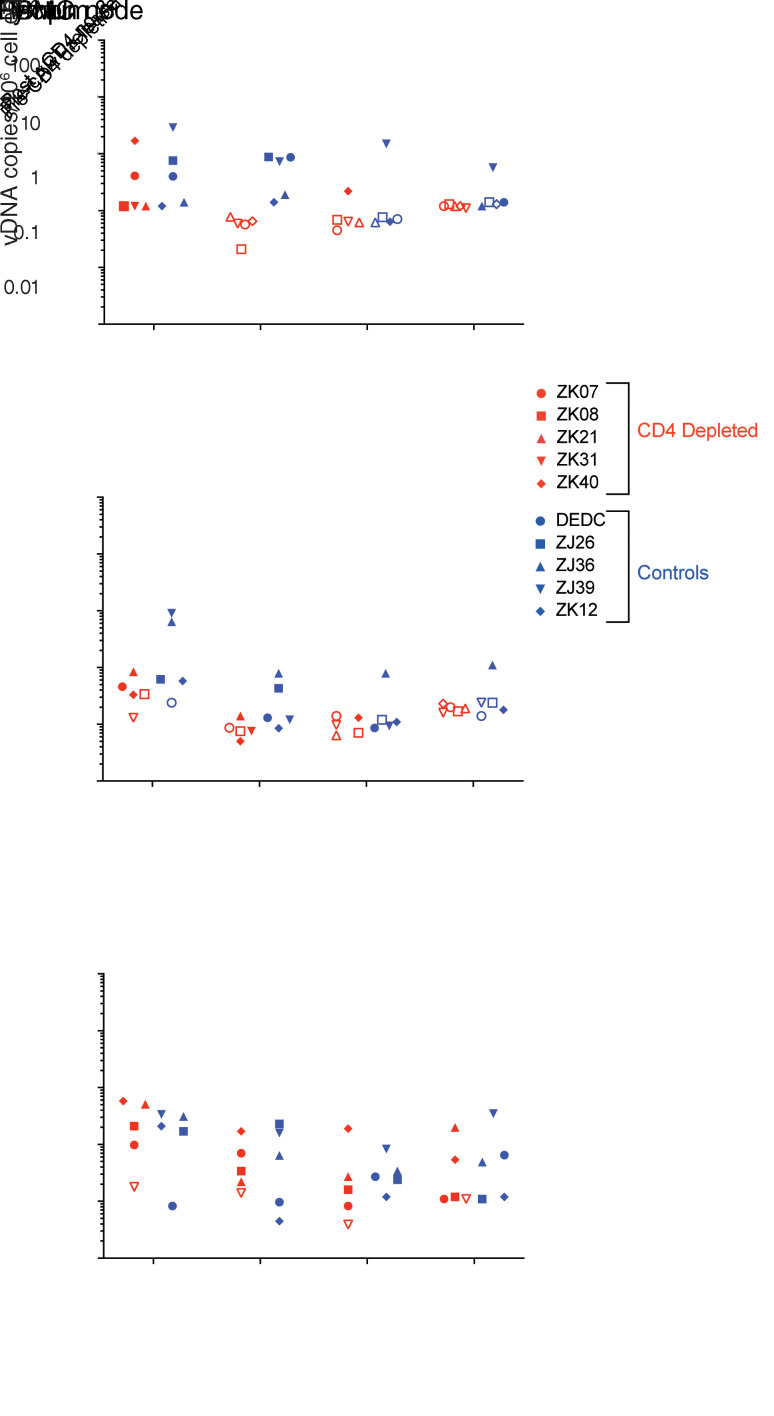
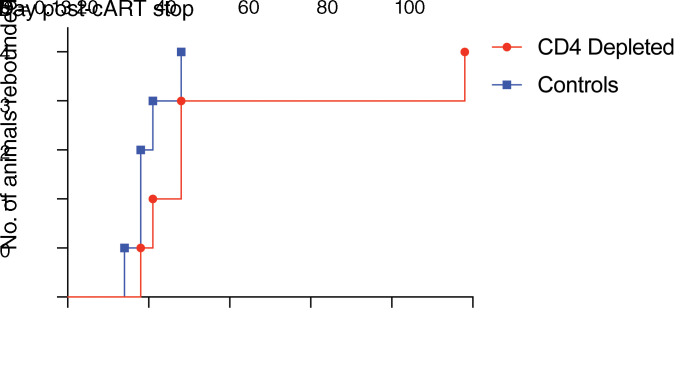
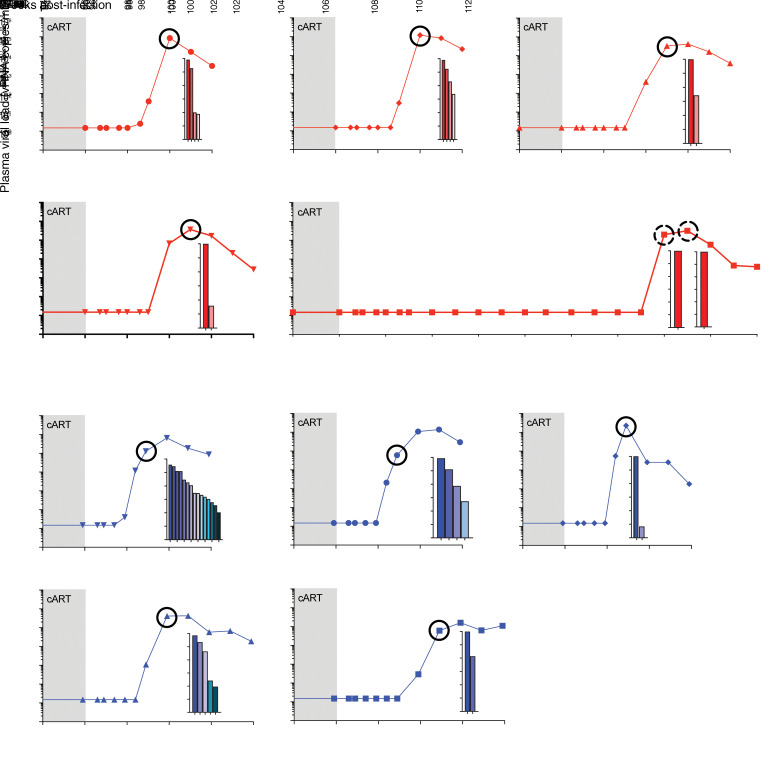
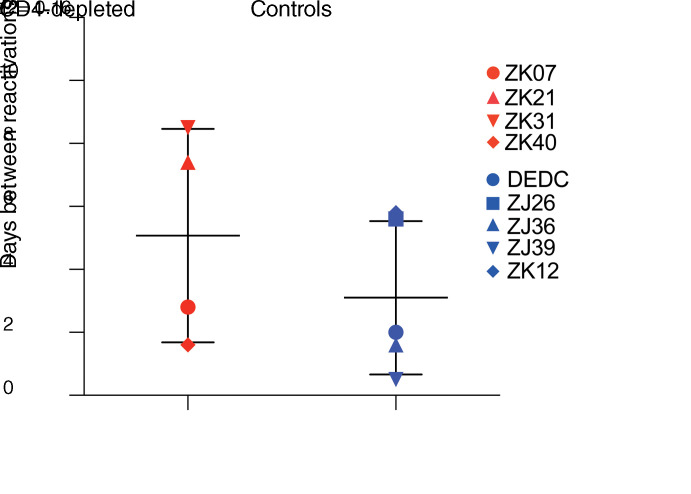
The effectiveness of virus-specific strategies, including administered HIV-specific mAbs, to target cells that persistently harbor latent, rebound-competent HIV genomes during combination antiretroviral therapy (cART) has been limited by inefficient induction of viral protein expression. To examine antibody-mediated viral reservoir targeting without a need for viral induction, we used an anti-CD4 mAb to deplete both infected and uninfected CD4+ T cells. Ten rhesus macaques infected with barcoded SIVmac239M received cART for 93 weeks starting 4 days after infection. During cART, 5 animals received 5 to 6 anti-CD4 antibody administrations and CD4+ T cell populations were then allowed 1 year on cART to recover. Despite profound CD4+ T cell depletion in blood and lymph nodes, time to viral rebound following cART cessation was not significantly delayed in anti-CD4-treated animals compared with controls. Viral reactivation rates, determined based on rebounding SIVmac239M clonotype proportions, also were not significantly different in CD4-depleted animals. Notably, antibody-mediated depletion was limited in rectal tissue and negligible in lymphoid follicles. These results suggest that, even if robust viral reactivation can be achieved, antibody-mediated viral reservoir depletion may be limited in key tissue sites.
Keywords: AIDS/HIV; T cells.
Conflict of interest statement
Figures
Similar articles
-
SMAC Mimetic Plus Triple-Combination Bispecific HIVxCD3 Retargeting Molecules in SHIV.C.CH505-Infected, Antiretroviral Therapy-Suppressed Rhesus Macaques.J Virol. 2020 Oct 14;94(21):e00793-20. doi: 10.1128/JVI.00793-20. Print 2020 Oct 14. J Virol. 2020. PMID: 32817214 Free PMC article.
-
Antibody-Mediated CD4 Depletion Induces Homeostatic CD4+ T Cell Proliferation without Detectable Virus Reactivation in Antiretroviral Therapy-Treated Simian Immunodeficiency Virus-Infected Macaques.J Virol. 2018 Oct 29;92(22):e01235-18. doi: 10.1128/JVI.01235-18. Print 2018 Nov 15. J Virol. 2018. PMID: 30185596 Free PMC article.
-
Evaluating the Intactness of Persistent Viral Genomes in Simian Immunodeficiency Virus-Infected Rhesus Macaques after Initiating Antiretroviral Therapy within One Year of Infection.J Virol. 2019 Dec 12;94(1):e01308-19. doi: 10.1128/JVI.01308-19. Print 2019 Dec 12. J Virol. 2019. PMID: 31597776 Free PMC article.
-
Brain macrophages harbor latent, infectious simian immunodeficiency virus.AIDS. 2019 Dec 1;33 Suppl 2(Suppl 2):S181-S188. doi: 10.1097/QAD.0000000000002269. AIDS. 2019. PMID: 31789817 Free PMC article. Review.
-
HIV Persistence in Adipose Tissue Reservoirs.Curr HIV/AIDS Rep. 2018 Feb;15(1):60-71. doi: 10.1007/s11904-018-0378-z. Curr HIV/AIDS Rep. 2018. PMID: 29423731 Free PMC article. Review.
Cited by
-
Early antiretroviral therapy in SIV-infected rhesus macaques reveals a multiphasic, saturable dynamic accumulation of the rebound competent viral reservoir.PLoS Pathog. 2024 Apr 9;20(4):e1012135. doi: 10.1371/journal.ppat.1012135. eCollection 2024 Apr. PLoS Pathog. 2024. PMID: 38593120 Free PMC article.
-
Effect of anti-CD4 mAb induced by inhibiting B cell disorder on immune reconstruction of HIV-infected immunological non-responders.Mol Med. 2025 Jun 20;31(1):244. doi: 10.1186/s10020-025-01286-3. Mol Med. 2025. PMID: 40542350 Free PMC article.
-
CD8+ cells and small viral reservoirs facilitate post-ART control of SIV in Mauritian cynomolgus macaques.bioRxiv [Preprint]. 2023 Mar 2:2023.03.01.530655. doi: 10.1101/2023.03.01.530655. bioRxiv. 2023. Update in: PLoS Pathog. 2023 Sep 25;19(9):e1011676. doi: 10.1371/journal.ppat.1011676. PMID: 36909458 Free PMC article. Updated. Preprint.
-
Impact of alemtuzumab-mediated lymphocyte depletion on SIV reservoir establishment and persistence.PLoS Pathog. 2024 Aug 22;20(8):e1012496. doi: 10.1371/journal.ppat.1012496. eCollection 2024 Aug. PLoS Pathog. 2024. PMID: 39173097 Free PMC article.
-
Transient CD4+ T cell depletion during suppressive ART reduces the HIV reservoir in humanized mice.PLoS Pathog. 2023 Dec 6;19(12):e1011824. doi: 10.1371/journal.ppat.1011824. eCollection 2023 Dec. PLoS Pathog. 2023. PMID: 38055722 Free PMC article.
References
Publication types
MeSH terms
Substances
Grants and funding
LinkOut - more resources
Full Text Sources
Other Literature Sources
Research Materials
